| Param | Original file | Final file |
|---|---|---|
| Filename | modeM0/AS1A13_017T01_9000006028_44839cztM0_level2.fits | modeM0/AS1A13_017T01_9000006028_44839cztM0_level2_quad_clean.evt |
| Size (bytes) | 545,008,320 | 114,454,080 |
| Size | 519.8 MB | 109.2 MB |
| Events in quadrant A | 5,382,570 | 758,844 |
| Events in quadrant B | 3,589,528 | 797,244 |
| Events in quadrant C | 3,357,562 | 763,558 |
| Events in quadrant D | 7,297,912 | 653,724 |
| Mode M0 | |||
|---|---|---|---|
| Quadrant | BADHDUFLAG | Total packets | Discarded packets |
| A | 0 | 21967 | 2 |
| B | 0 | 15525 | 2 |
| C | 0 | 15166 | 3 |
| D | 0 | 26784 | 2 |
| Mode SS | |||
|---|---|---|---|
| Quadrant | BADHDUFLAG | Total packets | Discarded packets |
| A | 0 | 148 | 0 |
| B | 0 | 148 | 0 |
| C | 0 | 148 | 0 |
| D | 0 | 148 | 0 |
| Mode M9 | |||
|---|---|---|---|
| Quadrant | BADHDUFLAG | Total packets | Discarded packets |
| A | 0 | 17 | 0 |
| B | 0 | 17 | 0 |
| C | 0 | 17 | 0 |
| D | 0 | 17 | 0 |
| Quadrant | Total seconds | Saturated seconds | Saturation percentage |
|---|---|---|---|
| A | 7056 | 249 | 3.528912% |
| B | 7057 | 110 | 1.558736% |
| C | 7056 | 103 | 1.459751% |
| D | 7056 | 560 | 7.936508% |
Noise dominated data is calculated using 1-second bins in cleaned event files. If a bin has >2000 counts, and if more than 50% of those come from <1% of pixels, then it is considered to be noise-dominated and hence unusable.
| Quadrant | # 1 sec bins | Bins with >0 counts | Bins with >2000 counts | High rate bins dominated by noise | Noise dominated (total time) | Noise dominated (detector-on time) | Marked lightcurve |
|---|---|---|---|---|---|---|---|
| A | 8851 | 7058 | 9 | 9 | 0.10% | 0.13% | 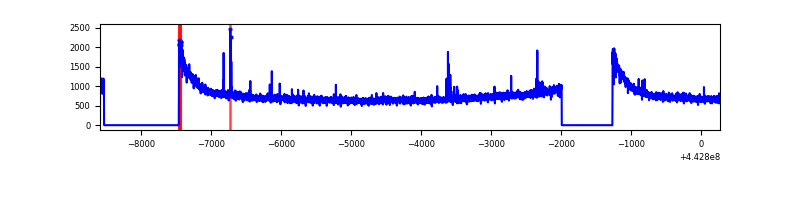 |
| B | 8852 | 7059 | 7 | 7 | 0.08% | 0.10% | 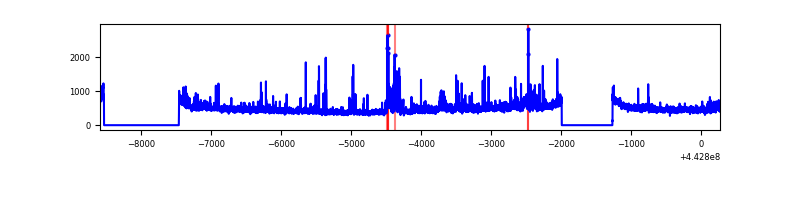 |
| C | 8851 | 7058 | 31 | 31 | 0.35% | 0.44% | 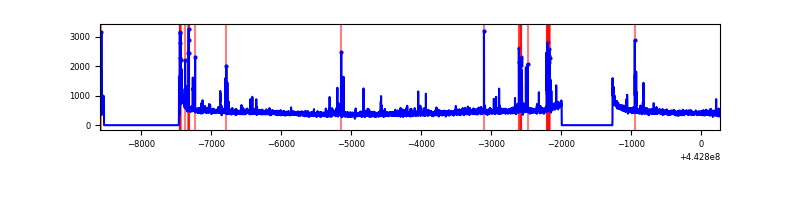 |
| D | 8851 | 7058 | 280 | 280 | 3.16% | 3.97% | 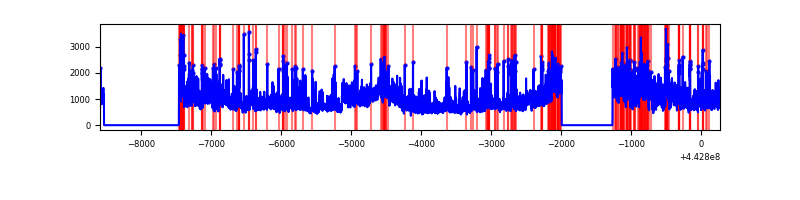 |
Top three noisy pixels from each quadrant. If the there are fewer than three noisy pixels in the level2.evt file, extra rows are filled as -1
| Pixel properties | Quadrant properties | ||||||
|---|---|---|---|---|---|---|---|
| Quadrant | DetID | PixID | Counts | Sigma | Mean | Median | Sigma |
| A | 10 | 83 | 2281957 | 13897.33 | 788 | 772 | 164.1 |
| A | 13 | 248 | 33624 | 200.14 | 788 | 772 | 164.1 |
| A | 7 | 3 | 10931 | 61.89 | 788 | 772 | 164.1 |
| B | 5 | 255 | 215921 | 1369.05 | 795 | 771 | 157.2 |
| B | 0 | 155 | 93578 | 590.55 | 795 | 771 | 157.2 |
| B | 0 | 183 | 23433 | 144.2 | 795 | 771 | 157.2 |
| C | 12 | 2 | 234790 | 1283.23 | 782 | 787 | 182.4 |
| C | 3 | 233 | 36077 | 193.52 | 782 | 787 | 182.4 |
| C | 12 | 250 | 13984 | 72.37 | 782 | 787 | 182.4 |
| D | 11 | 241 | 1544912 | 8045.16 | 758 | 734 | 191.9 |
| D | 13 | 174 | 787396 | 4098.5 | 758 | 734 | 191.9 |
| D | 1 | 52 | 599230 | 3118.16 | 758 | 734 | 191.9 |
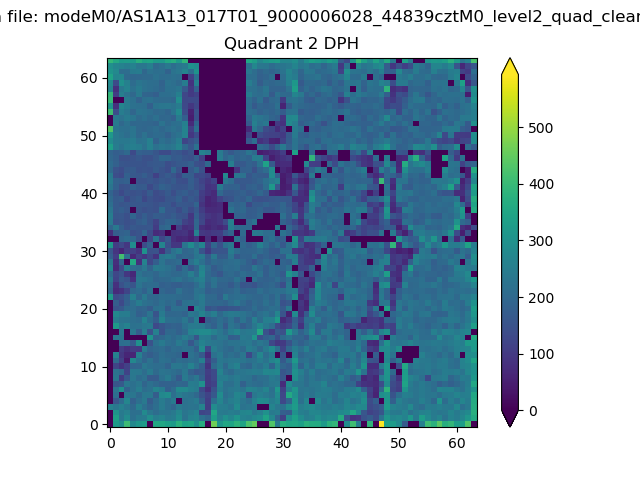
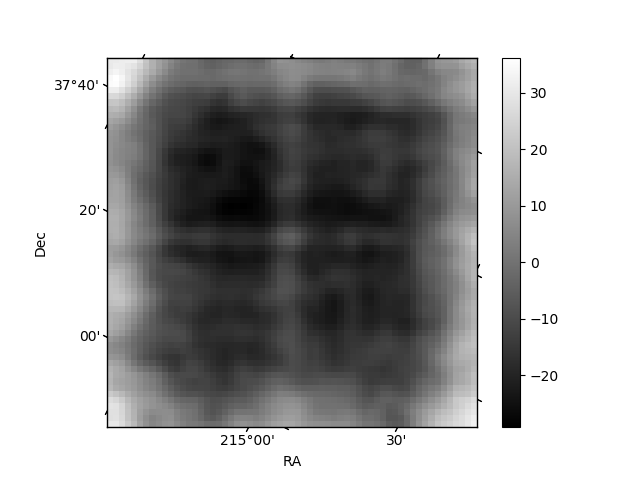
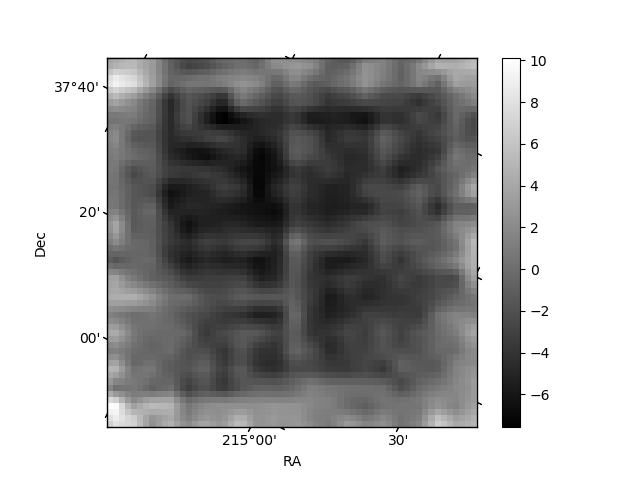
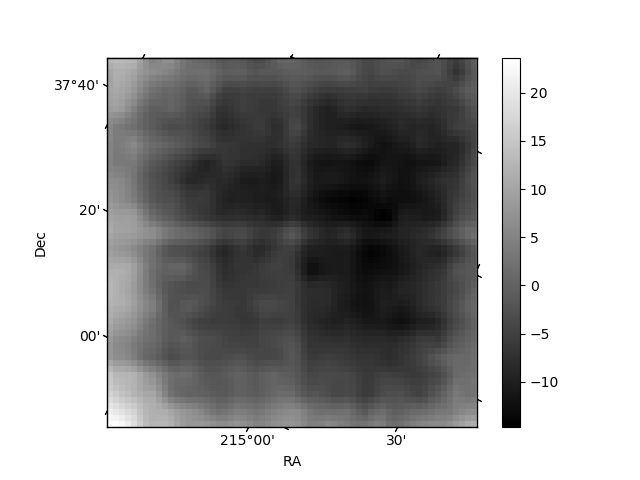
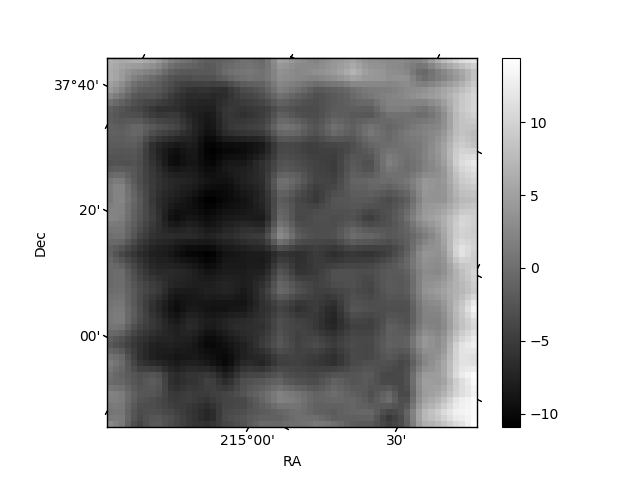
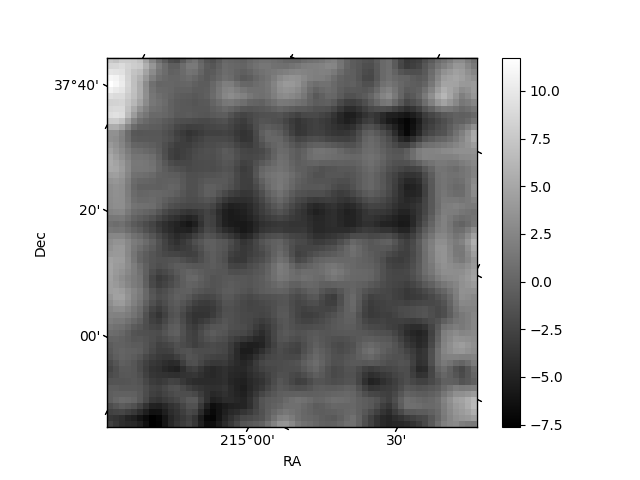
Histogram calculated using DETX and DETY for each event in the final _common_clean file
| Quadrant A | 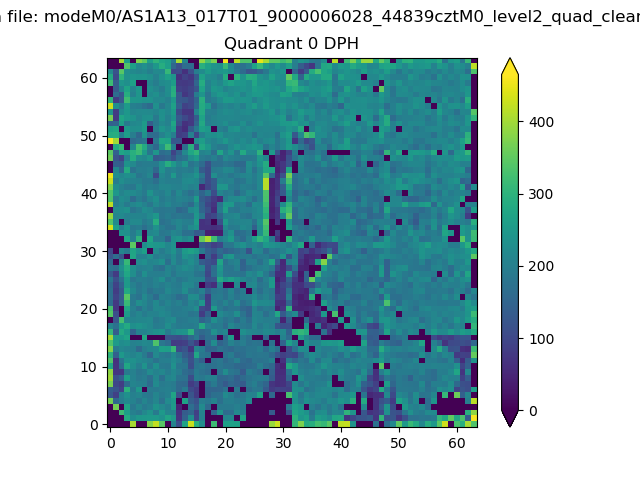 |
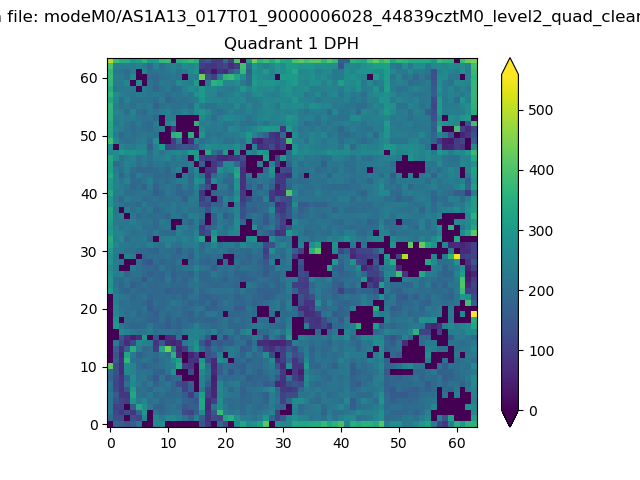 |
Quadrant B |
|---|---|---|---|
| Quadrant D | 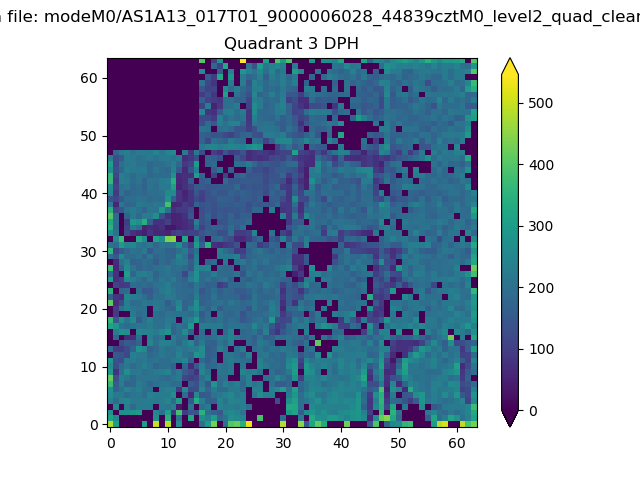 |
 |
Quadrant C |
| Plot type | Count rate plots | Images |
|---|---|---|
| Comparison with Poisson distribution Blue bars denote a histogram of data divided into 1 sec bins. Red curve is a Poisson curve with rate = median count rate of data. |
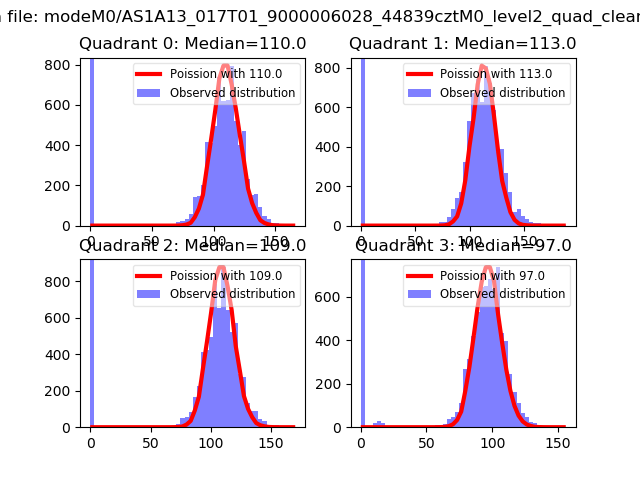 |
 |
| Quadrant-wise count rates Data is divided into 100 sec bins |
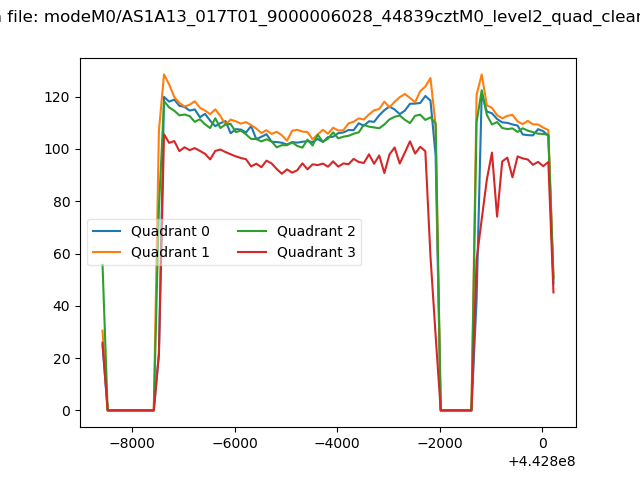 |
|
| Module-wise count rates for Quadrant A Data is divided into 100 sec bins |
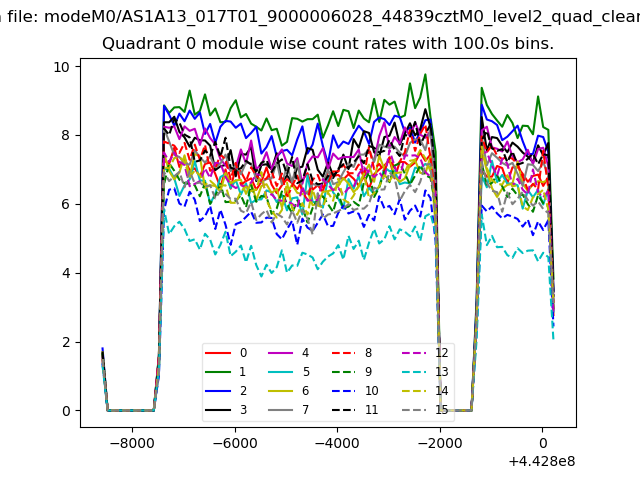 |
 |
| Module-wise count rates for Quadrant B Data is divided into 100 sec bins |
 |
 |
| Module-wise count rates for Quadrant C Data is divided into 100 sec bins |
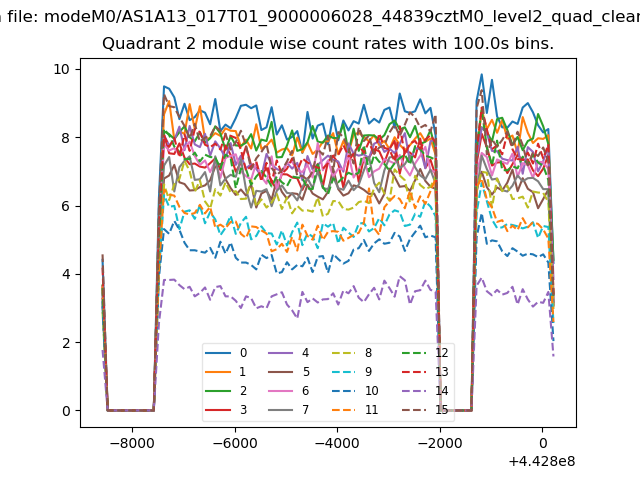 |
 |
| Module-wise count rates for Quadrant D Data is divided into 100 sec bins |
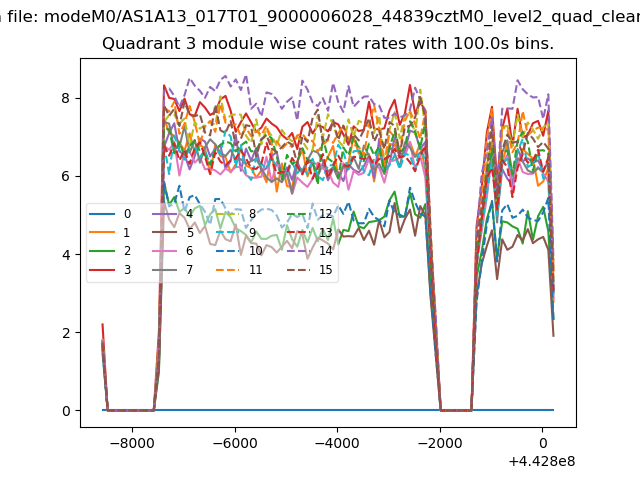 |
 |
| Parameter | Plot |
|---|---|
| CZT HV Monitor |  |
| D_VDD | 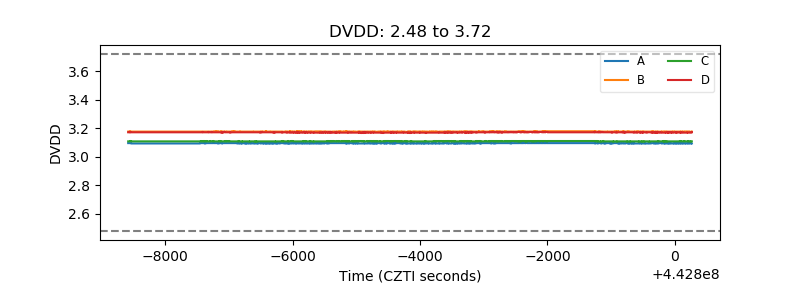 |
| Temperature 1 | 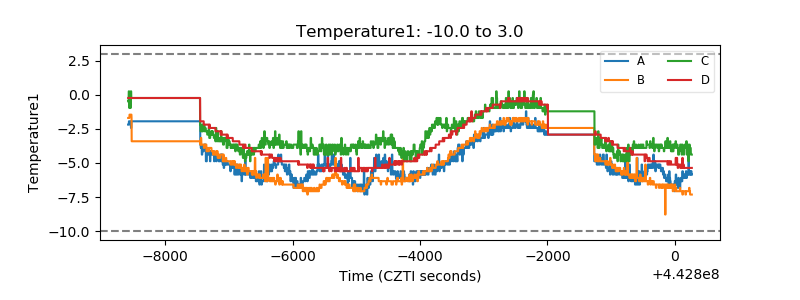 |
| Veto HV Monitor | 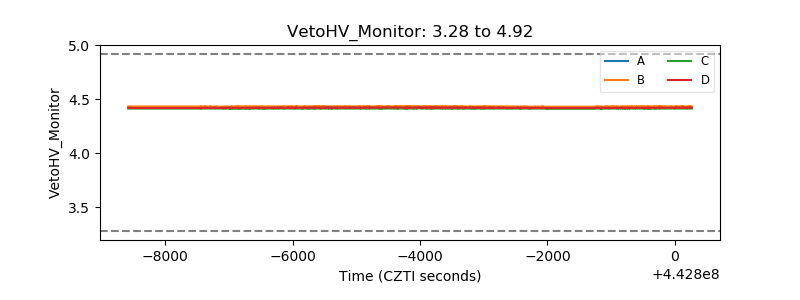 |
| Veto LLD | 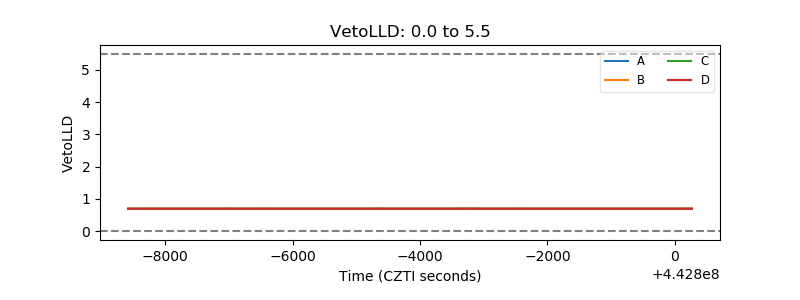 |
| Alpha Counter | 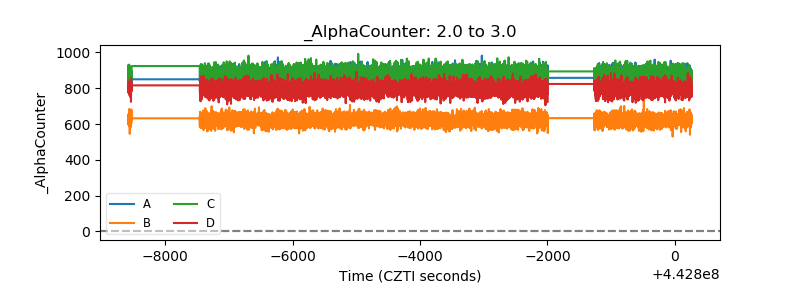 |
| _CPM_Rate | 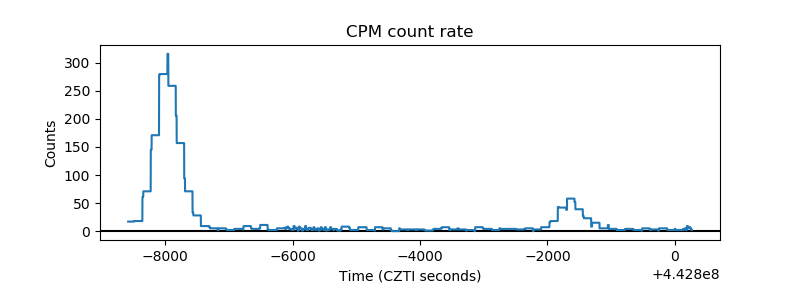 |
| CZT Counter | 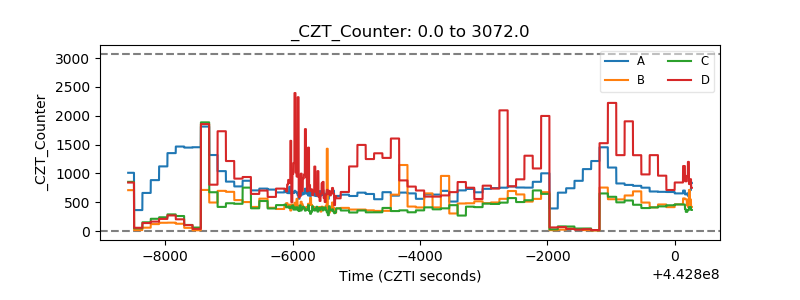 |
| +2.5 Volts monitor | 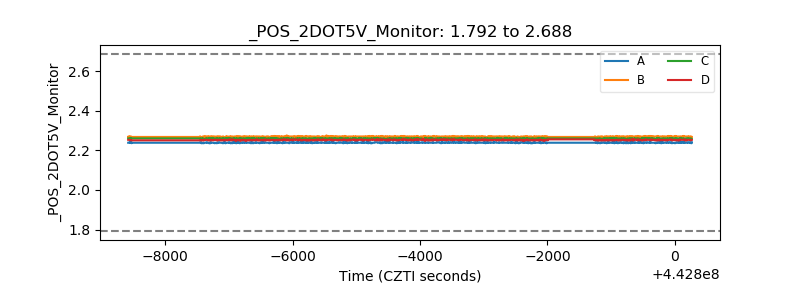 |
| +5 Volts monitor | 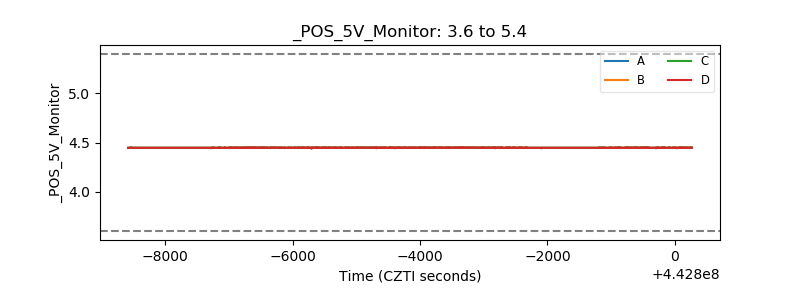 |
| _ROLL_ROT | 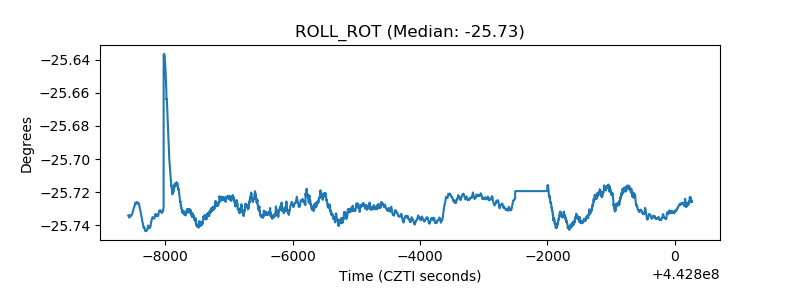 |
| _Roll_DEC | 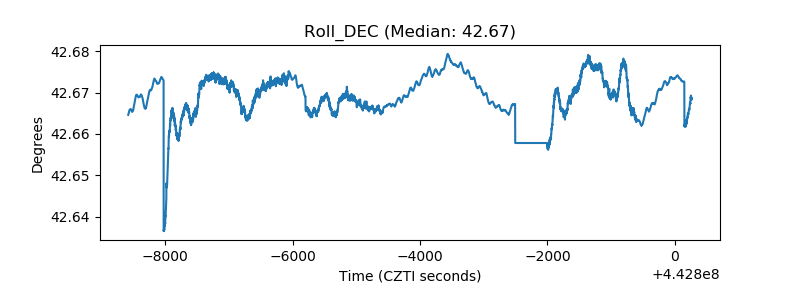 |
| _Roll_RA | 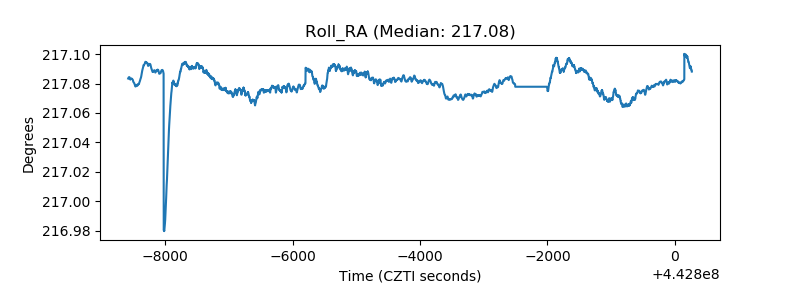 |
| Veto Counter | 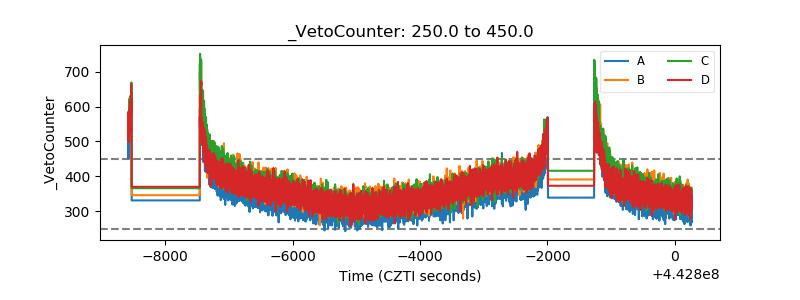 |