| Param | Original file | Final file |
|---|---|---|
| Filename | modeM0/AS1A13_017T01_9000006028_44840cztM0_level2.fits | modeM0/AS1A13_017T01_9000006028_44840cztM0_level2_quad_clean.evt |
| Size (bytes) | 630,017,280 | 125,688,960 |
| Size | 600.8 MB | 119.9 MB |
| Events in quadrant A | 5,839,534 | 849,711 |
| Events in quadrant B | 4,094,857 | 871,978 |
| Events in quadrant C | 3,661,325 | 845,052 |
| Events in quadrant D | 9,116,880 | 692,153 |
| Mode M0 | |||
|---|---|---|---|
| Quadrant | BADHDUFLAG | Total packets | Discarded packets |
| A | 0 | 24041 | 2 |
| B | 0 | 17694 | 2 |
| C | 0 | 16776 | 2 |
| D | 0 | 32682 | 2 |
| Mode SS | |||
|---|---|---|---|
| Quadrant | BADHDUFLAG | Total packets | Discarded packets |
| A | 0 | 160 | 0 |
| B | 0 | 160 | 0 |
| C | 0 | 160 | 0 |
| D | 0 | 160 | 0 |
| Mode M9 | |||
|---|---|---|---|
| Quadrant | BADHDUFLAG | Total packets | Discarded packets |
| A | 0 | 7 | 0 |
| B | 0 | 7 | 0 |
| C | 0 | 7 | 0 |
| D | 0 | 7 | 0 |
| Quadrant | Total seconds | Saturated seconds | Saturation percentage |
|---|---|---|---|
| A | 7859 | 208 | 2.646647% |
| B | 7859 | 214 | 2.722993% |
| C | 7859 | 72 | 0.916147% |
| D | 7859 | 987 | 12.558850% |
Noise dominated data is calculated using 1-second bins in cleaned event files. If a bin has >2000 counts, and if more than 50% of those come from <1% of pixels, then it is considered to be noise-dominated and hence unusable.
| Quadrant | # 1 sec bins | Bins with >0 counts | Bins with >2000 counts | High rate bins dominated by noise | Noise dominated (total time) | Noise dominated (detector-on time) | Marked lightcurve |
|---|---|---|---|---|---|---|---|
| A | 8599 | 7861 | 5 | 5 | 0.06% | 0.06% | 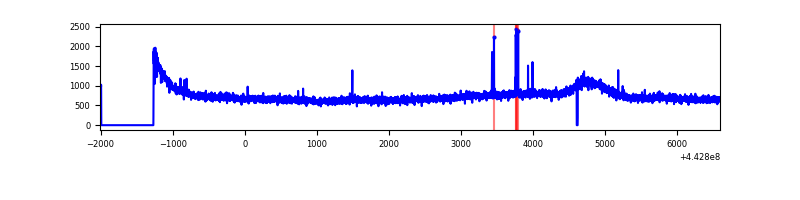 |
| B | 8599 | 7861 | 31 | 31 | 0.36% | 0.39% | 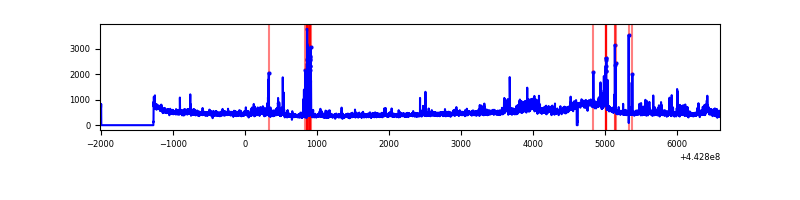 |
| C | 8599 | 7861 | 21 | 21 | 0.24% | 0.27% | 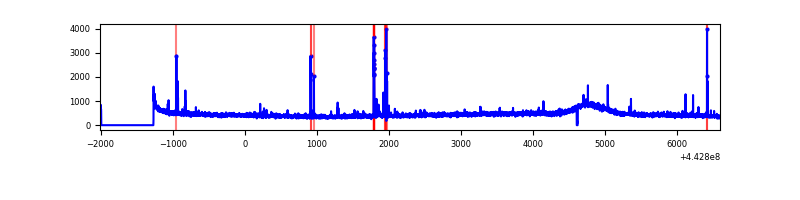 |
| D | 8599 | 7861 | 799 | 799 | 9.29% | 10.16% | 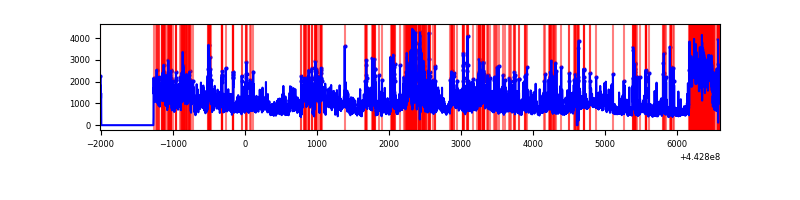 |
Top three noisy pixels from each quadrant. If the there are fewer than three noisy pixels in the level2.evt file, extra rows are filled as -1
| Pixel properties | Quadrant properties | ||||||
|---|---|---|---|---|---|---|---|
| Quadrant | DetID | PixID | Counts | Sigma | Mean | Median | Sigma |
| A | 10 | 83 | 2319737 | 12383.72 | 898 | 878 | 187.3 |
| A | 13 | 248 | 41096 | 214.78 | 898 | 878 | 187.3 |
| A | 3 | 137 | 10710 | 52.51 | 898 | 878 | 187.3 |
| B | 0 | 155 | 165860 | 926.55 | 901 | 872 | 178.1 |
| B | 5 | 255 | 101017 | 562.4 | 901 | 872 | 178.1 |
| B | 5 | 172 | 84570 | 470.04 | 901 | 872 | 178.1 |
| C | 12 | 2 | 112646 | 531.36 | 891 | 896 | 210.3 |
| C | 3 | 233 | 30016 | 138.46 | 891 | 896 | 210.3 |
| C | 1 | 3 | 16892 | 76.06 | 891 | 896 | 210.3 |
| D | 11 | 241 | 1620922 | 7656.78 | 841 | 816 | 211.6 |
| D | 1 | 52 | 1563486 | 7385.33 | 841 | 816 | 211.6 |
| D | 13 | 187 | 1156589 | 5462.3 | 841 | 816 | 211.6 |
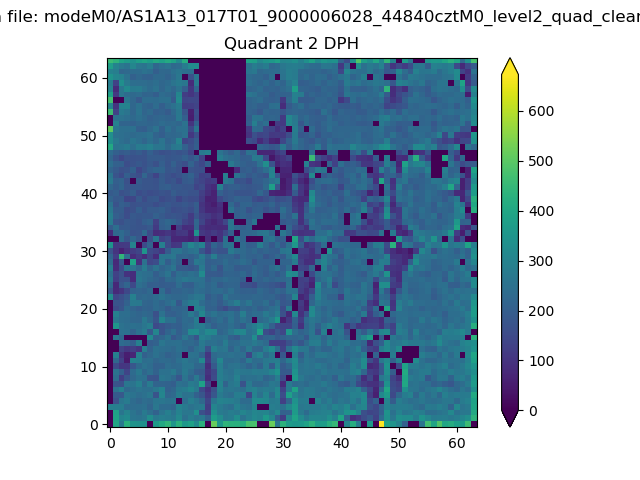
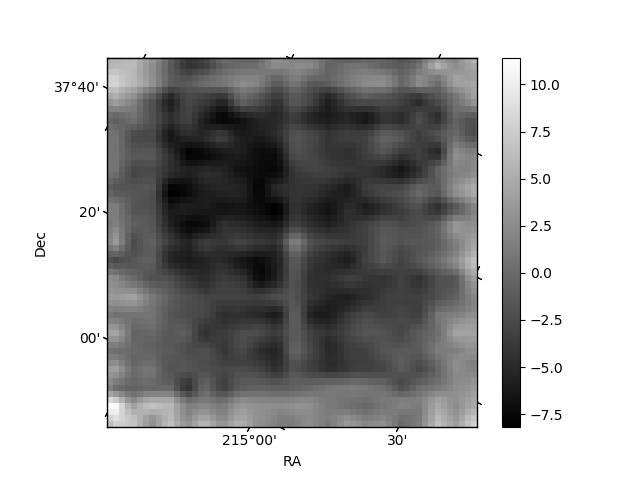
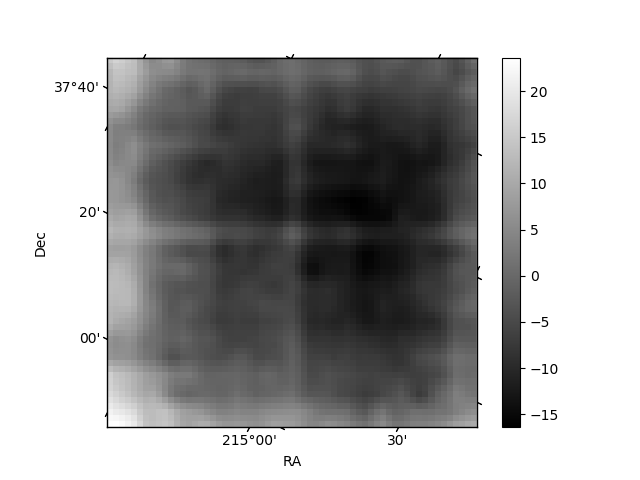
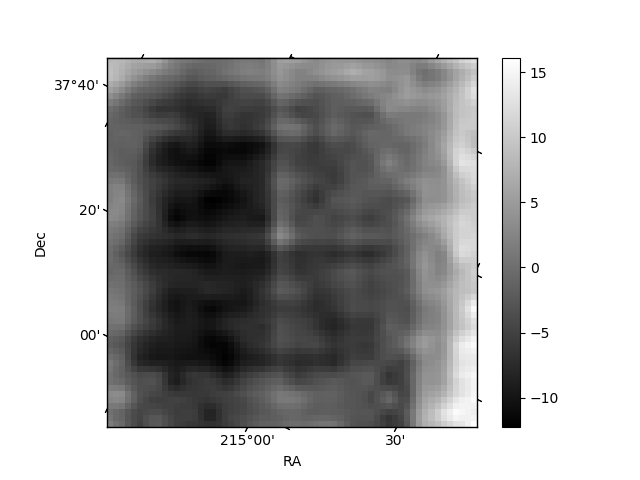
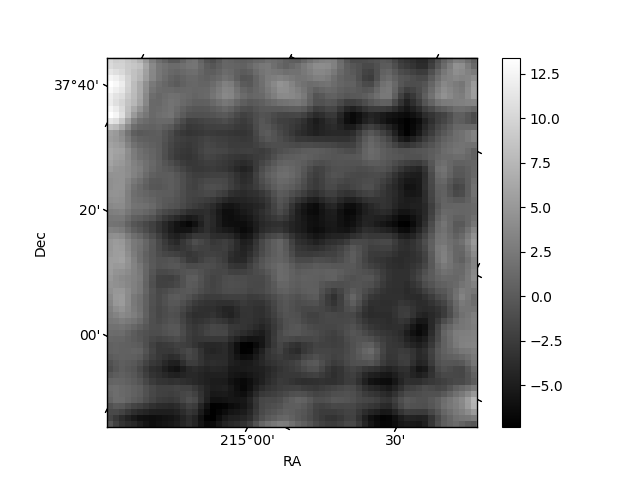
Histogram calculated using DETX and DETY for each event in the final _common_clean file
| Quadrant A | 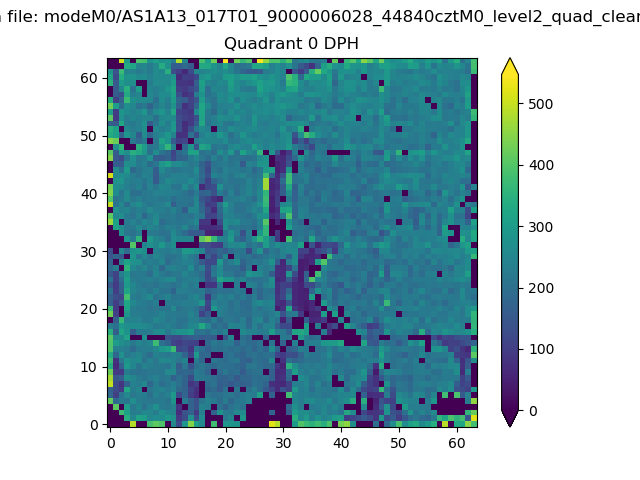 |
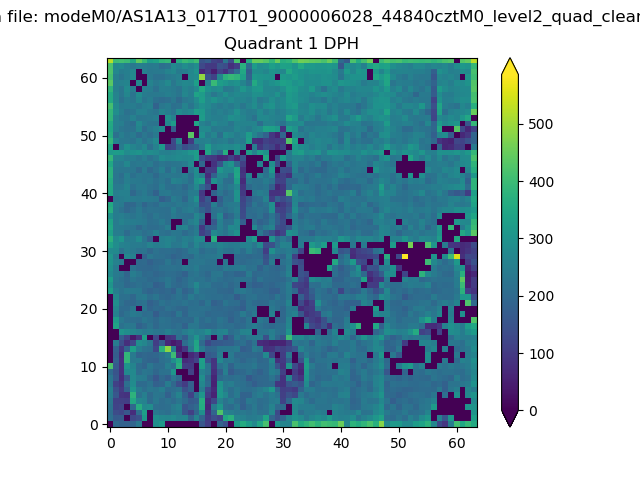 |
Quadrant B |
|---|---|---|---|
| Quadrant D | 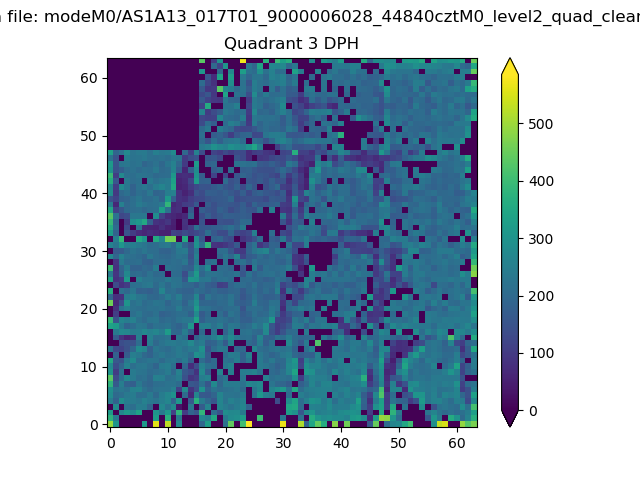 |
 |
Quadrant C |
| Plot type | Count rate plots | Images |
|---|---|---|
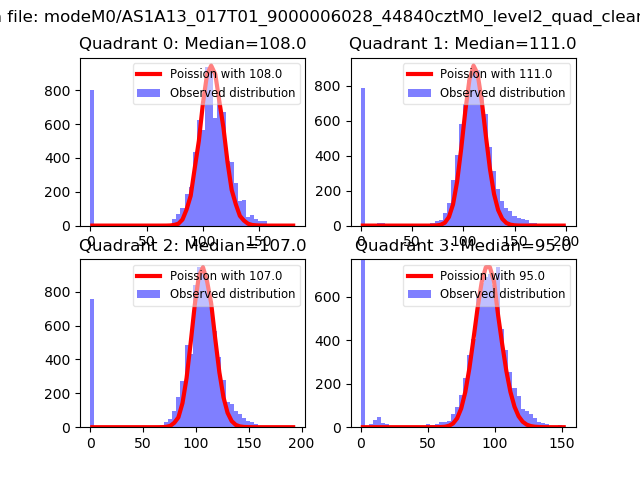
| Comparison with Poisson distribution Blue bars denote a histogram of data divided into 1 sec bins. Red curve is a Poisson curve with rate = median count rate of data. |
 |
 |
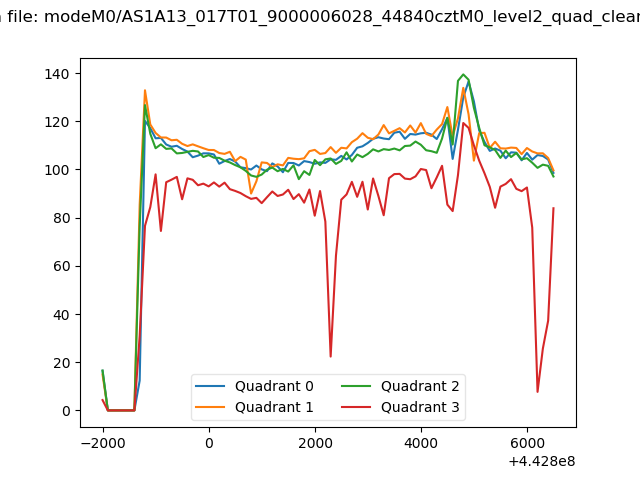
| Quadrant-wise count rates Data is divided into 100 sec bins |
 |
|
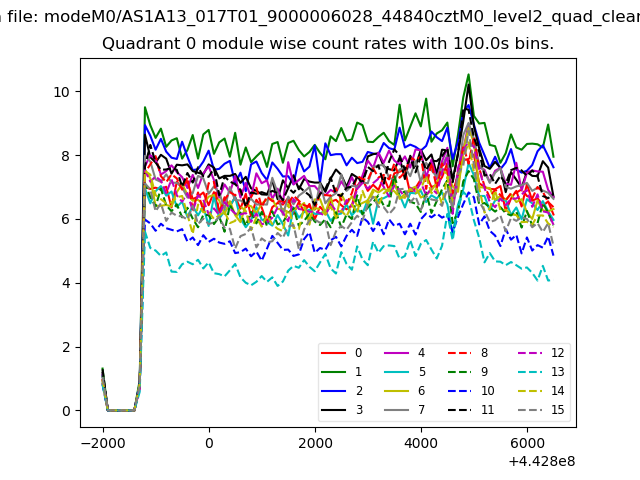
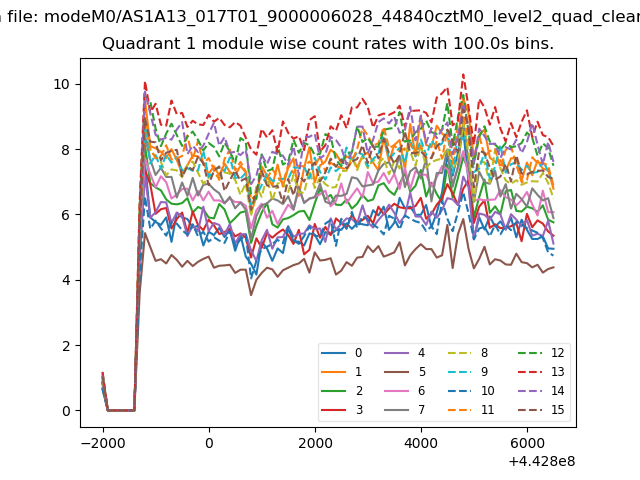
| Module-wise count rates for Quadrant A Data is divided into 100 sec bins |
 |
 |
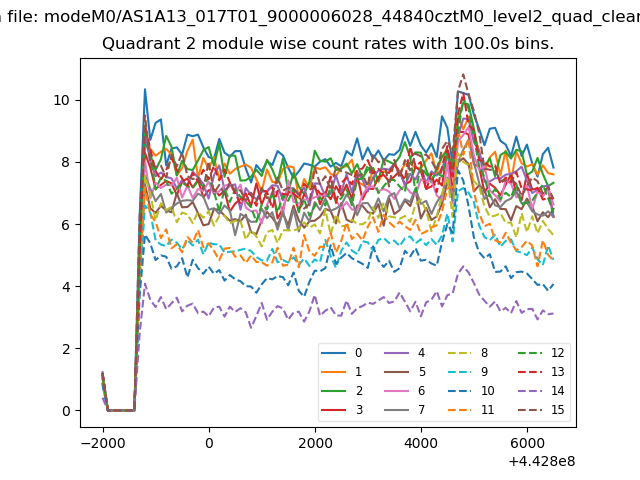
| Module-wise count rates for Quadrant B Data is divided into 100 sec bins |
 |
 |
| Module-wise count rates for Quadrant C Data is divided into 100 sec bins |
 |
 |
| Module-wise count rates for Quadrant D Data is divided into 100 sec bins |
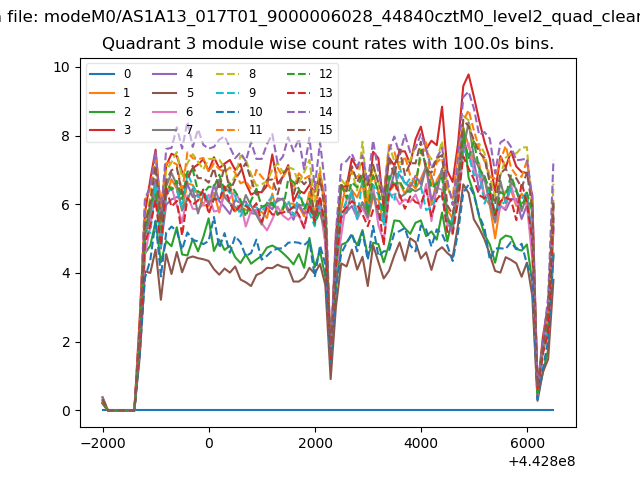 |
 |
| Parameter | Plot |
|---|---|
| CZT HV Monitor | 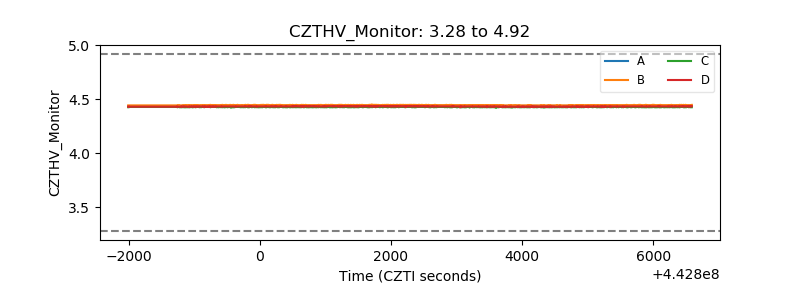 |
| D_VDD | 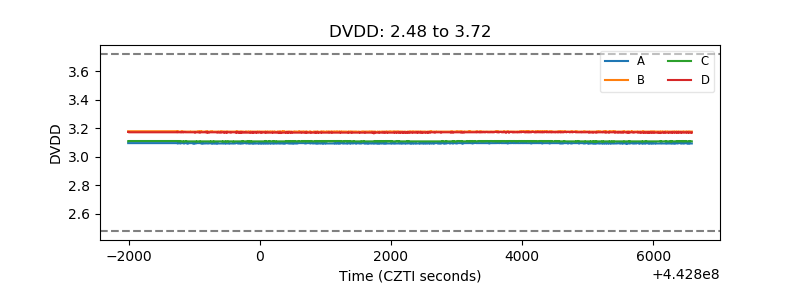 |
| Temperature 1 | 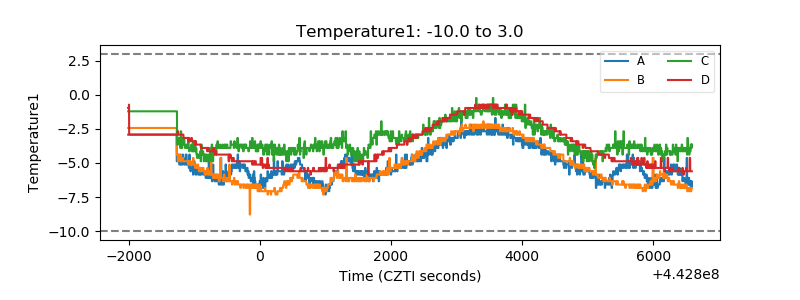 |
| Veto HV Monitor | 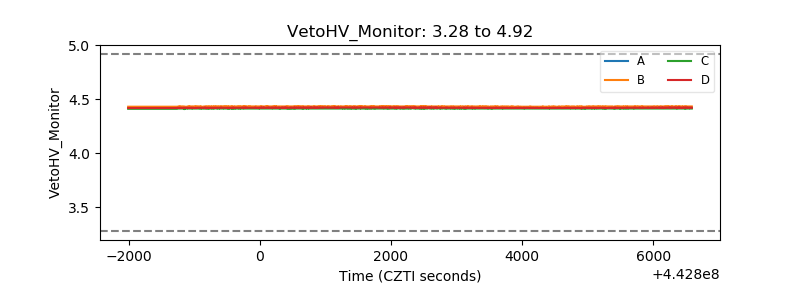 |
| Veto LLD | 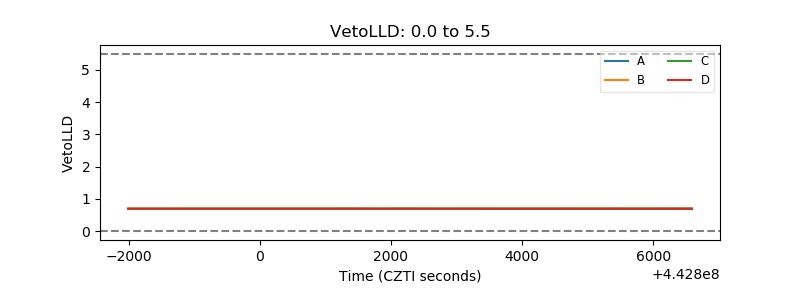 |
| Alpha Counter | 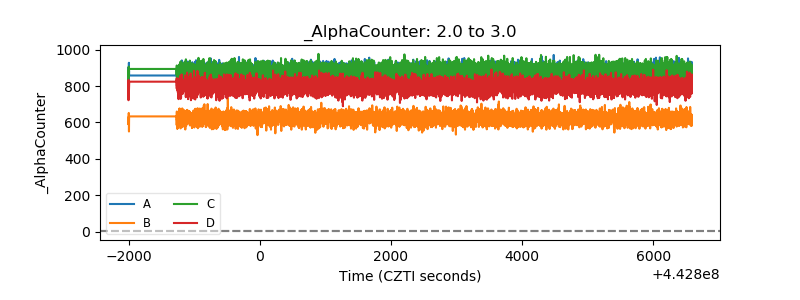 |
| _CPM_Rate | 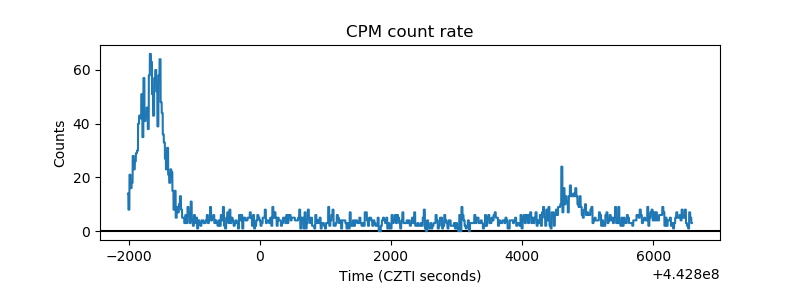 |
| CZT Counter | 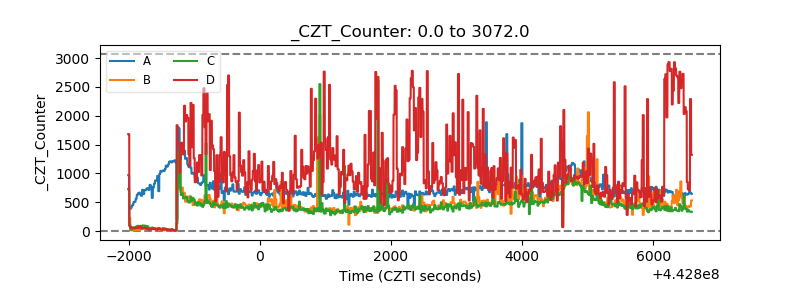 |
| +2.5 Volts monitor |  |
| +5 Volts monitor | 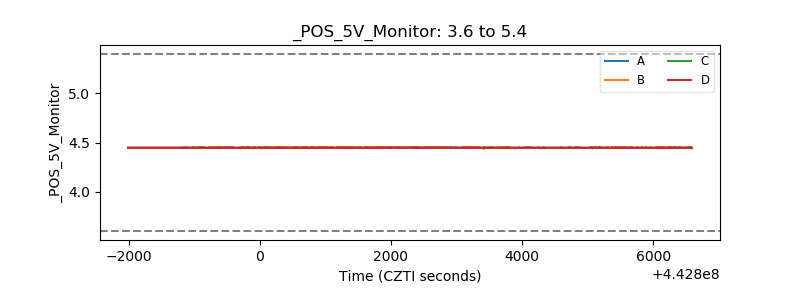 |
| _ROLL_ROT |  |
| _Roll_DEC | 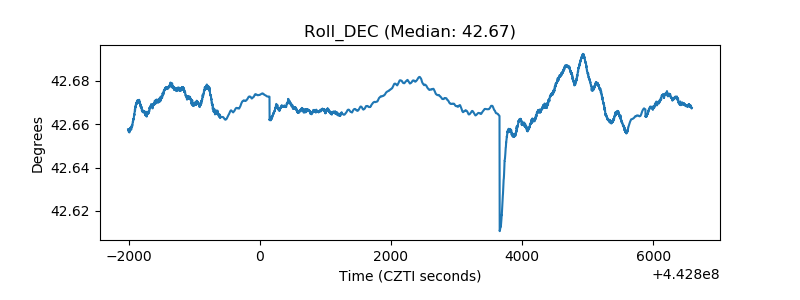 |
| _Roll_RA | 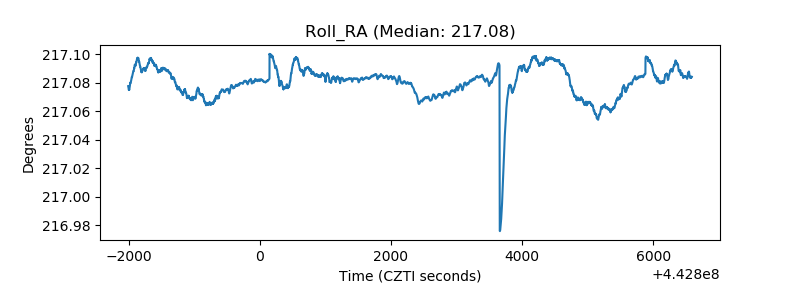 |
| Veto Counter | 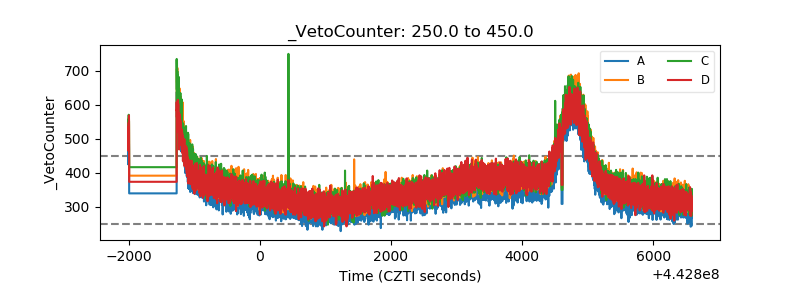 |