| Param | Original file | Final file |
|---|---|---|
| Filename | modeM0/AS1A13_017T01_9000006028_44845cztM0_level2.fits | modeM0/AS1A13_017T01_9000006028_44845cztM0_level2_quad_clean.evt |
| Size (bytes) | 1,301,541,120 | 287,807,040 |
| Size | 1.2 GB | 274.5 MB |
| Events in quadrant A | 13,465,039 | 1,917,653 |
| Events in quadrant B | 9,558,162 | 1,974,516 |
| Events in quadrant C | 8,357,376 | 1,900,615 |
| Events in quadrant D | 15,353,537 | 1,633,732 |
| Mode M0 | |||
|---|---|---|---|
| Quadrant | BADHDUFLAG | Total packets | Discarded packets |
| A | 0 | 56556 | 3 |
| B | 0 | 41350 | 3 |
| C | 0 | 38845 | 3 |
| D | 0 | 58777 | 3 |
| Mode SS | |||
|---|---|---|---|
| Quadrant | BADHDUFLAG | Total packets | Discarded packets |
| A | 0 | 378 | 0 |
| B | 0 | 378 | 0 |
| C | 0 | 378 | 0 |
| D | 0 | 378 | 0 |
| Mode M9 | |||
|---|---|---|---|
| Quadrant | BADHDUFLAG | Total packets | Discarded packets |
| A | 0 | 16 | 0 |
| B | 0 | 16 | 0 |
| C | 0 | 16 | 0 |
| D | 0 | 16 | 0 |
| Quadrant | Total seconds | Saturated seconds | Saturation percentage |
|---|---|---|---|
| A | 18687 | 393 | 2.103066% |
| B | 18687 | 488 | 2.611441% |
| C | 18688 | 182 | 0.973887% |
| D | 18687 | 1231 | 6.587467% |
Noise dominated data is calculated using 1-second bins in cleaned event files. If a bin has >2000 counts, and if more than 50% of those come from <1% of pixels, then it is considered to be noise-dominated and hence unusable.
| Quadrant | # 1 sec bins | Bins with >0 counts | Bins with >2000 counts | High rate bins dominated by noise | Noise dominated (total time) | Noise dominated (detector-on time) | Marked lightcurve |
|---|---|---|---|---|---|---|---|
| A | 20172 | 18690 | 1 | 1 | 0.00% | 0.01% | 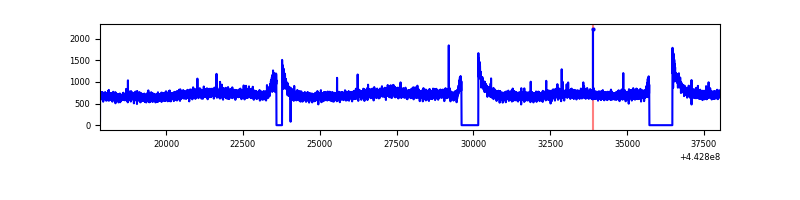 |
| B | 20172 | 18690 | 138 | 138 | 0.68% | 0.74% | 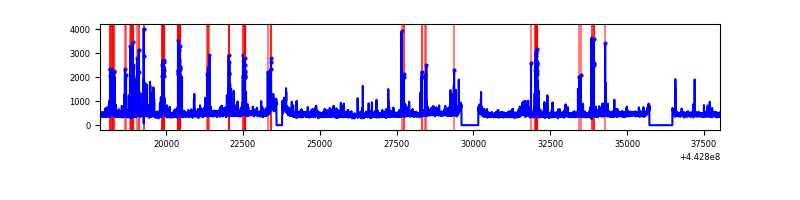 |
| C | 20173 | 18691 | 19 | 19 | 0.09% | 0.10% | 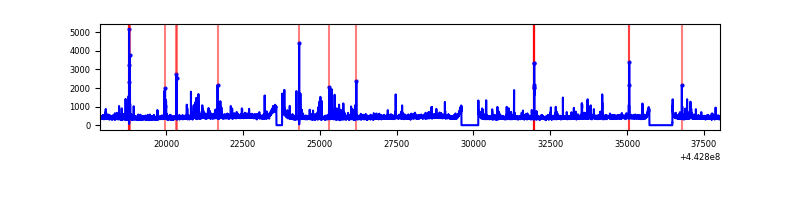 |
| D | 20172 | 18690 | 1008 | 1008 | 5.00% | 5.39% | 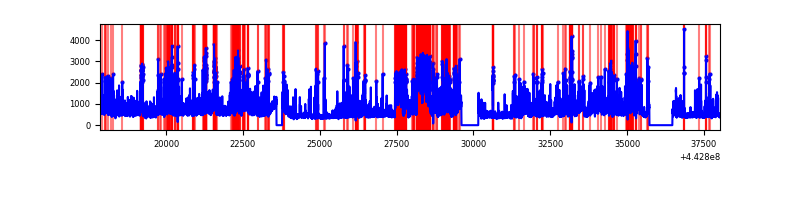 |
Top three noisy pixels from each quadrant. If the there are fewer than three noisy pixels in the level2.evt file, extra rows are filled as -1
| Pixel properties | Quadrant properties | ||||||
|---|---|---|---|---|---|---|---|
| Quadrant | DetID | PixID | Counts | Sigma | Mean | Median | Sigma |
| A | 10 | 83 | 5481643 | 12916.0 | 2056 | 2011 | 424.3 |
| A | 3 | 137 | 24263 | 52.45 | 2056 | 2011 | 424.3 |
| A | 13 | 254 | 22781 | 48.96 | 2056 | 2011 | 424.3 |
| B | 5 | 255 | 648566 | 1605.45 | 2039 | 1975 | 402.7 |
| B | 0 | 155 | 304135 | 750.24 | 2039 | 1975 | 402.7 |
| B | 0 | 183 | 143102 | 350.41 | 2039 | 1975 | 402.7 |
| C | 12 | 2 | 233546 | 492.32 | 2013 | 2021 | 470.3 |
| C | 14 | 254 | 140328 | 294.1 | 2013 | 2021 | 470.3 |
| C | 3 | 233 | 70642 | 145.92 | 2013 | 2021 | 470.3 |
| D | 13 | 174 | 3168217 | 6494.78 | 1962 | 1898 | 487.5 |
| D | 11 | 241 | 853948 | 1747.73 | 1962 | 1898 | 487.5 |
| D | 2 | 249 | 766694 | 1568.76 | 1962 | 1898 | 487.5 |
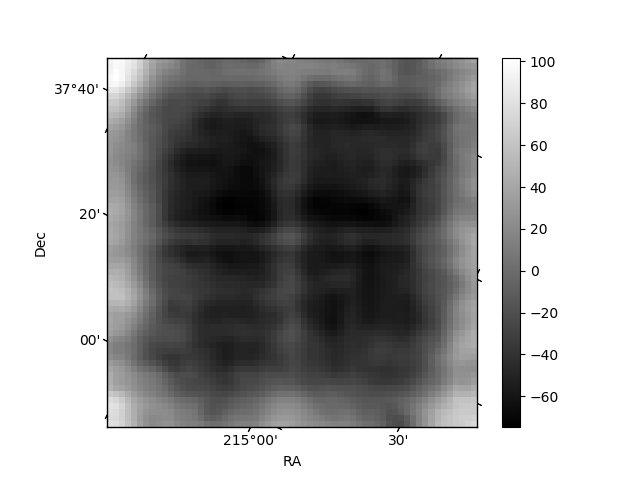
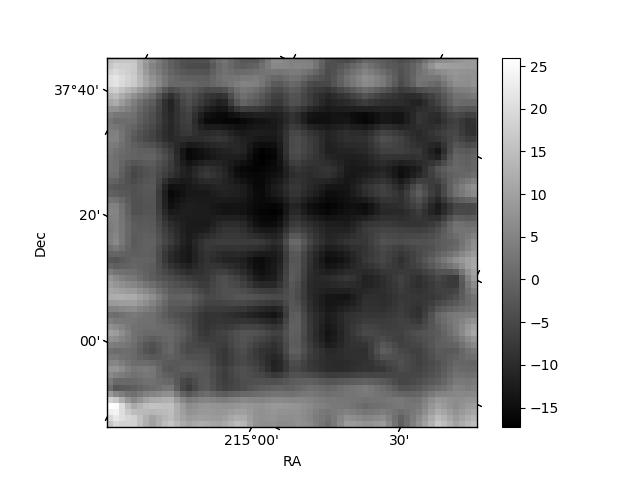
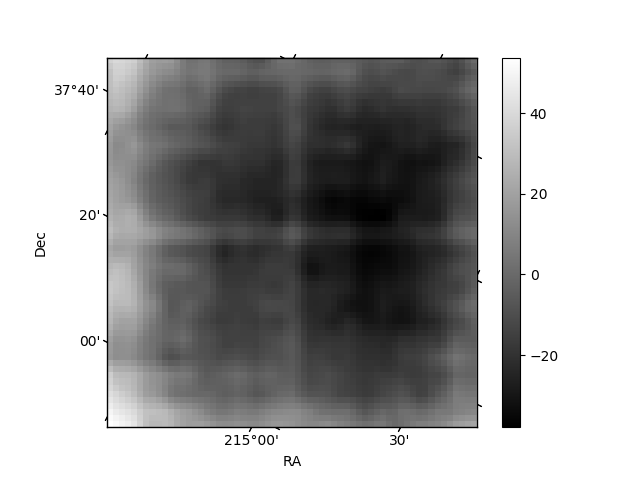
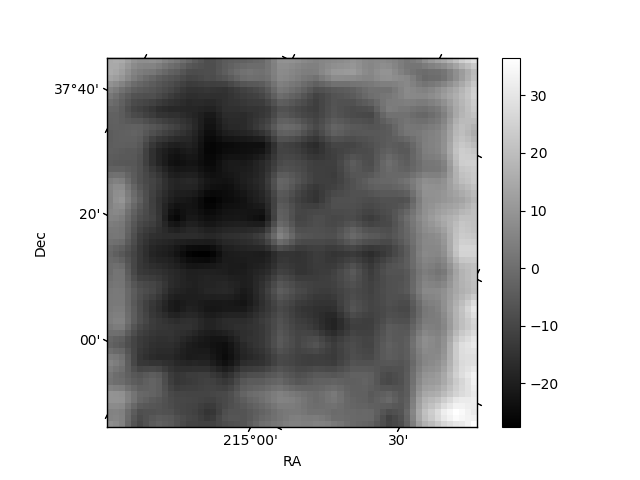
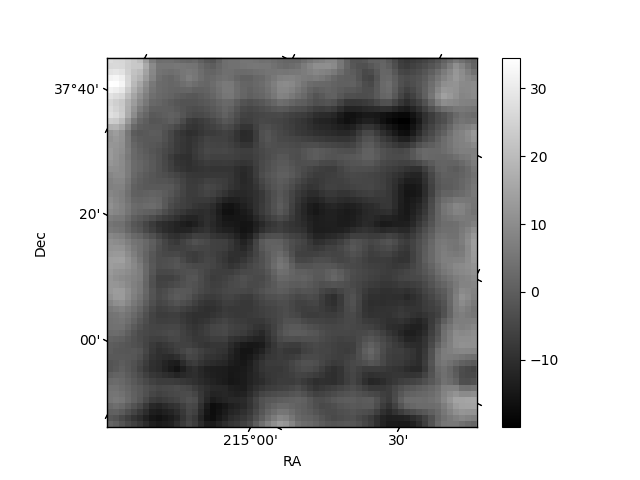
Histogram calculated using DETX and DETY for each event in the final _common_clean file
| Quadrant A | 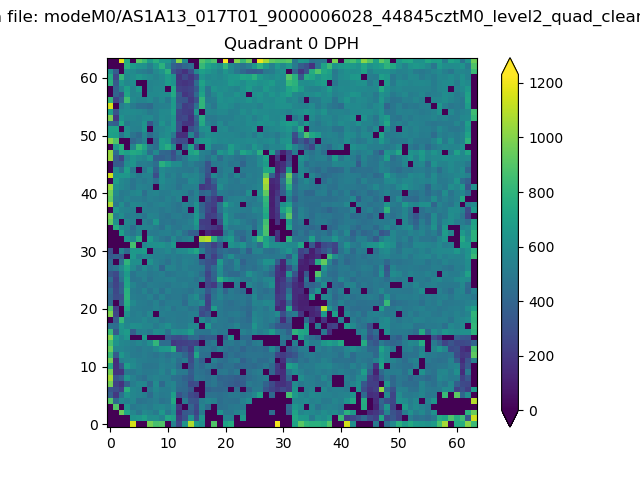 |
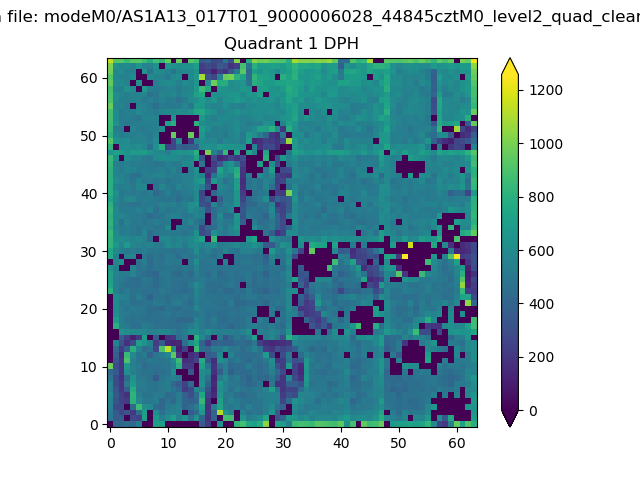 |
Quadrant B |
|---|---|---|---|
| Quadrant D | 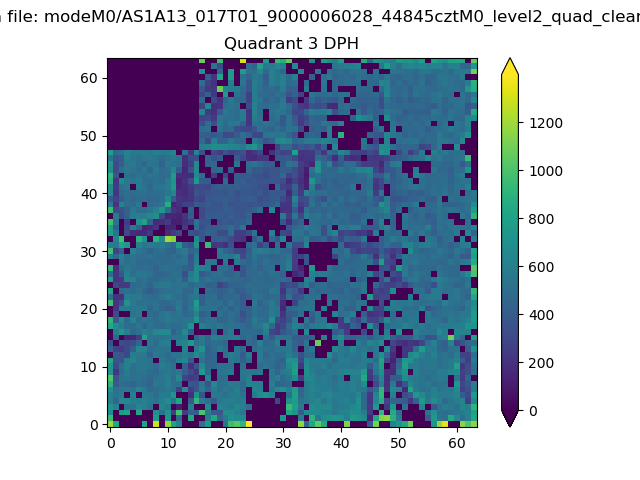 |
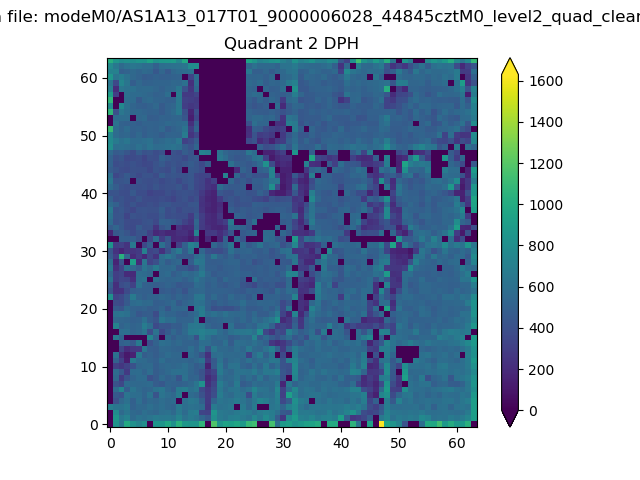 |
Quadrant C |
| Plot type | Count rate plots | Images |
|---|---|---|
| Comparison with Poisson distribution Blue bars denote a histogram of data divided into 1 sec bins. Red curve is a Poisson curve with rate = median count rate of data. |
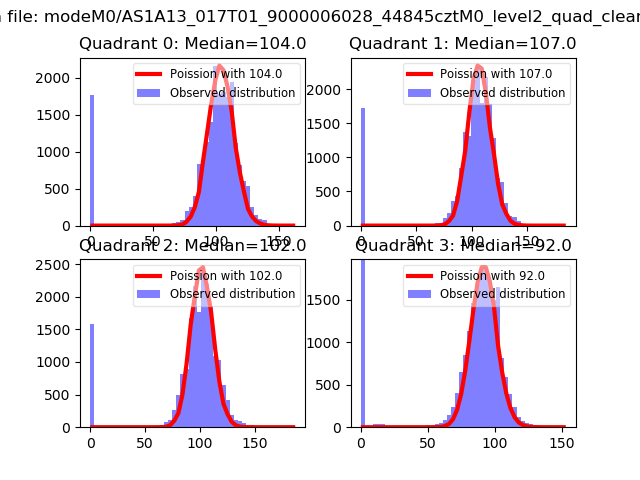 |
 |
| Quadrant-wise count rates Data is divided into 100 sec bins |
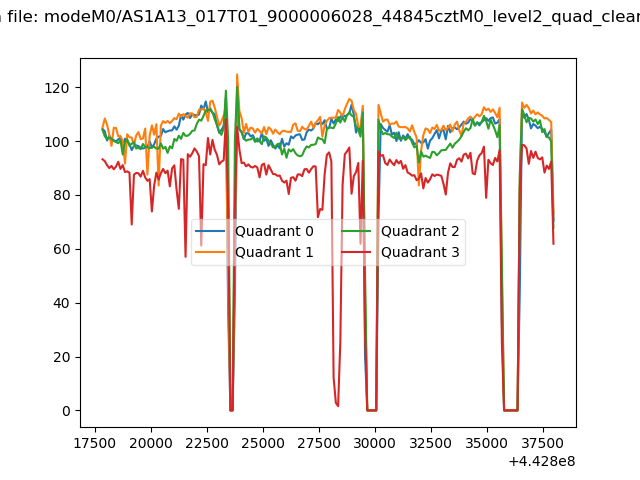 |
|
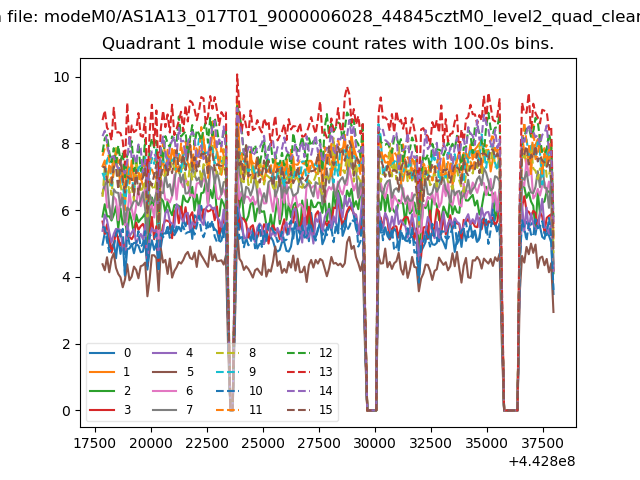
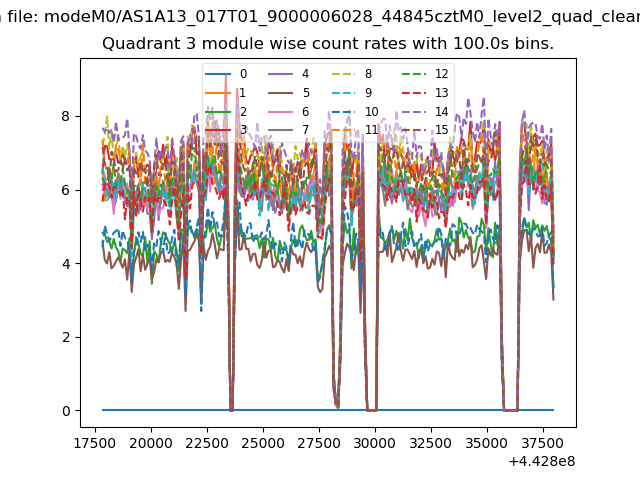
| Module-wise count rates for Quadrant A Data is divided into 100 sec bins |
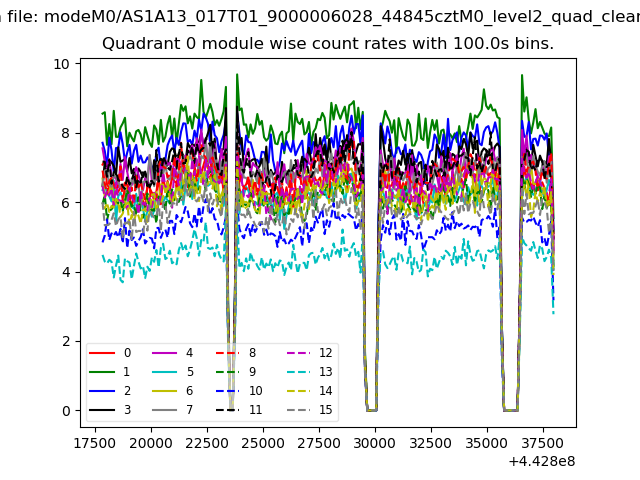 |
 |
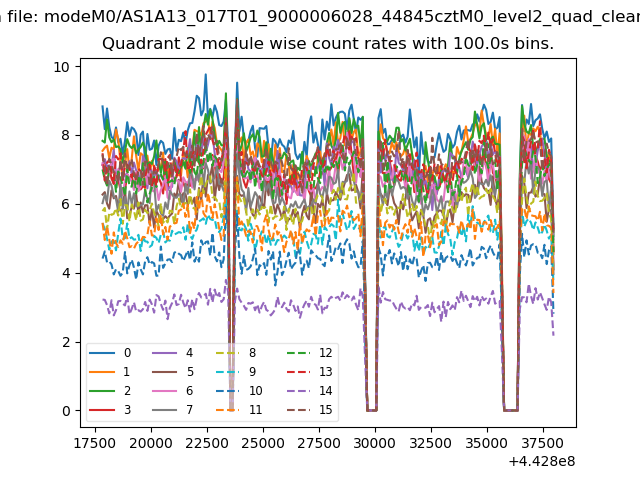
| Module-wise count rates for Quadrant B Data is divided into 100 sec bins |
 |
 |
| Module-wise count rates for Quadrant C Data is divided into 100 sec bins |
 |
 |
| Module-wise count rates for Quadrant D Data is divided into 100 sec bins |
 |
 |
| Parameter | Plot |
|---|---|
| CZT HV Monitor | 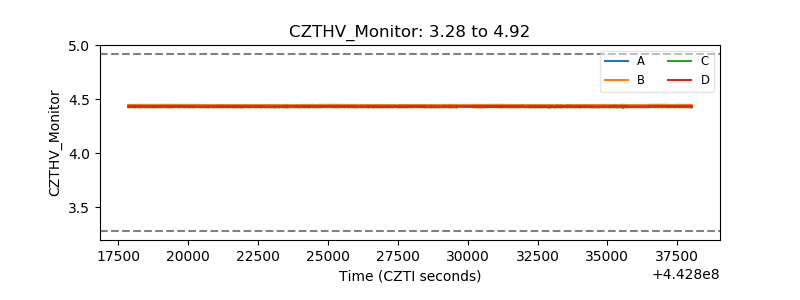 |
| D_VDD | 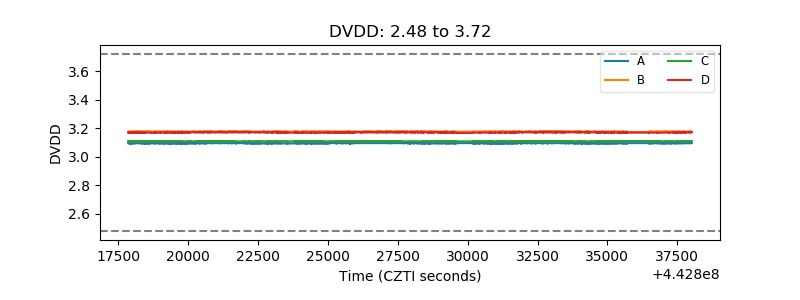 |
| Temperature 1 | 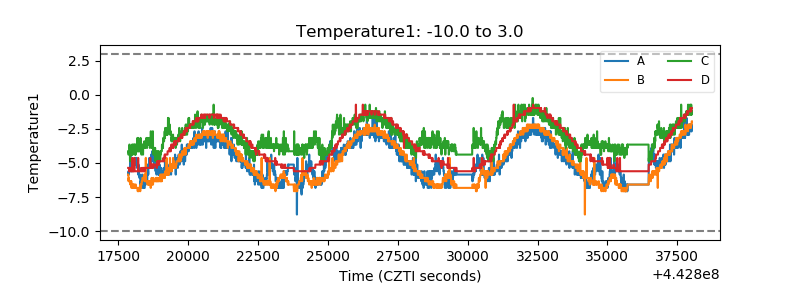 |
| Veto HV Monitor | 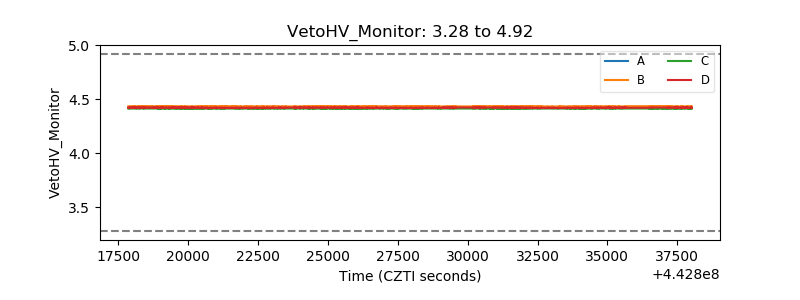 |
| Veto LLD | 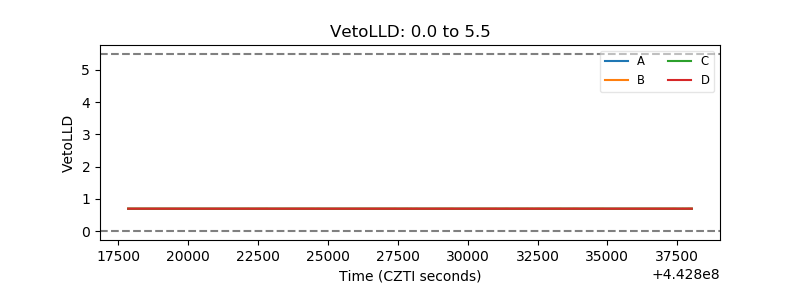 |
| Alpha Counter | 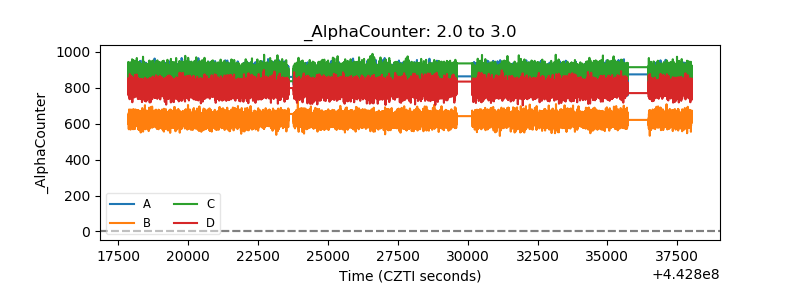 |
| _CPM_Rate | 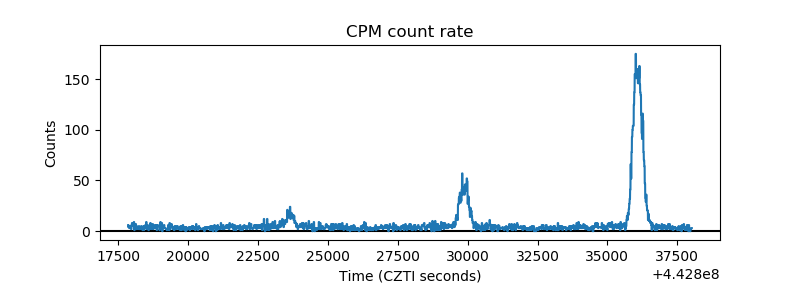 |
| CZT Counter | 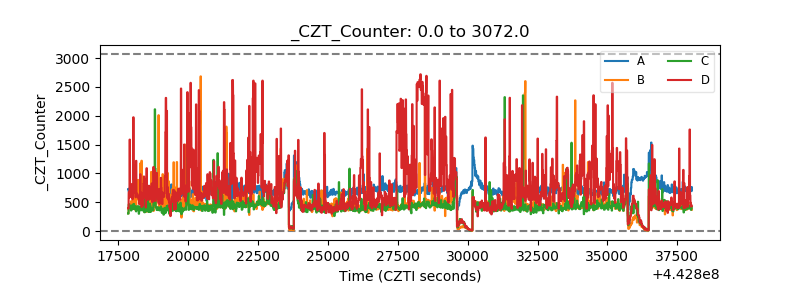 |
| +2.5 Volts monitor | 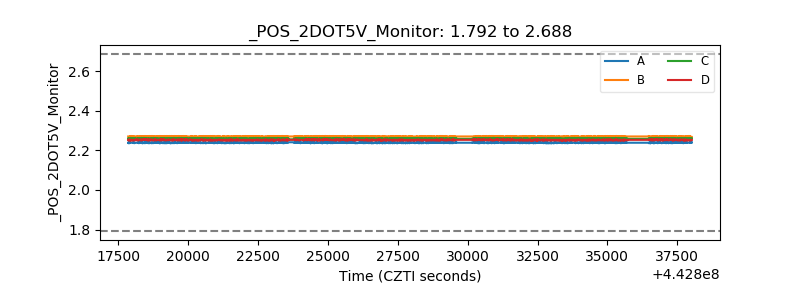 |
| +5 Volts monitor | 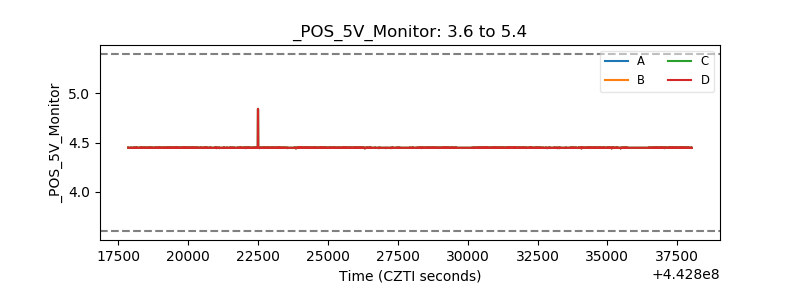 |
| _ROLL_ROT | 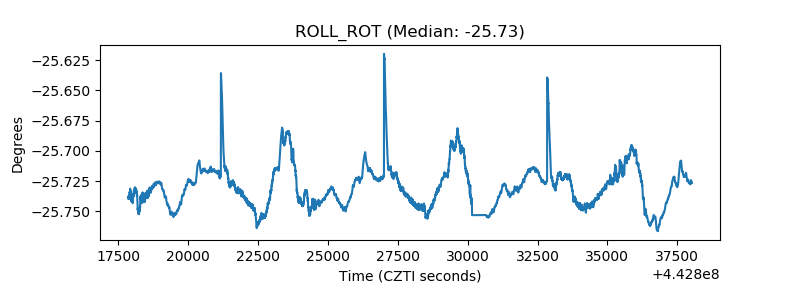 |
| _Roll_DEC | 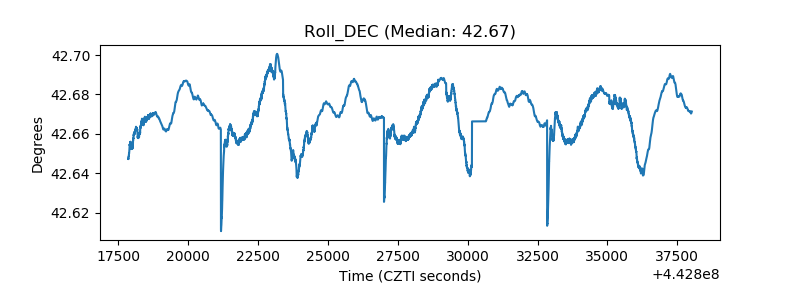 |
| _Roll_RA | 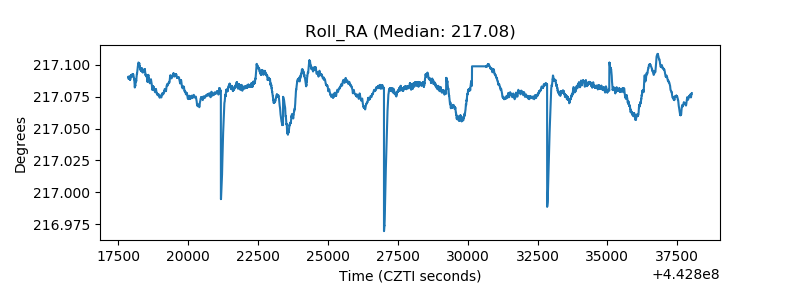 |
| Veto Counter | 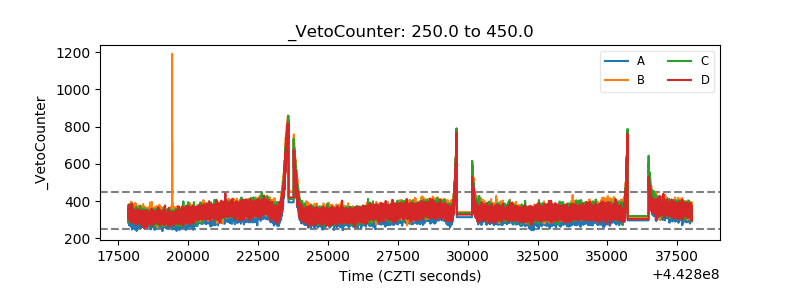 |