| Param | Original file | Final file |
|---|---|---|
| Filename | modeM0/AS1A13_017T01_9000006028_44848cztM0_level2.fits | modeM0/AS1A13_017T01_9000006028_44848cztM0_level2_quad_clean.evt |
| Size (bytes) | 457,295,040 | 111,720,960 |
| Size | 436.1 MB | 106.5 MB |
| Events in quadrant A | 5,443,048 | 744,769 |
| Events in quadrant B | 3,321,131 | 777,129 |
| Events in quadrant C | 3,158,069 | 731,992 |
| Events in quadrant D | 4,484,409 | 660,970 |
| Mode M0 | |||
|---|---|---|---|
| Quadrant | BADHDUFLAG | Total packets | Discarded packets |
| A | 0 | 21638 | 1 |
| B | 0 | 14342 | 1 |
| C | 0 | 14092 | 1 |
| D | 0 | 17916 | 1 |
| Mode SS | |||
|---|---|---|---|
| Quadrant | BADHDUFLAG | Total packets | Discarded packets |
| A | 0 | 138 | 0 |
| B | 0 | 138 | 0 |
| C | 0 | 138 | 0 |
| D | 0 | 138 | 0 |
| Mode M9 | |||
|---|---|---|---|
| Quadrant | BADHDUFLAG | Total packets | Discarded packets |
| A | 0 | 10 | 0 |
| B | 0 | 10 | 0 |
| C | 0 | 10 | 0 |
| D | 0 | 10 | 0 |
| Quadrant | Total seconds | Saturated seconds | Saturation percentage |
|---|---|---|---|
| A | 6708 | 243 | 3.622540% |
| B | 6707 | 100 | 1.490980% |
| C | 6708 | 77 | 1.147883% |
| D | 6708 | 249 | 3.711986% |
Noise dominated data is calculated using 1-second bins in cleaned event files. If a bin has >2000 counts, and if more than 50% of those come from <1% of pixels, then it is considered to be noise-dominated and hence unusable.
| Quadrant | # 1 sec bins | Bins with >0 counts | Bins with >2000 counts | High rate bins dominated by noise | Noise dominated (total time) | Noise dominated (detector-on time) | Marked lightcurve |
|---|---|---|---|---|---|---|---|
| A | 7758 | 6709 | 75 | 75 | 0.97% | 1.12% | 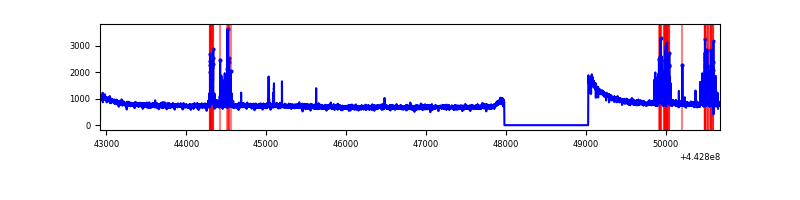 |
| B | 7757 | 6708 | 19 | 19 | 0.24% | 0.28% | 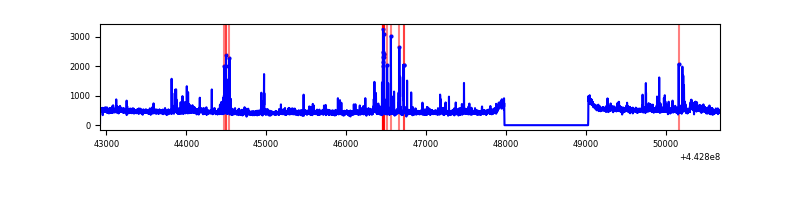 |
| C | 7758 | 6709 | 22 | 22 | 0.28% | 0.33% | 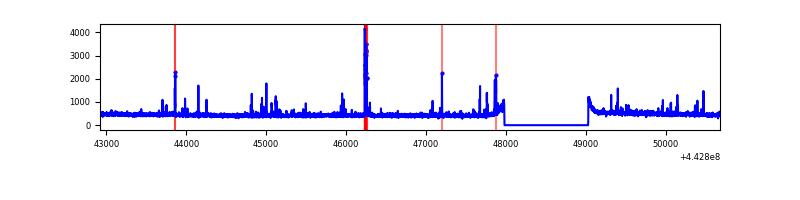 |
| D | 7758 | 6709 | 186 | 186 | 2.40% | 2.77% | 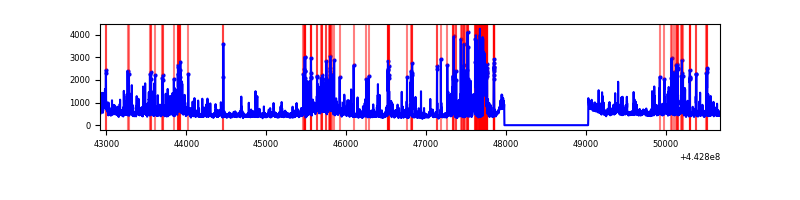 |
Top three noisy pixels from each quadrant. If the there are fewer than three noisy pixels in the level2.evt file, extra rows are filled as -1
| Pixel properties | Quadrant properties | ||||||
|---|---|---|---|---|---|---|---|
| Quadrant | DetID | PixID | Counts | Sigma | Mean | Median | Sigma |
| A | 10 | 83 | 2151573 | 13554.74 | 768 | 752 | 158.7 |
| A | 13 | 248 | 325208 | 2044.76 | 768 | 752 | 158.7 |
| A | 3 | 137 | 8749 | 50.4 | 768 | 752 | 158.7 |
| B | 0 | 186 | 70686 | 461.09 | 769 | 745 | 151.7 |
| B | 5 | 255 | 57851 | 376.47 | 769 | 745 | 151.7 |
| B | 0 | 219 | 44821 | 290.57 | 769 | 745 | 151.7 |
| C | 14 | 254 | 78069 | 435.62 | 756 | 760 | 177.5 |
| C | 12 | 2 | 63086 | 351.2 | 756 | 760 | 177.5 |
| C | 1 | 3 | 23070 | 125.71 | 756 | 760 | 177.5 |
| D | 5 | 235 | 505595 | 2656.93 | 753 | 730 | 190.0 |
| D | 13 | 174 | 272618 | 1430.85 | 753 | 730 | 190.0 |
| D | 7 | 38 | 194559 | 1020.05 | 753 | 730 | 190.0 |
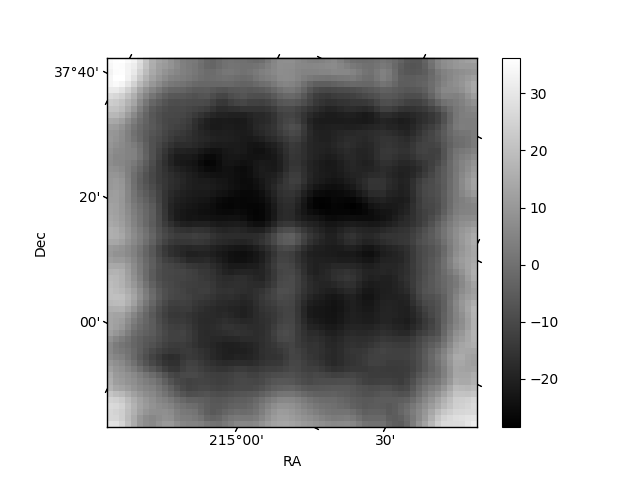
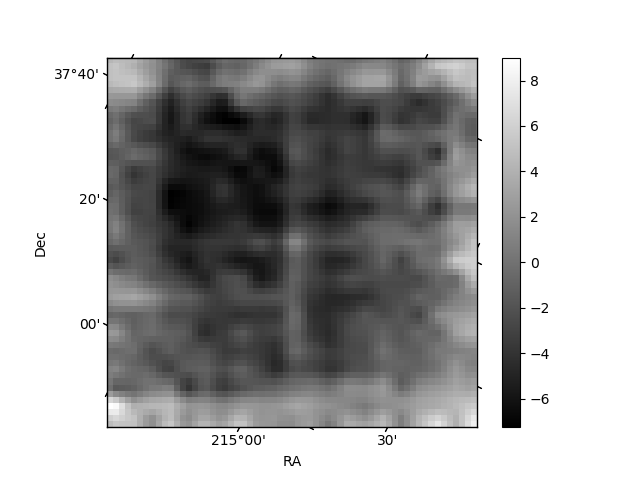
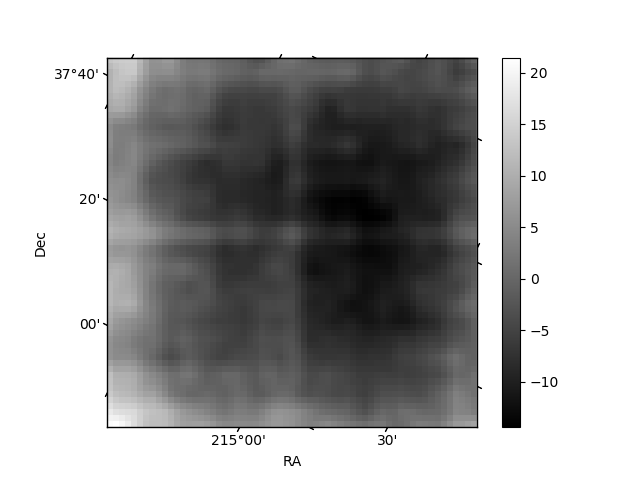
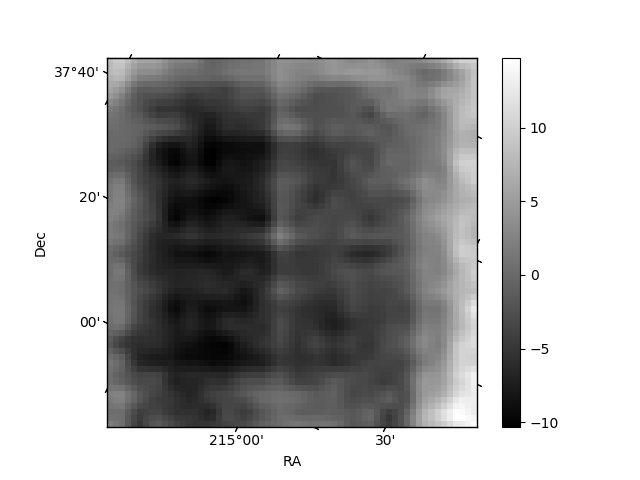
Histogram calculated using DETX and DETY for each event in the final _common_clean file
| Quadrant A | 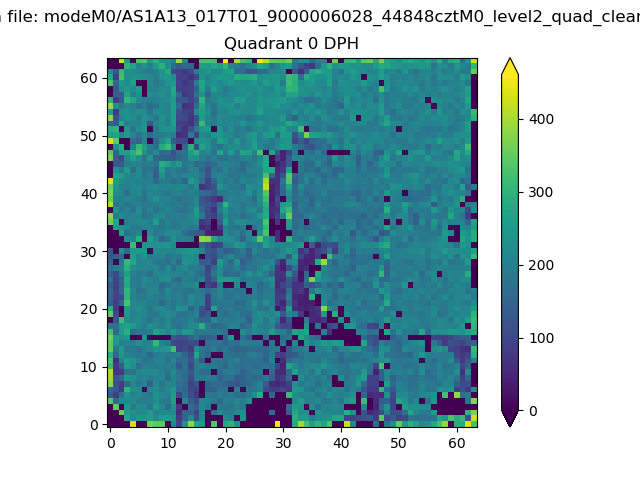 |
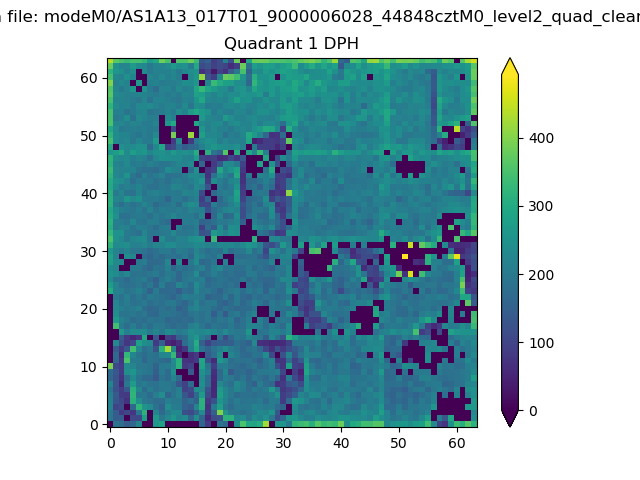 |
Quadrant B |
|---|---|---|---|
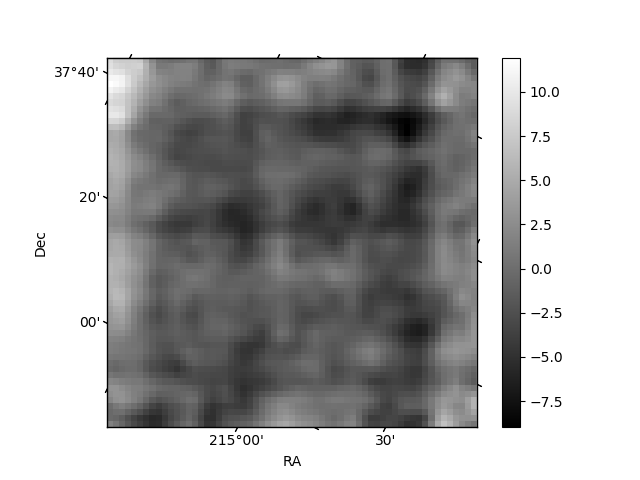
| Quadrant D | 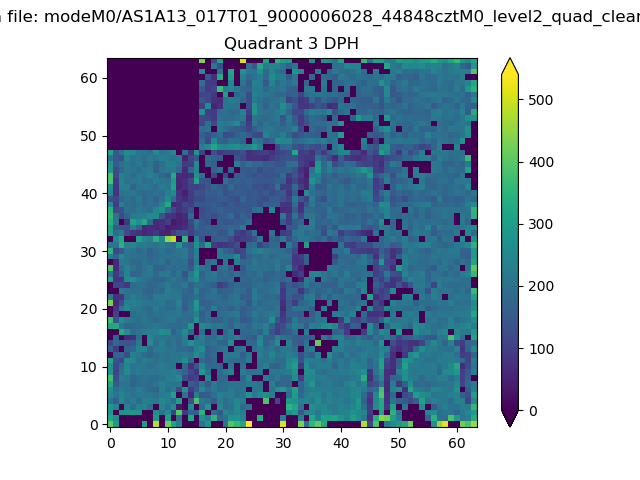 |
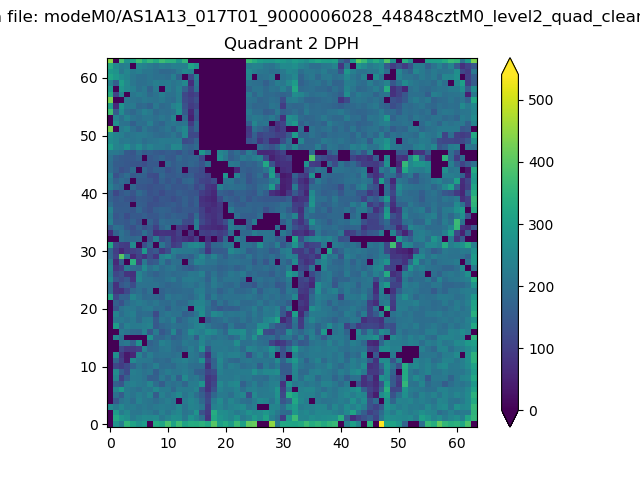 |
Quadrant C |
| Plot type | Count rate plots | Images |
|---|---|---|
| Comparison with Poisson distribution Blue bars denote a histogram of data divided into 1 sec bins. Red curve is a Poisson curve with rate = median count rate of data. |
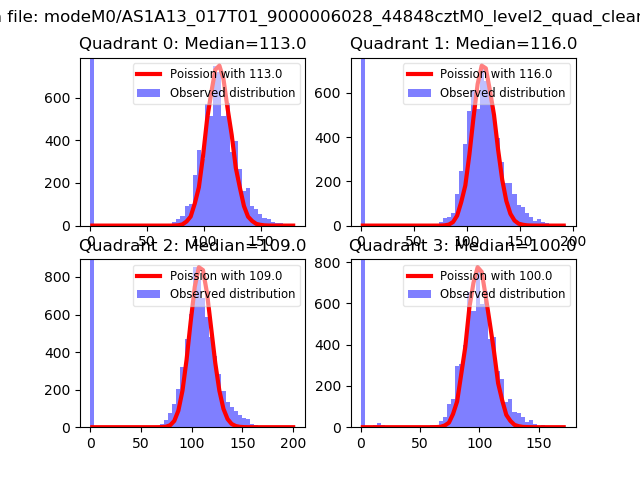 |
 |
| Quadrant-wise count rates Data is divided into 100 sec bins |
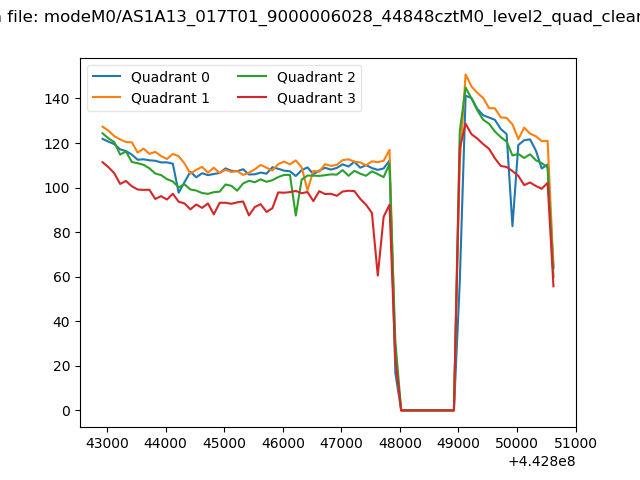 |
|
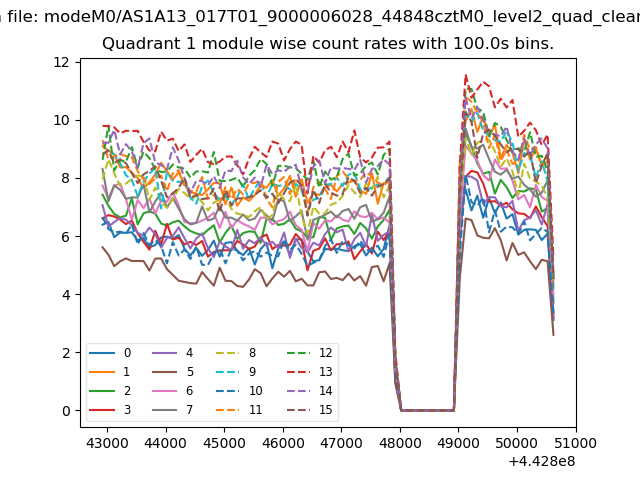
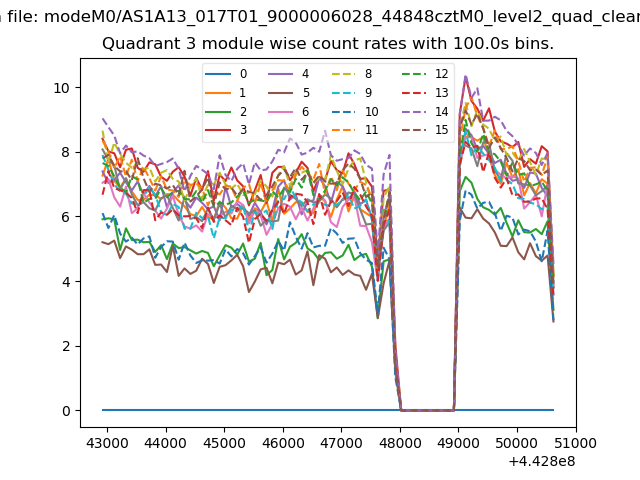
| Module-wise count rates for Quadrant A Data is divided into 100 sec bins |
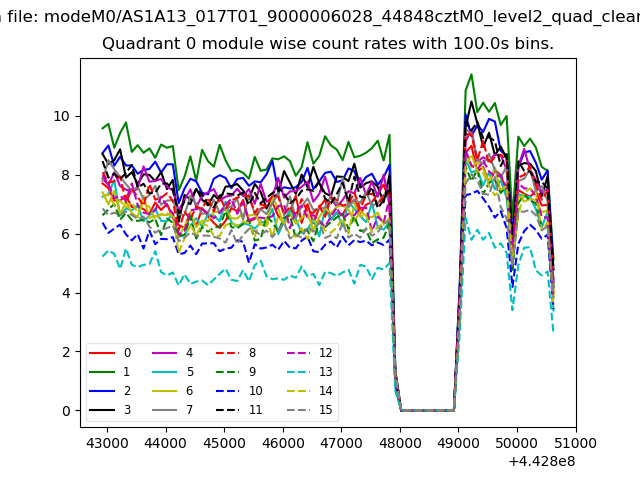 |
 |
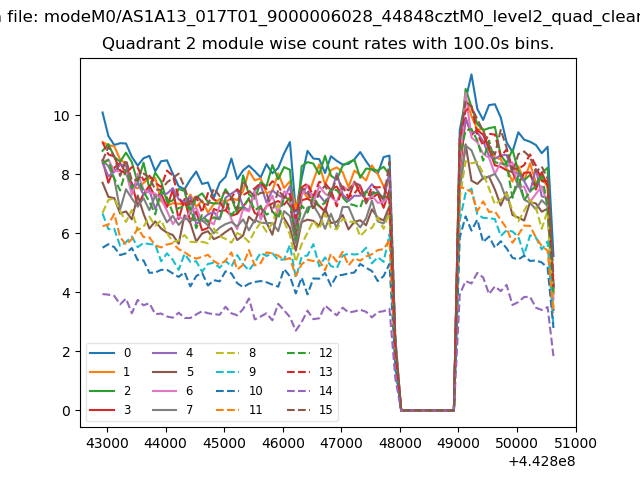
| Module-wise count rates for Quadrant B Data is divided into 100 sec bins |
 |
 |
| Module-wise count rates for Quadrant C Data is divided into 100 sec bins |
 |
 |
| Module-wise count rates for Quadrant D Data is divided into 100 sec bins |
 |
 |
| Parameter | Plot |
|---|---|
| CZT HV Monitor | 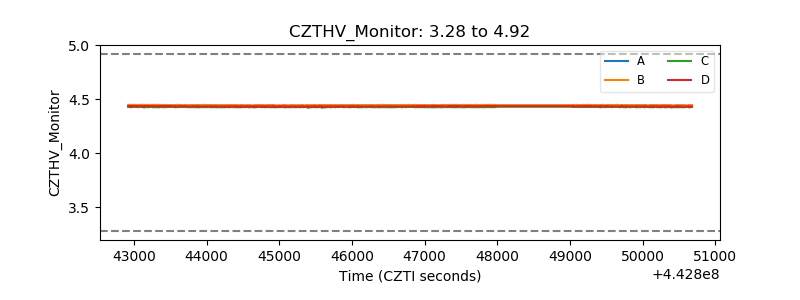 |
| D_VDD | 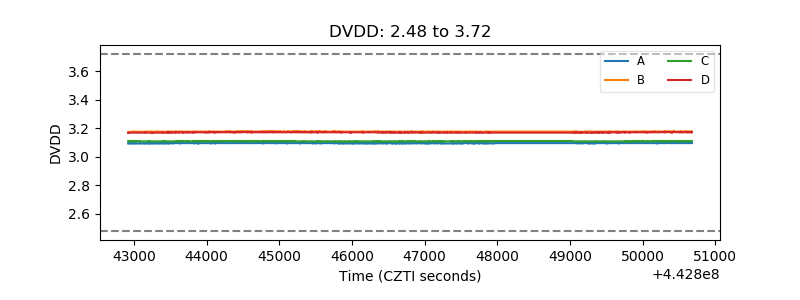 |
| Temperature 1 | 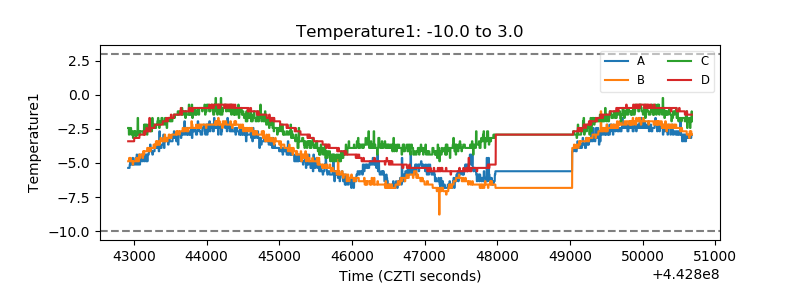 |
| Veto HV Monitor | 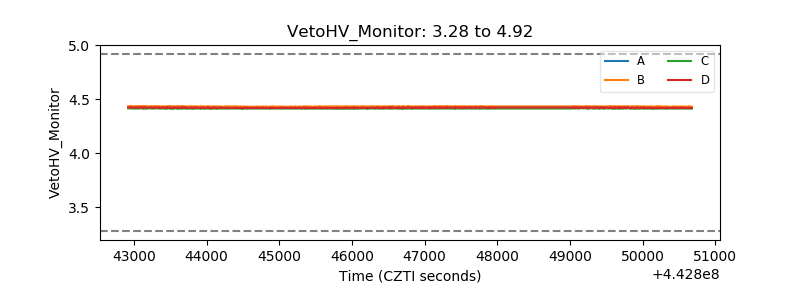 |
| Veto LLD | 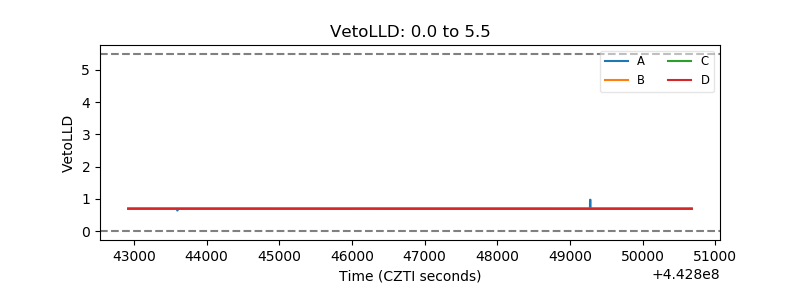 |
| Alpha Counter | 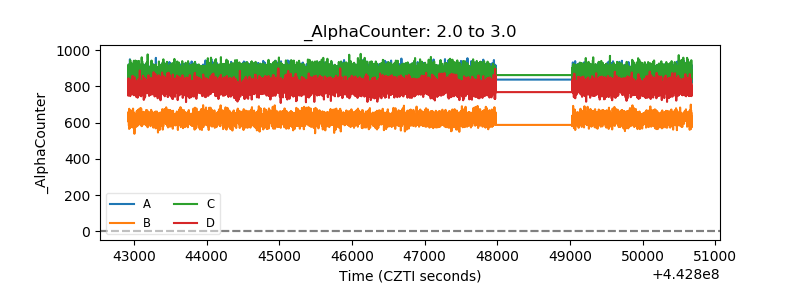 |
| _CPM_Rate | 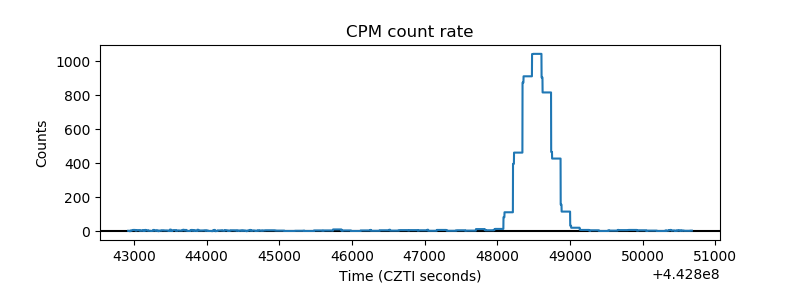 |
| CZT Counter | 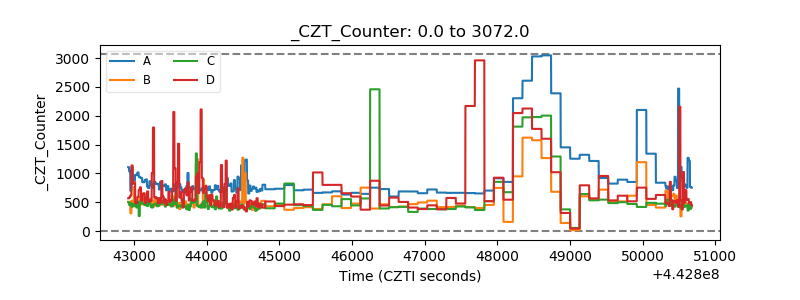 |
| +2.5 Volts monitor | 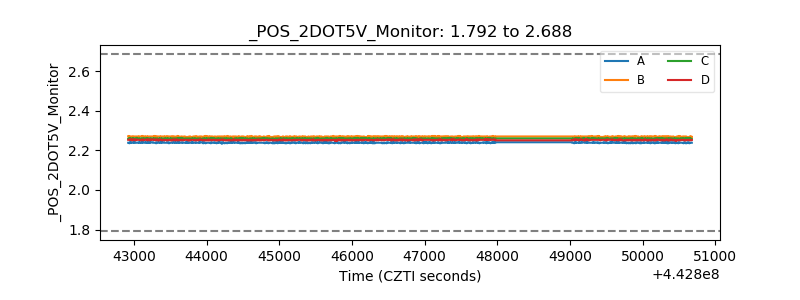 |
| +5 Volts monitor | 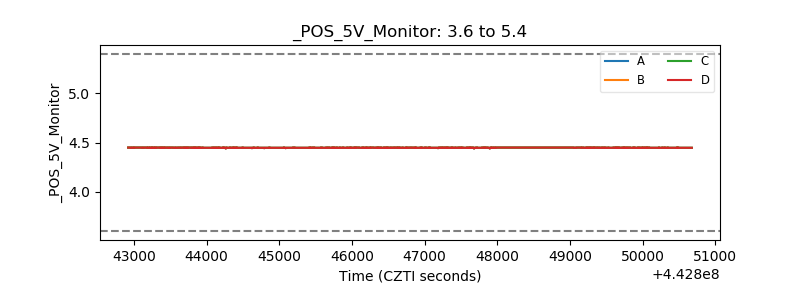 |
| _ROLL_ROT | 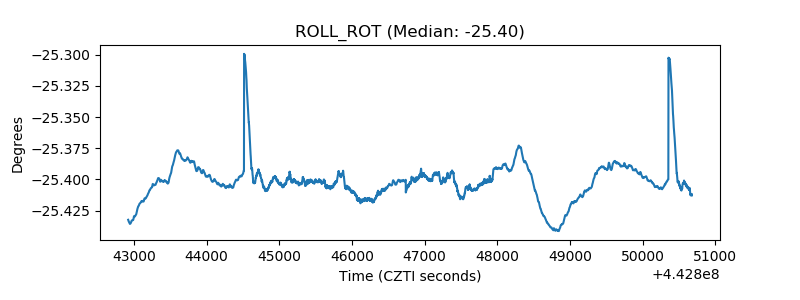 |
| _Roll_DEC | 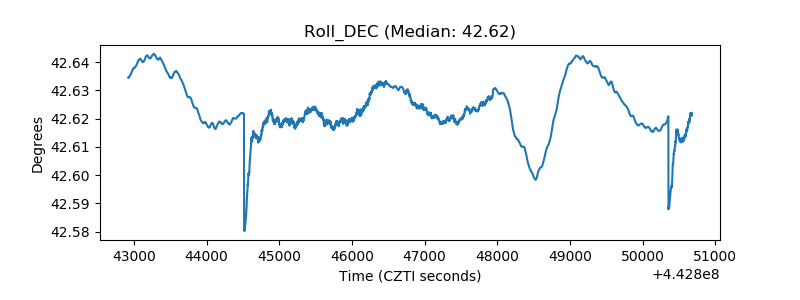 |
| _Roll_RA | 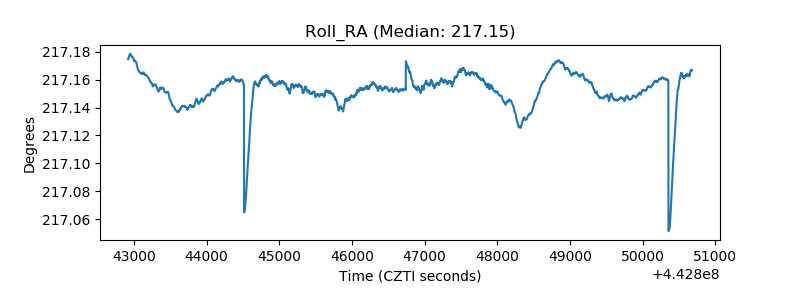 |
| Veto Counter | 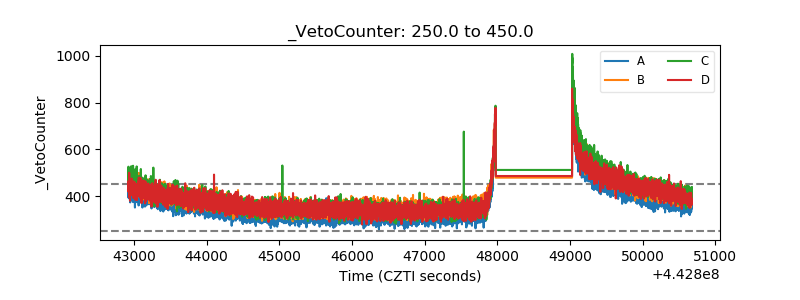 |