| Param | Original file | Final file |
|---|---|---|
| Filename | modeM0/AS1A13_017T01_9000006028_44849cztM0_level2.fits | modeM0/AS1A13_017T01_9000006028_44849cztM0_level2_quad_clean.evt |
| Size (bytes) | 443,041,920 | 109,200,960 |
| Size | 422.5 MB | 104.1 MB |
| Events in quadrant A | 5,258,601 | 732,344 |
| Events in quadrant B | 3,347,036 | 760,427 |
| Events in quadrant C | 3,202,900 | 718,362 |
| Events in quadrant D | 4,106,470 | 660,056 |
| Mode M0 | |||
|---|---|---|---|
| Quadrant | BADHDUFLAG | Total packets | Discarded packets |
| A | 0 | 20554 | 1 |
| B | 0 | 14097 | 9 |
| C | 0 | 13763 | 1 |
| D | 0 | 16445 | 1 |
| Mode SS | |||
|---|---|---|---|
| Quadrant | BADHDUFLAG | Total packets | Discarded packets |
| A | 0 | 126 | 0 |
| B | 0 | 126 | 0 |
| C | 0 | 126 | 0 |
| D | 0 | 126 | 0 |
| Mode M9 | |||
|---|---|---|---|
| Quadrant | BADHDUFLAG | Total packets | Discarded packets |
| A | 0 | 12 | 0 |
| B | 0 | 12 | 0 |
| C | 0 | 12 | 0 |
| D | 0 | 12 | 0 |
| Quadrant | Total seconds | Saturated seconds | Saturation percentage |
|---|---|---|---|
| A | 6242 | 264 | 4.229414% |
| B | 6238 | 148 | 2.372555% |
| C | 6243 | 157 | 2.514817% |
| D | 6242 | 171 | 2.739507% |
Noise dominated data is calculated using 1-second bins in cleaned event files. If a bin has >2000 counts, and if more than 50% of those come from <1% of pixels, then it is considered to be noise-dominated and hence unusable.
| Quadrant | # 1 sec bins | Bins with >0 counts | Bins with >2000 counts | High rate bins dominated by noise | Noise dominated (total time) | Noise dominated (detector-on time) | Marked lightcurve |
|---|---|---|---|---|---|---|---|
| A | 7432 | 6243 | 91 | 91 | 1.22% | 1.46% | 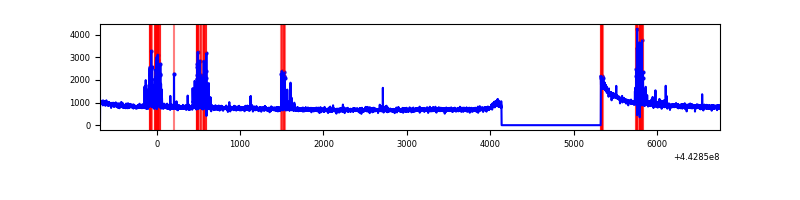 |
| B | 7432 | 6240 | 46 | 46 | 0.62% | 0.74% | 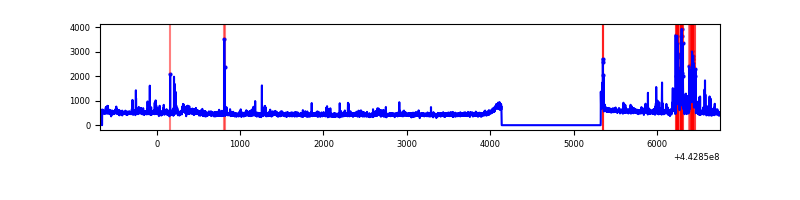 |
| C | 7433 | 6244 | 74 | 74 | 1.00% | 1.19% | 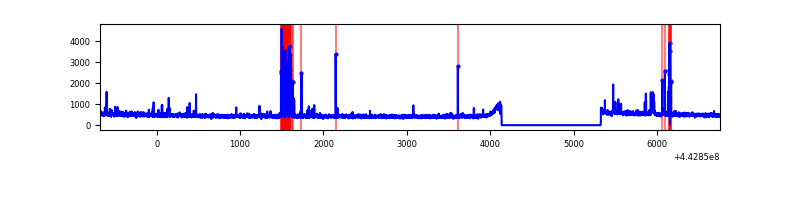 |
| D | 7432 | 6243 | 108 | 108 | 1.45% | 1.73% | 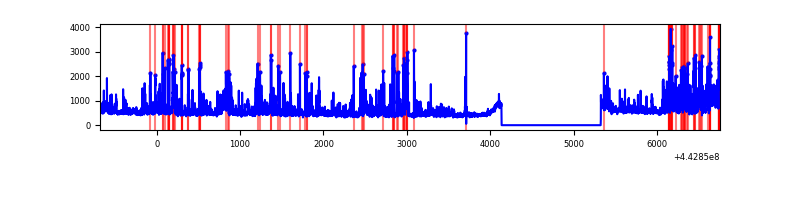 |
Top three noisy pixels from each quadrant. If the there are fewer than three noisy pixels in the level2.evt file, extra rows are filled as -1
| Pixel properties | Quadrant properties | ||||||
|---|---|---|---|---|---|---|---|
| Quadrant | DetID | PixID | Counts | Sigma | Mean | Median | Sigma |
| A | 10 | 83 | 2050769 | 13469.27 | 739 | 724 | 152.2 |
| A | 13 | 248 | 347667 | 2279.5 | 739 | 724 | 152.2 |
| A | 3 | 137 | 8072 | 48.28 | 739 | 724 | 152.2 |
| B | 0 | 186 | 273147 | 1900.59 | 736 | 714 | 143.3 |
| B | 0 | 183 | 33702 | 230.14 | 736 | 714 | 143.3 |
| B | 0 | 155 | 31896 | 217.54 | 736 | 714 | 143.3 |
| C | 12 | 2 | 304698 | 1792.52 | 727 | 732 | 169.6 |
| C | 1 | 3 | 30754 | 177.04 | 727 | 732 | 169.6 |
| C | 11 | 16 | 15880 | 89.33 | 727 | 732 | 169.6 |
| D | 5 | 235 | 402547 | 2199.84 | 727 | 706 | 182.7 |
| D | 13 | 249 | 323625 | 1767.79 | 727 | 706 | 182.7 |
| D | 2 | 249 | 171262 | 933.69 | 727 | 706 | 182.7 |
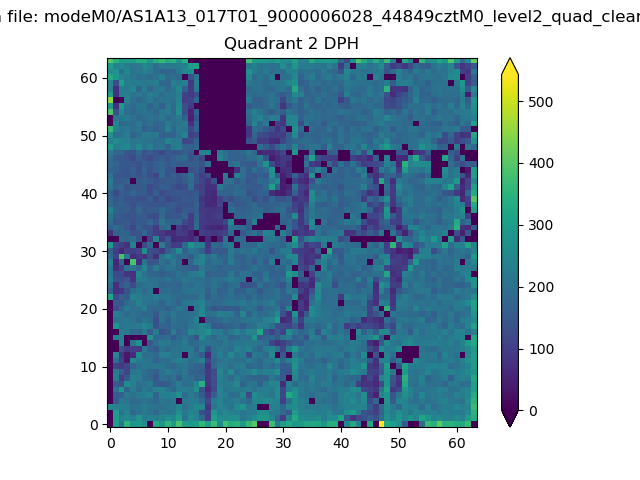
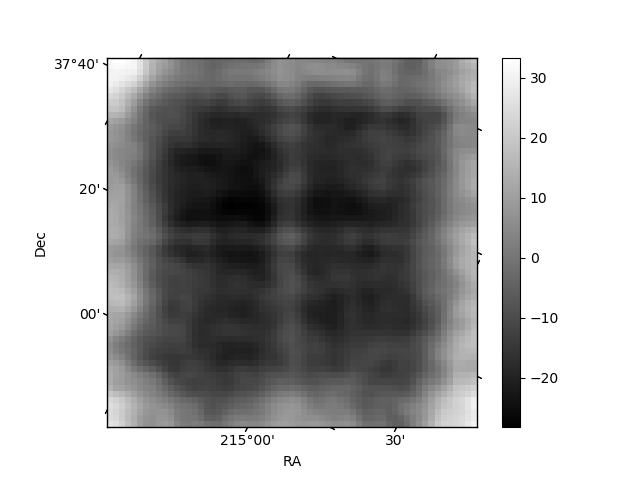
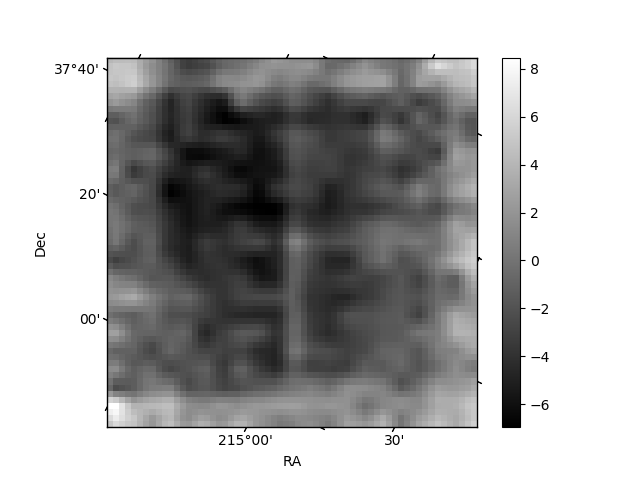
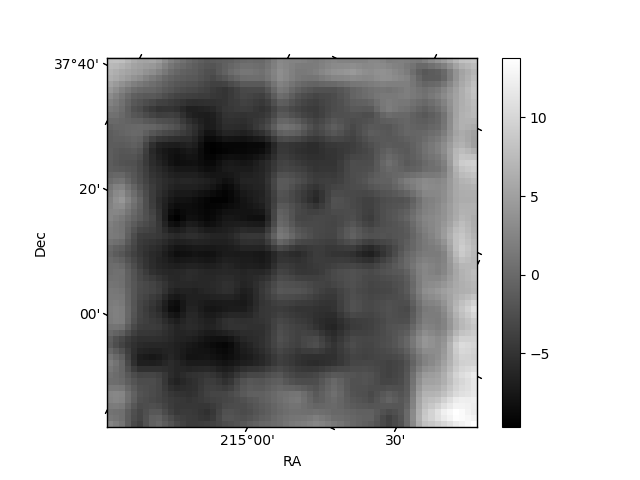
Histogram calculated using DETX and DETY for each event in the final _common_clean file
| Quadrant A | 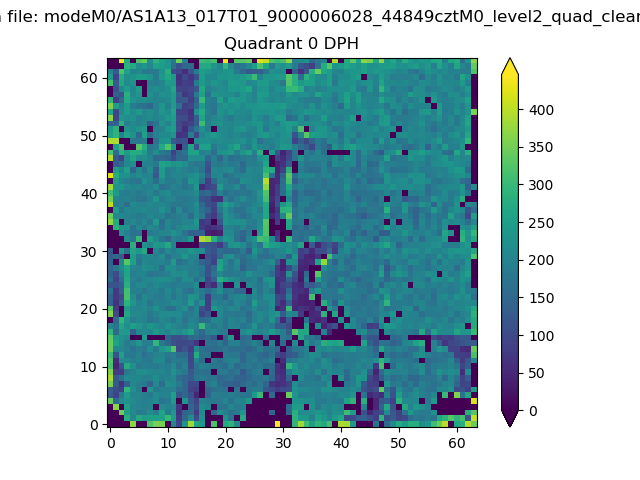 |
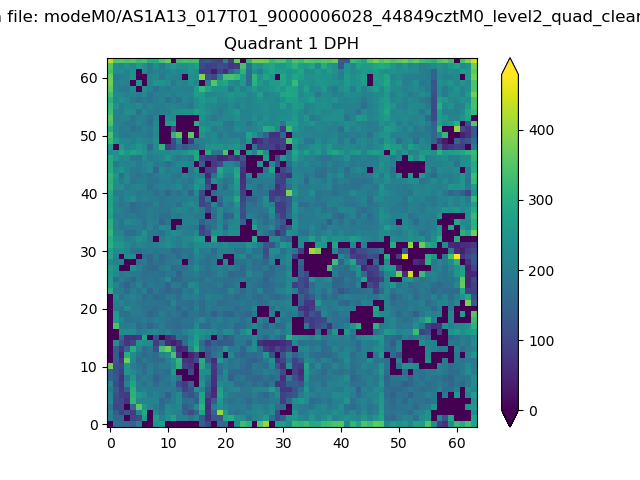 |
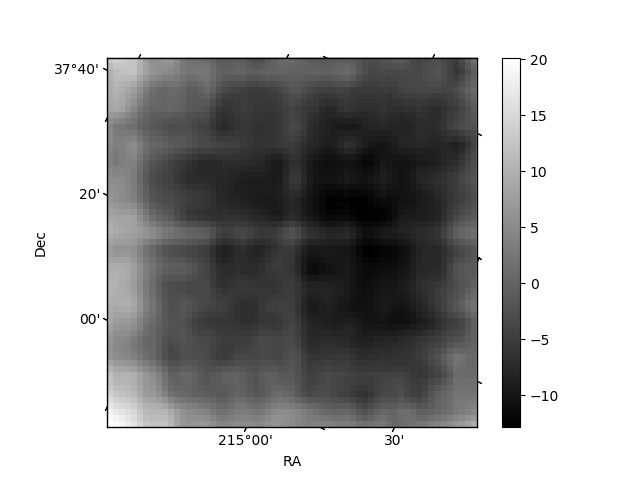
Quadrant B |
|---|---|---|---|
| Quadrant D | 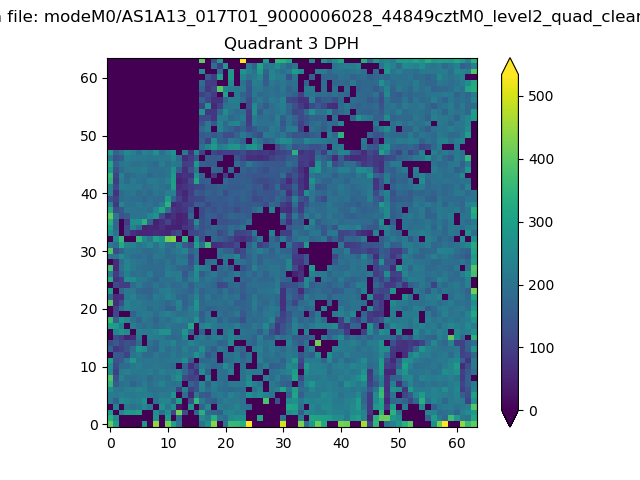 |
 |
Quadrant C |
| Plot type | Count rate plots | Images |
|---|---|---|
| Comparison with Poisson distribution Blue bars denote a histogram of data divided into 1 sec bins. Red curve is a Poisson curve with rate = median count rate of data. |
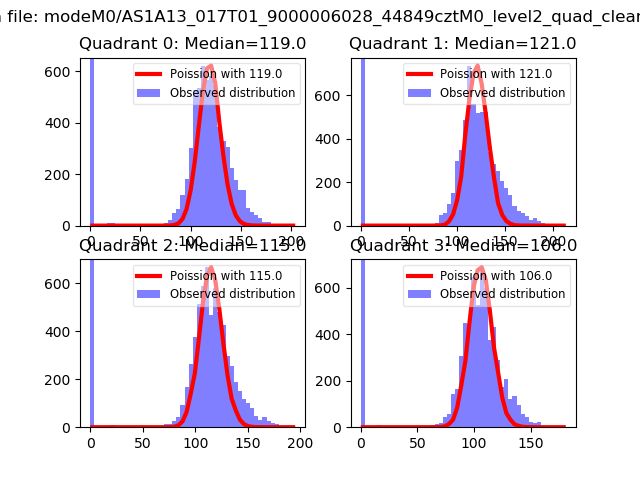 |
 |
| Quadrant-wise count rates Data is divided into 100 sec bins |
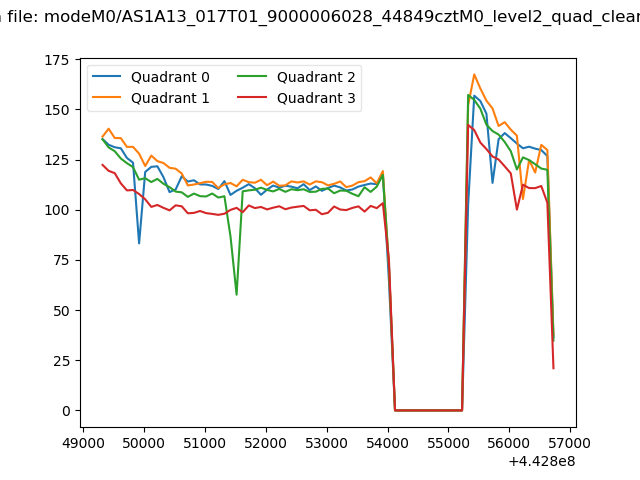 |
|
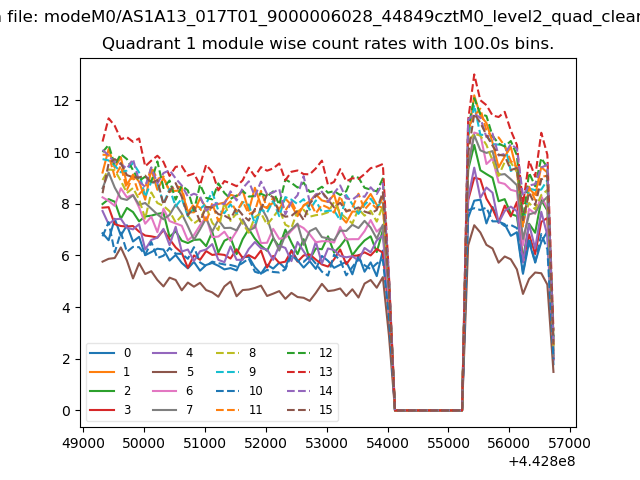
| Module-wise count rates for Quadrant A Data is divided into 100 sec bins |
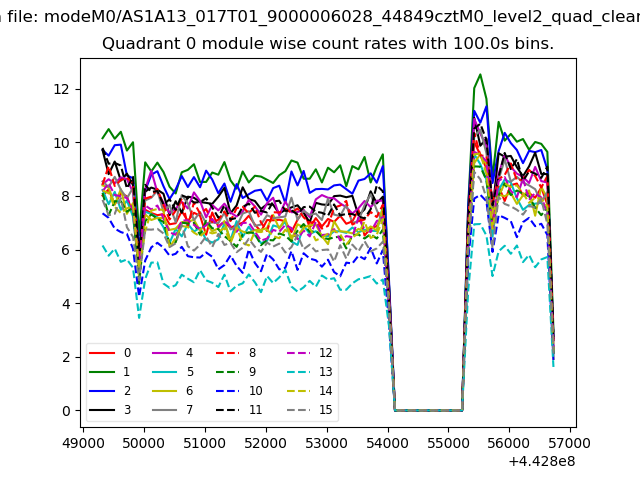 |
 |
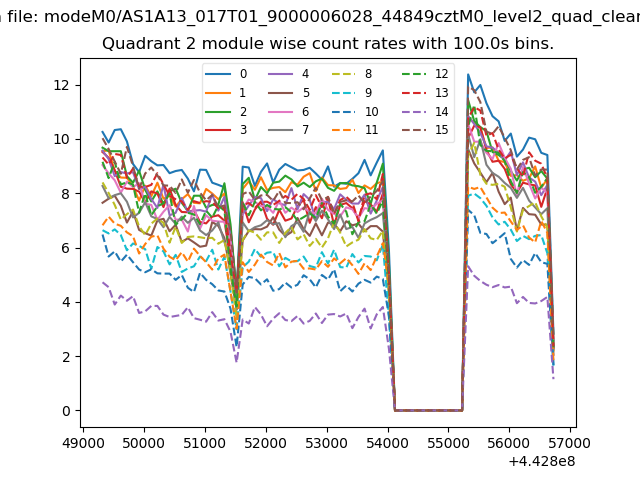
| Module-wise count rates for Quadrant B Data is divided into 100 sec bins |
 |
 |
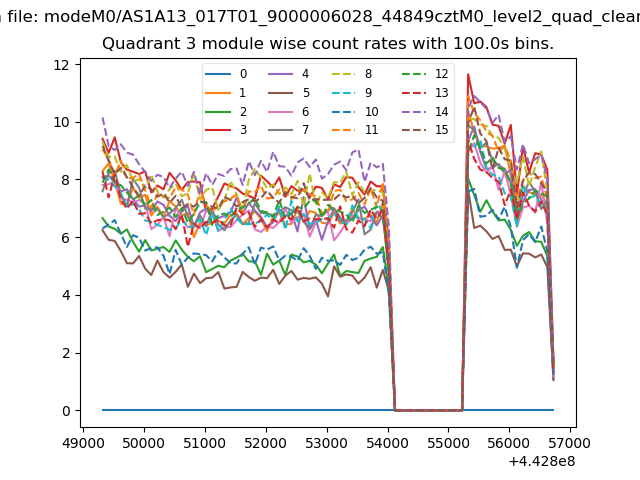
| Module-wise count rates for Quadrant C Data is divided into 100 sec bins |
 |
 |
| Module-wise count rates for Quadrant D Data is divided into 100 sec bins |
 |
 |
| Parameter | Plot |
|---|---|
| CZT HV Monitor | 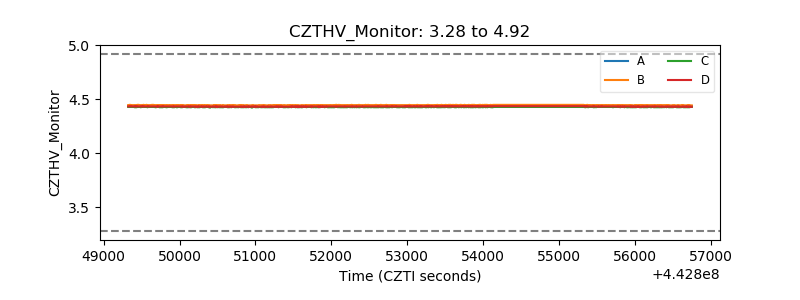 |
| D_VDD |  |
| Temperature 1 | 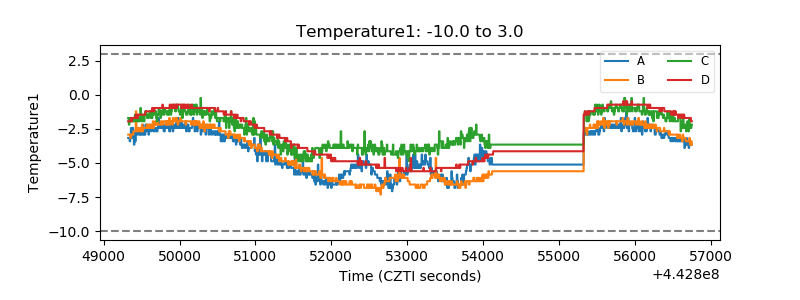 |
| Veto HV Monitor | 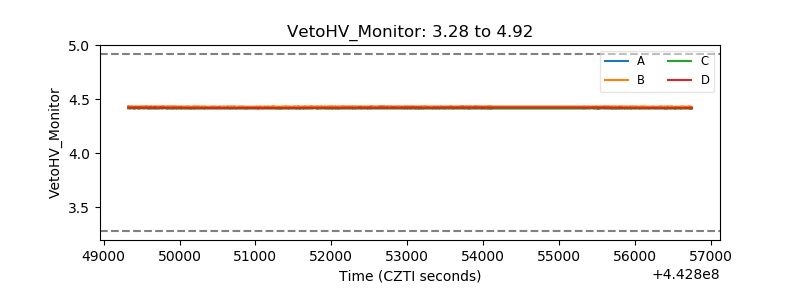 |
| Veto LLD | 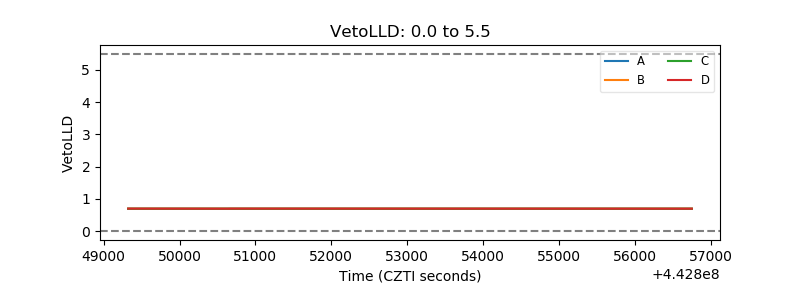 |
| Alpha Counter | 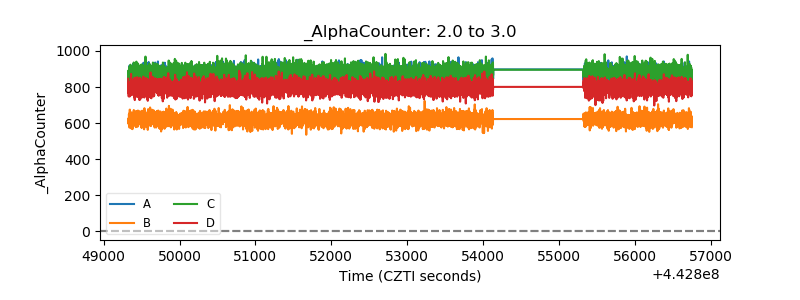 |
| _CPM_Rate | 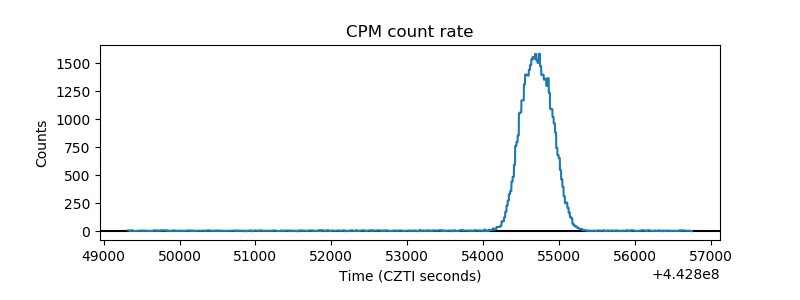 |
| CZT Counter | 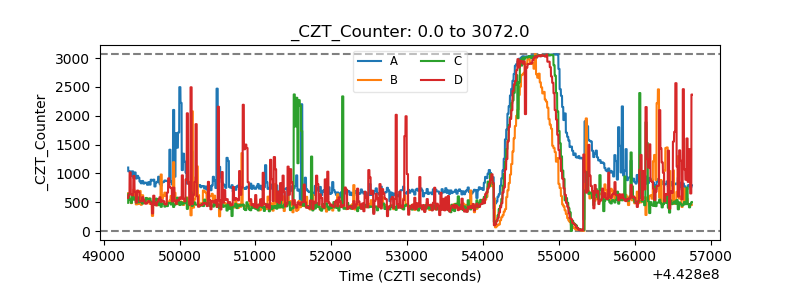 |
| +2.5 Volts monitor | 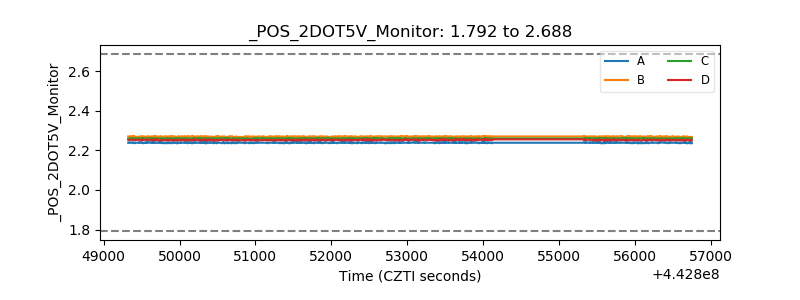 |
| +5 Volts monitor | 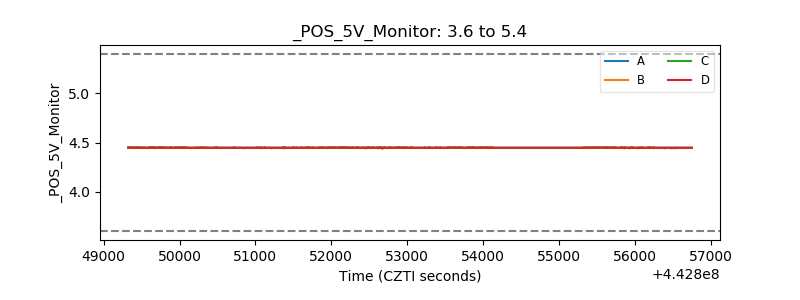 |
| _ROLL_ROT | 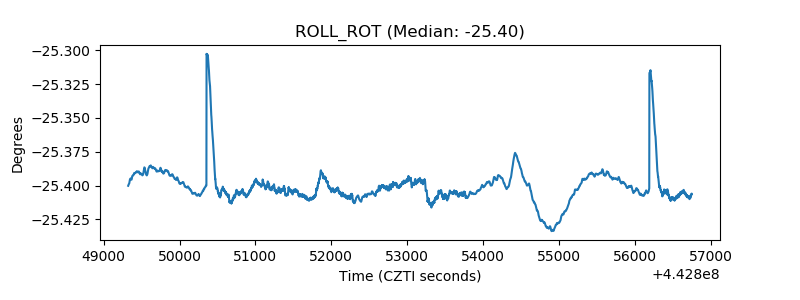 |
| _Roll_DEC | 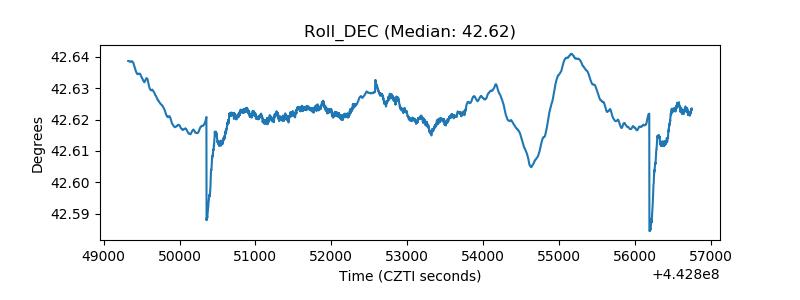 |
| _Roll_RA | 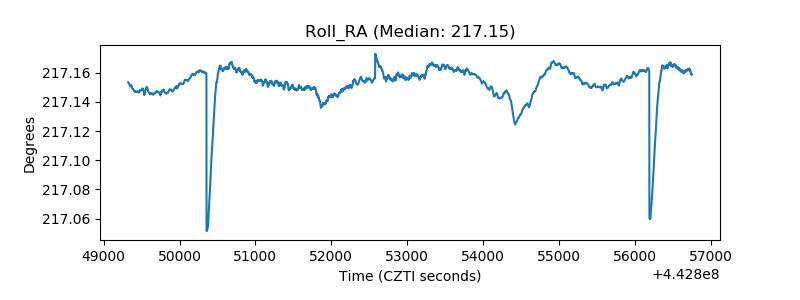 |
| Veto Counter | 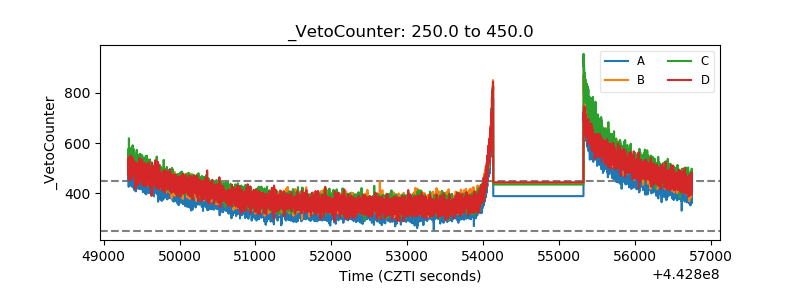 |