| Param | Original file | Final file |
|---|---|---|
| Filename | modeM0/AS1A13_017T01_9000006028_44851cztM0_level2.fits | modeM0/AS1A13_017T01_9000006028_44851cztM0_level2_quad_clean.evt |
| Size (bytes) | 510,243,840 | 113,739,840 |
| Size | 486.6 MB | 108.5 MB |
| Events in quadrant A | 5,284,735 | 772,599 |
| Events in quadrant B | 3,616,969 | 806,036 |
| Events in quadrant C | 3,238,803 | 773,801 |
| Events in quadrant D | 6,258,460 | 651,722 |
| Mode M0 | |||
|---|---|---|---|
| Quadrant | BADHDUFLAG | Total packets | Discarded packets |
| A | 0 | 20725 | 2 |
| B | 0 | 14863 | 2 |
| C | 0 | 13808 | 2 |
| D | 0 | 23063 | 3 |
| Mode SS | |||
|---|---|---|---|
| Quadrant | BADHDUFLAG | Total packets | Discarded packets |
| A | 0 | 130 | 0 |
| B | 0 | 130 | 0 |
| C | 0 | 130 | 0 |
| D | 0 | 130 | 0 |
| Mode M9 | |||
|---|---|---|---|
| Quadrant | BADHDUFLAG | Total packets | Discarded packets |
| A | 0 | 12 | 0 |
| B | 0 | 12 | 0 |
| C | 0 | 12 | 0 |
| D | 0 | 12 | 0 |
| Quadrant | Total seconds | Saturated seconds | Saturation percentage |
|---|---|---|---|
| A | 6299 | 245 | 3.889506% |
| B | 6300 | 180 | 2.857143% |
| C | 6300 | 104 | 1.650794% |
| D | 6299 | 736 | 11.684394% |
Noise dominated data is calculated using 1-second bins in cleaned event files. If a bin has >2000 counts, and if more than 50% of those come from <1% of pixels, then it is considered to be noise-dominated and hence unusable.
| Quadrant | # 1 sec bins | Bins with >0 counts | Bins with >2000 counts | High rate bins dominated by noise | Noise dominated (total time) | Noise dominated (detector-on time) | Marked lightcurve |
|---|---|---|---|---|---|---|---|
| A | 7544 | 6299 | 41 | 41 | 0.54% | 0.65% | 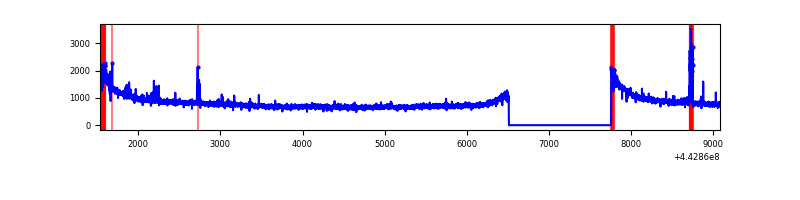 |
| B | 7545 | 6300 | 73 | 73 | 0.97% | 1.16% | 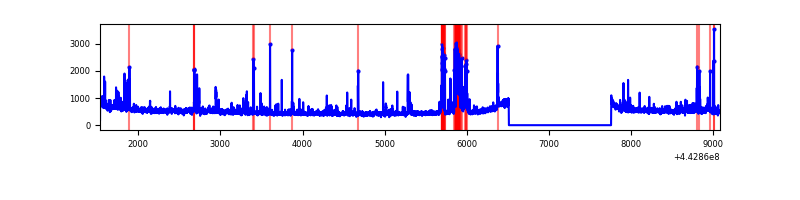 |
| C | 7545 | 6300 | 35 | 35 | 0.46% | 0.56% | 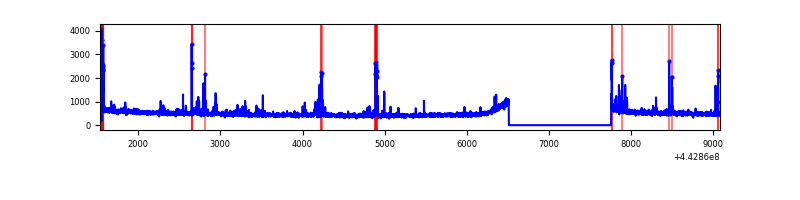 |
| D | 7544 | 6299 | 533 | 533 | 7.07% | 8.46% | 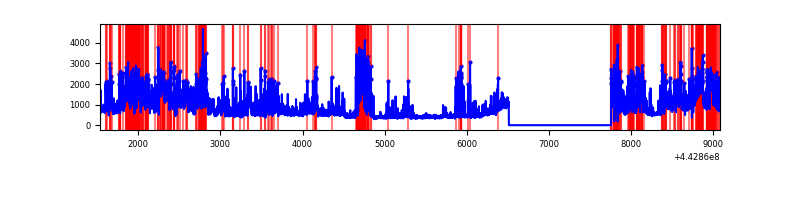 |
Top three noisy pixels from each quadrant. If the there are fewer than three noisy pixels in the level2.evt file, extra rows are filled as -1
| Pixel properties | Quadrant properties | ||||||
|---|---|---|---|---|---|---|---|
| Quadrant | DetID | PixID | Counts | Sigma | Mean | Median | Sigma |
| A | 10 | 83 | 2203090 | 13844.78 | 768 | 753 | 159.1 |
| A | 13 | 248 | 103050 | 643.08 | 768 | 753 | 159.1 |
| A | 3 | 137 | 8337 | 47.68 | 768 | 753 | 159.1 |
| B | 5 | 255 | 234455 | 1555.95 | 773 | 751 | 150.2 |
| B | 7 | 221 | 78747 | 519.28 | 773 | 751 | 150.2 |
| B | 0 | 190 | 63508 | 417.82 | 773 | 751 | 150.2 |
| C | 14 | 254 | 109715 | 613.08 | 766 | 773 | 177.7 |
| C | 12 | 2 | 105011 | 586.6 | 766 | 773 | 177.7 |
| C | 1 | 3 | 21681 | 117.66 | 766 | 773 | 177.7 |
| D | 13 | 174 | 1556752 | 8336.13 | 743 | 722 | 186.7 |
| D | 5 | 235 | 762547 | 4081.33 | 743 | 722 | 186.7 |
| D | 2 | 249 | 555202 | 2970.52 | 743 | 722 | 186.7 |
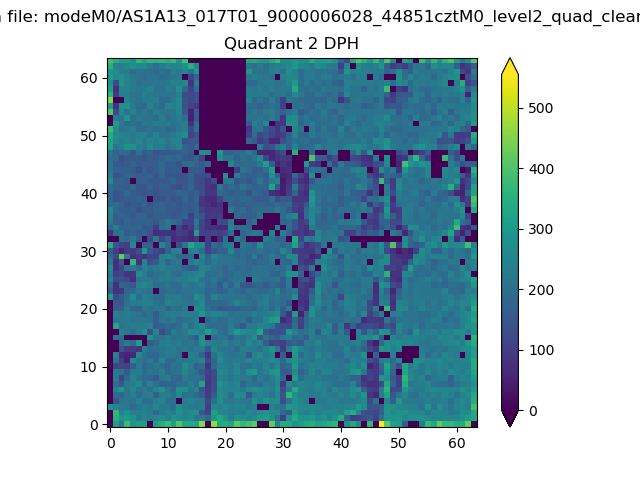
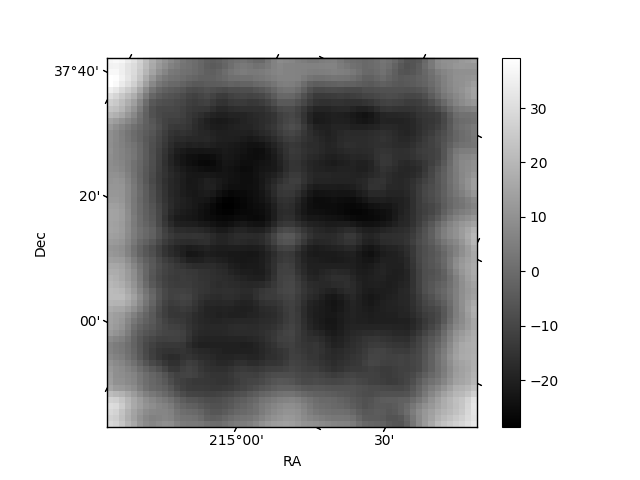
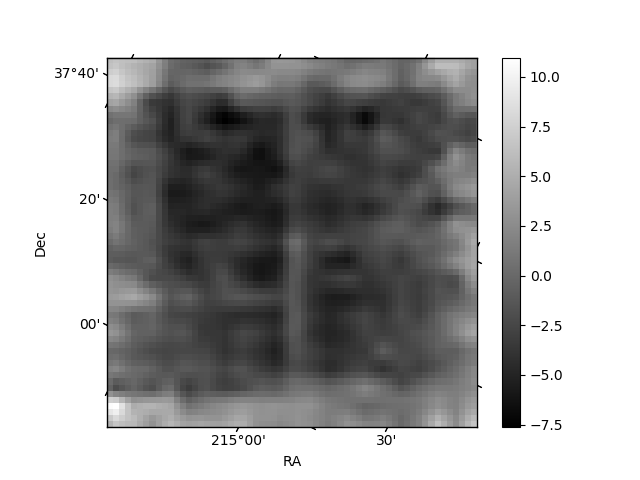
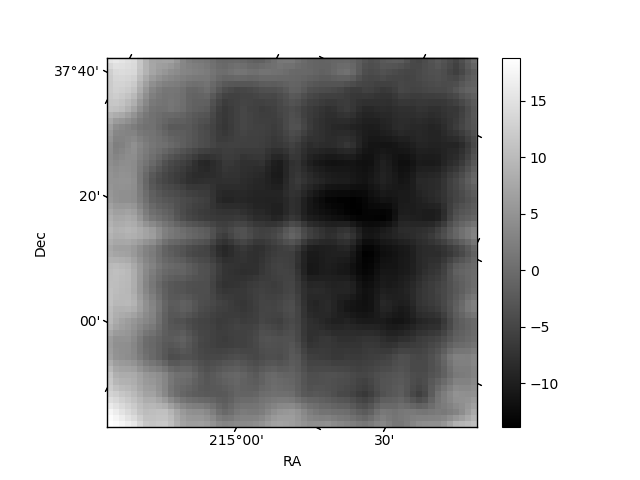
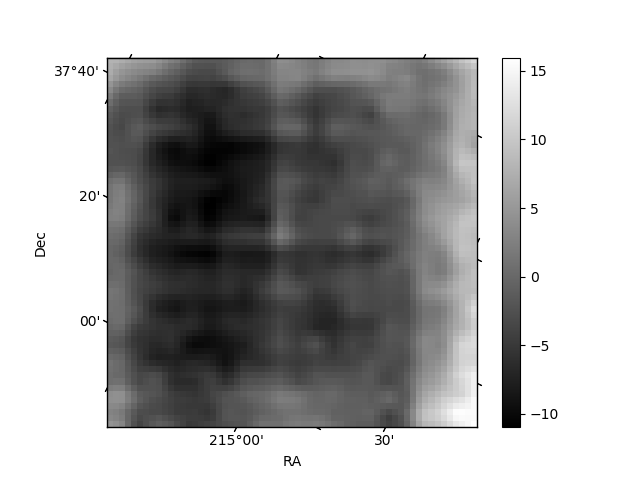
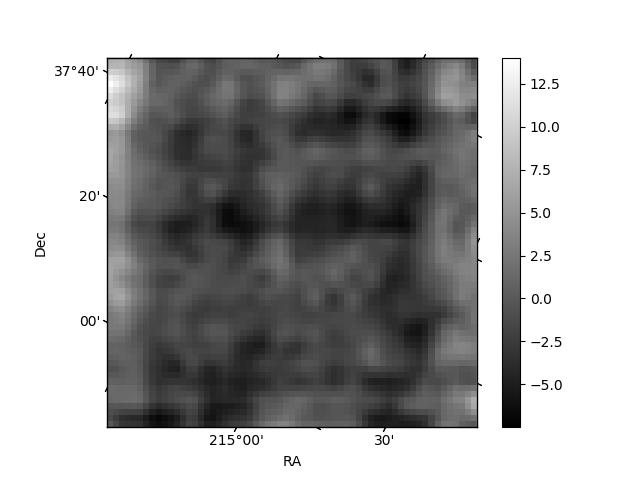
Histogram calculated using DETX and DETY for each event in the final _common_clean file
| Quadrant A | 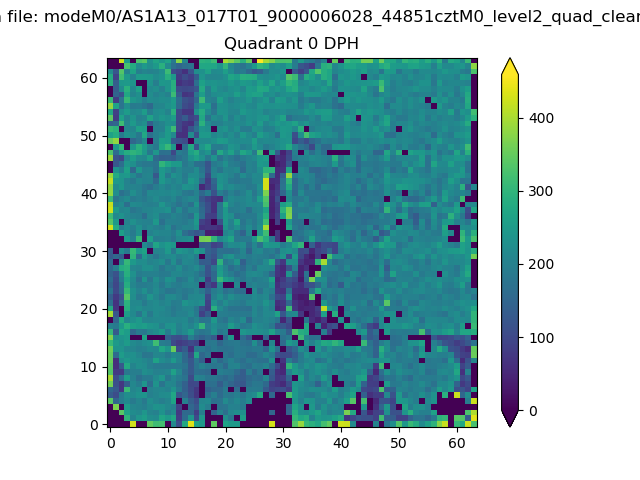 |
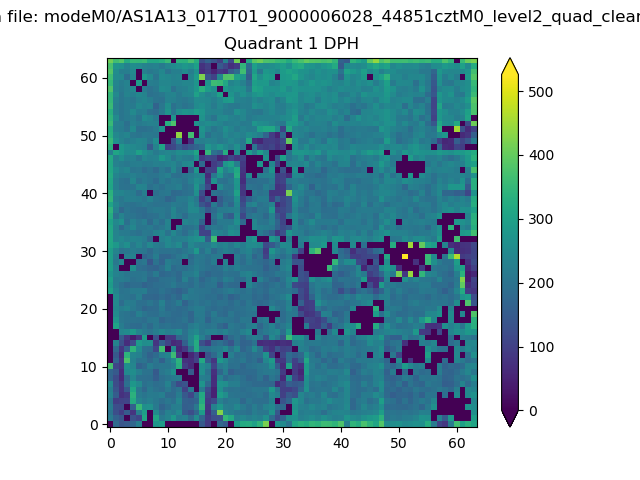 |
Quadrant B |
|---|---|---|---|
| Quadrant D | 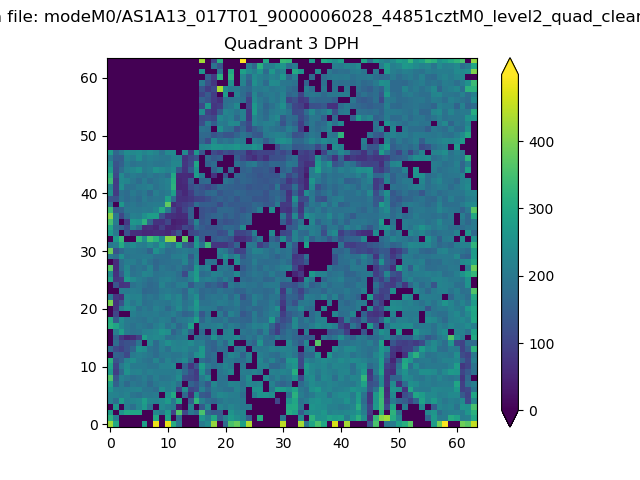 |
 |
Quadrant C |
| Plot type | Count rate plots | Images |
|---|---|---|
| Comparison with Poisson distribution Blue bars denote a histogram of data divided into 1 sec bins. Red curve is a Poisson curve with rate = median count rate of data. |
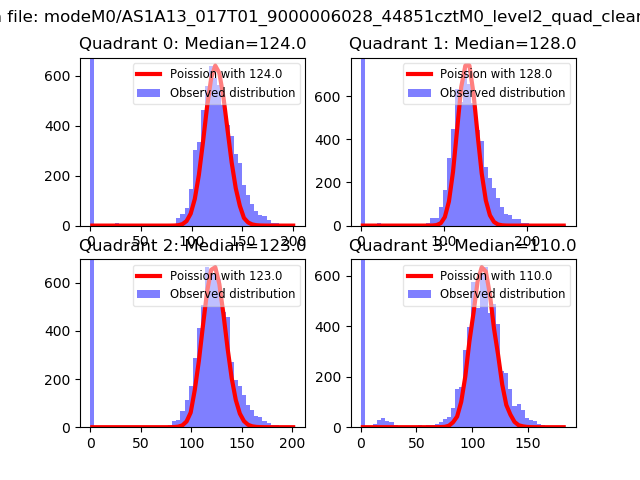 |
 |
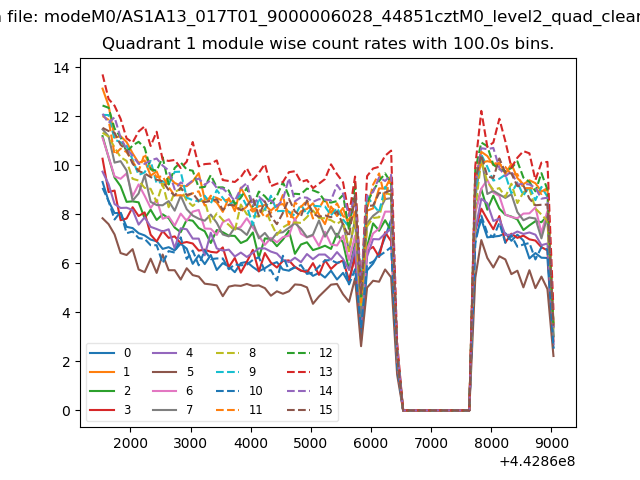
| Quadrant-wise count rates Data is divided into 100 sec bins |
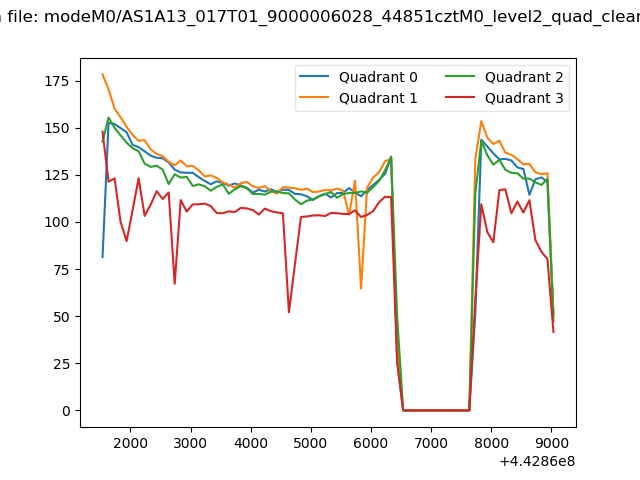 |
|
| Module-wise count rates for Quadrant A Data is divided into 100 sec bins |
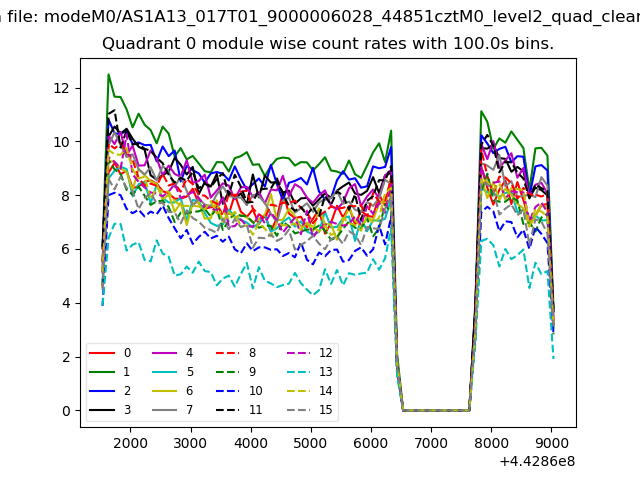 |
 |
| Module-wise count rates for Quadrant B Data is divided into 100 sec bins |
 |
 |
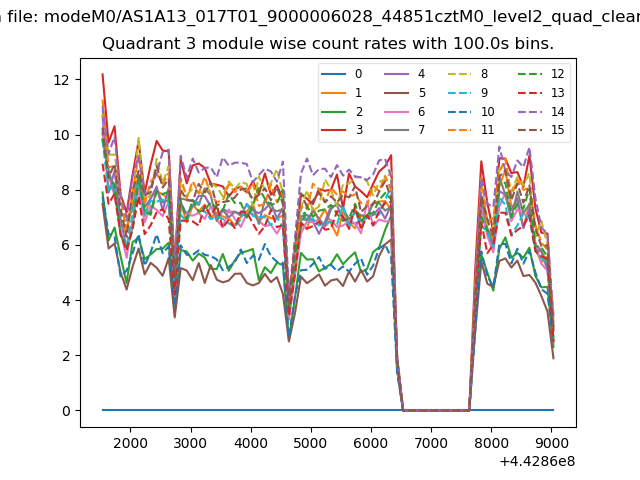
| Module-wise count rates for Quadrant C Data is divided into 100 sec bins |
 |
 |
| Module-wise count rates for Quadrant D Data is divided into 100 sec bins |
 |
 |
| Parameter | Plot |
|---|---|
| CZT HV Monitor |  |
| D_VDD | 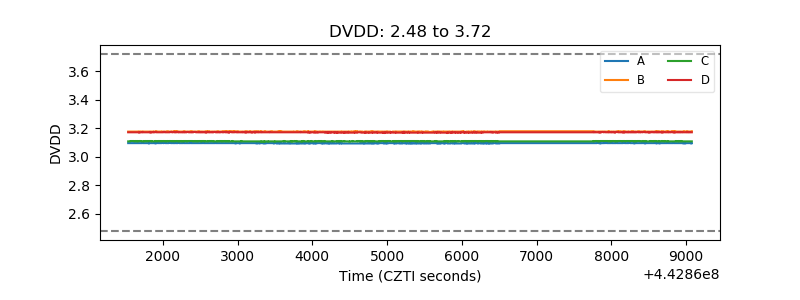 |
| Temperature 1 | 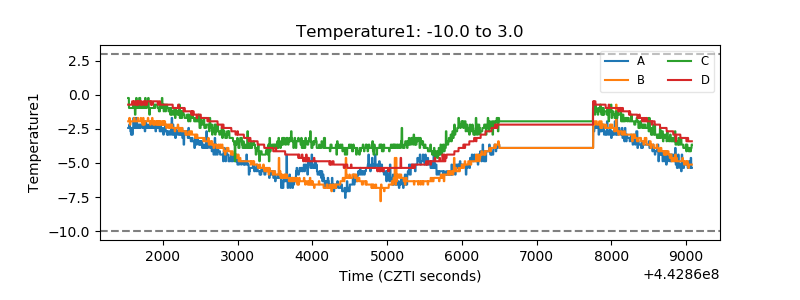 |
| Veto HV Monitor | 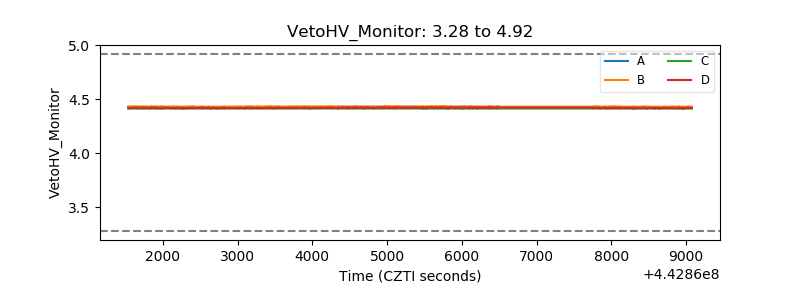 |
| Veto LLD | 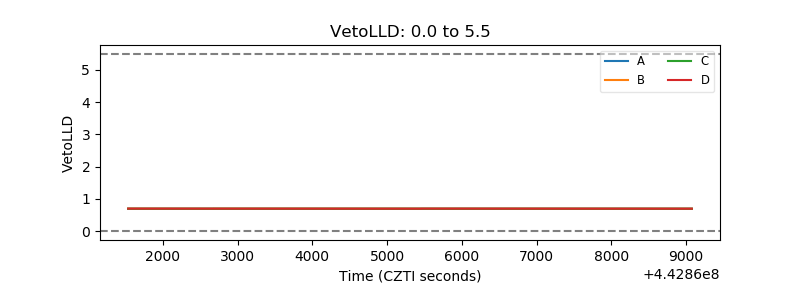 |
| Alpha Counter | 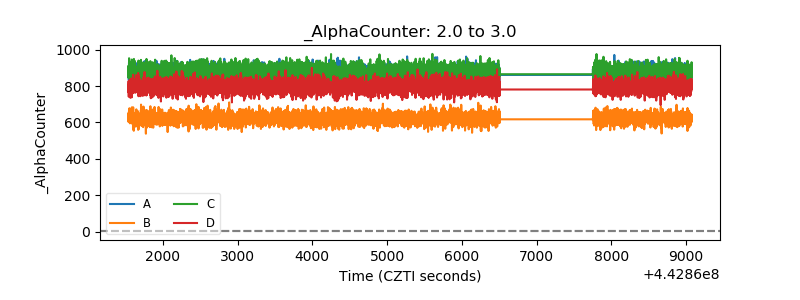 |
| _CPM_Rate | 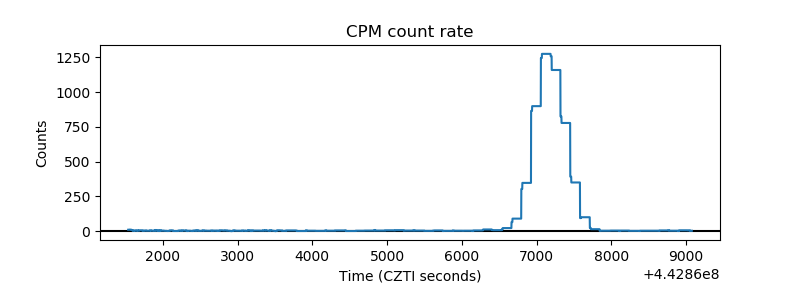 |
| CZT Counter | 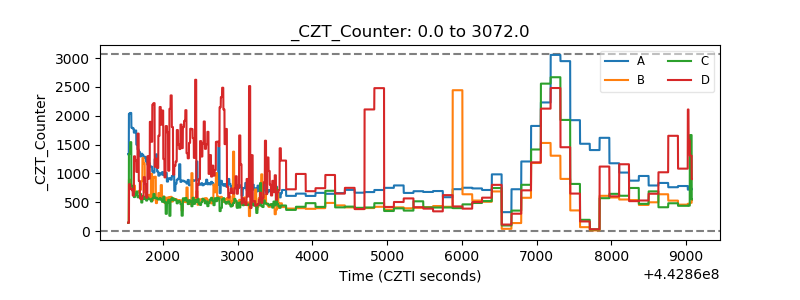 |
| +2.5 Volts monitor | 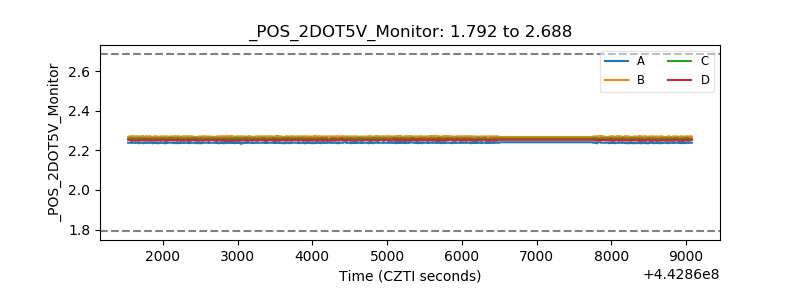 |
| +5 Volts monitor | 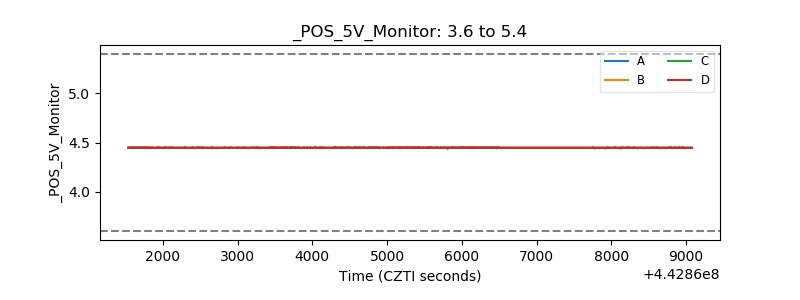 |
| _ROLL_ROT | 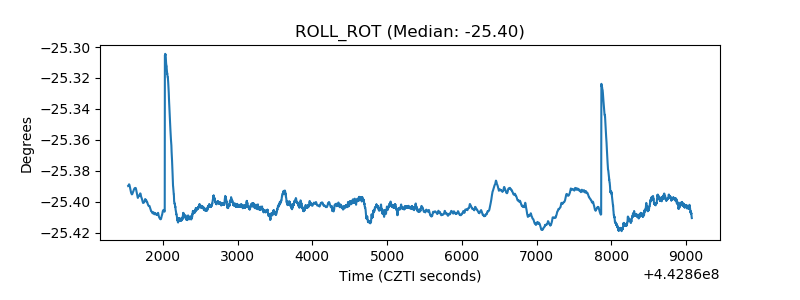 |
| _Roll_DEC | 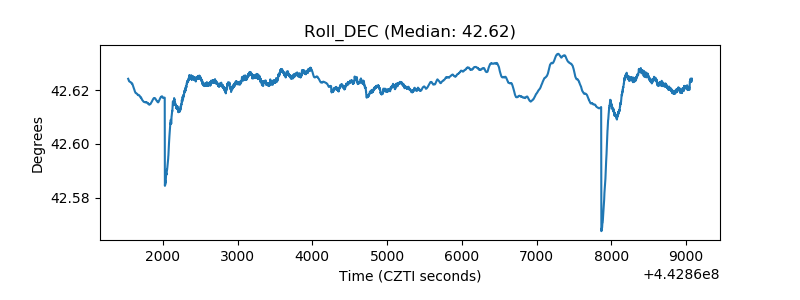 |
| _Roll_RA | 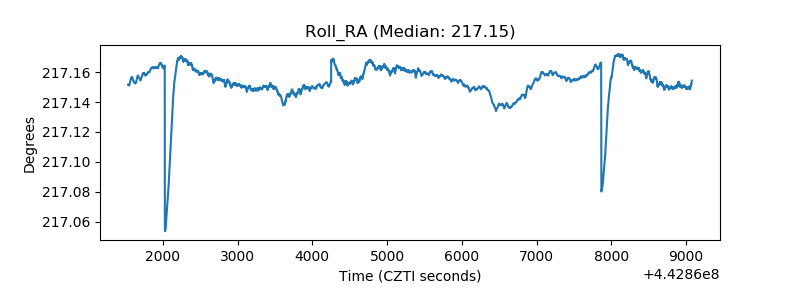 |
| Veto Counter | 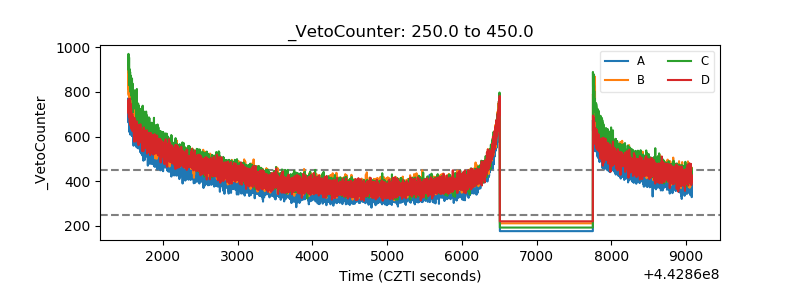 |