| Param | Original file | Final file |
|---|---|---|
| Filename | modeM0/AS1A13_017T01_9000006028_44852cztM0_level2.fits | modeM0/AS1A13_017T01_9000006028_44852cztM0_level2_quad_clean.evt |
| Size (bytes) | 453,651,840 | 106,799,040 |
| Size | 432.6 MB | 101.9 MB |
| Events in quadrant A | 4,896,528 | 713,444 |
| Events in quadrant B | 3,275,838 | 744,944 |
| Events in quadrant C | 2,905,927 | 715,106 |
| Events in quadrant D | 5,237,797 | 632,172 |
| Mode M0 | |||
|---|---|---|---|
| Quadrant | BADHDUFLAG | Total packets | Discarded packets |
| A | 0 | 19667 | 1 |
| B | 0 | 13977 | 1 |
| C | 0 | 12916 | 1 |
| D | 0 | 19958 | 1 |
| Mode SS | |||
|---|---|---|---|
| Quadrant | BADHDUFLAG | Total packets | Discarded packets |
| A | 0 | 124 | 0 |
| B | 0 | 124 | 0 |
| C | 0 | 124 | 0 |
| D | 0 | 124 | 0 |
| Mode M9 | |||
|---|---|---|---|
| Quadrant | BADHDUFLAG | Total packets | Discarded packets |
| A | 0 | 12 | 0 |
| B | 0 | 12 | 0 |
| C | 0 | 12 | 0 |
| D | 0 | 12 | 0 |
| Quadrant | Total seconds | Saturated seconds | Saturation percentage |
|---|---|---|---|
| A | 6140 | 195 | 3.175896% |
| B | 6141 | 87 | 1.416707% |
| C | 6141 | 53 | 0.863052% |
| D | 6140 | 329 | 5.358306% |
Noise dominated data is calculated using 1-second bins in cleaned event files. If a bin has >2000 counts, and if more than 50% of those come from <1% of pixels, then it is considered to be noise-dominated and hence unusable.
| Quadrant | # 1 sec bins | Bins with >0 counts | Bins with >2000 counts | High rate bins dominated by noise | Noise dominated (total time) | Noise dominated (detector-on time) | Marked lightcurve |
|---|---|---|---|---|---|---|---|
| A | 7320 | 6141 | 36 | 36 | 0.49% | 0.59% | 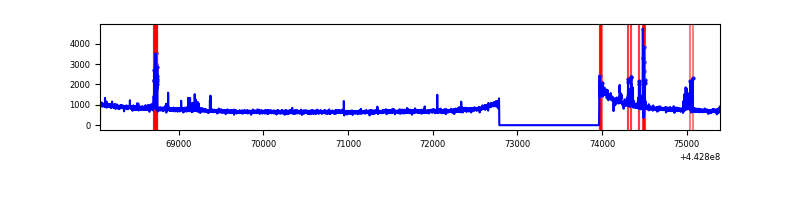 |
| B | 7321 | 6142 | 27 | 27 | 0.37% | 0.44% | 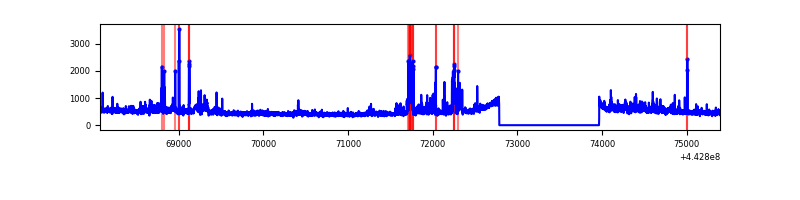 |
| C | 7321 | 6142 | 7 | 7 | 0.10% | 0.11% | 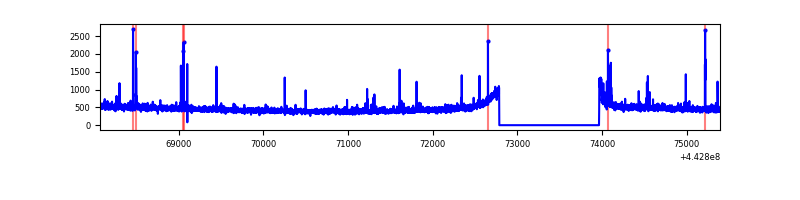 |
| D | 7320 | 6141 | 274 | 274 | 3.74% | 4.46% | 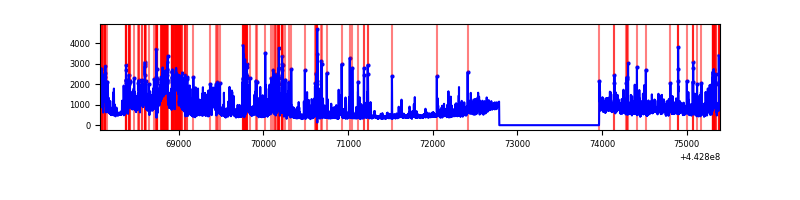 |
Top three noisy pixels from each quadrant. If the there are fewer than three noisy pixels in the level2.evt file, extra rows are filled as -1
| Pixel properties | Quadrant properties | ||||||
|---|---|---|---|---|---|---|---|
| Quadrant | DetID | PixID | Counts | Sigma | Mean | Median | Sigma |
| A | 10 | 83 | 1936379 | 13098.56 | 710 | 695 | 147.8 |
| A | 13 | 248 | 199532 | 1345.51 | 710 | 695 | 147.8 |
| A | 3 | 137 | 8023 | 49.59 | 710 | 695 | 147.8 |
| B | 5 | 255 | 208009 | 1475.64 | 716 | 695 | 140.5 |
| B | 0 | 155 | 134686 | 953.73 | 716 | 695 | 140.5 |
| B | 0 | 190 | 28737 | 199.6 | 716 | 695 | 140.5 |
| C | 12 | 2 | 64488 | 387.07 | 713 | 718 | 164.8 |
| C | 14 | 254 | 31405 | 186.26 | 713 | 718 | 164.8 |
| C | 3 | 233 | 16192 | 93.92 | 713 | 718 | 164.8 |
| D | 13 | 174 | 1221314 | 7012.87 | 696 | 676 | 174.1 |
| D | 5 | 235 | 574229 | 3295.21 | 696 | 676 | 174.1 |
| D | 2 | 249 | 262613 | 1504.89 | 696 | 676 | 174.1 |
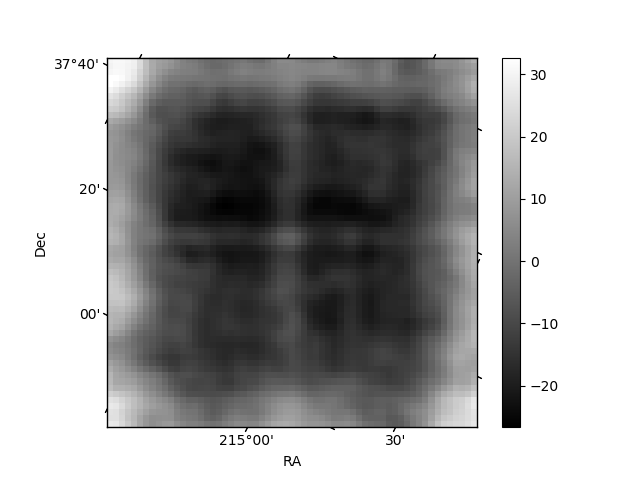
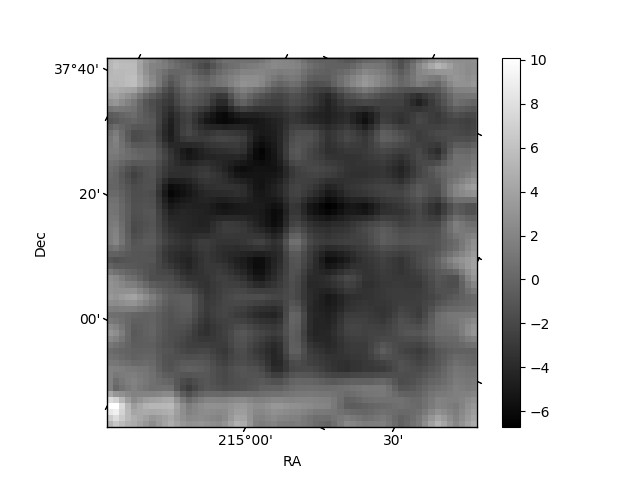
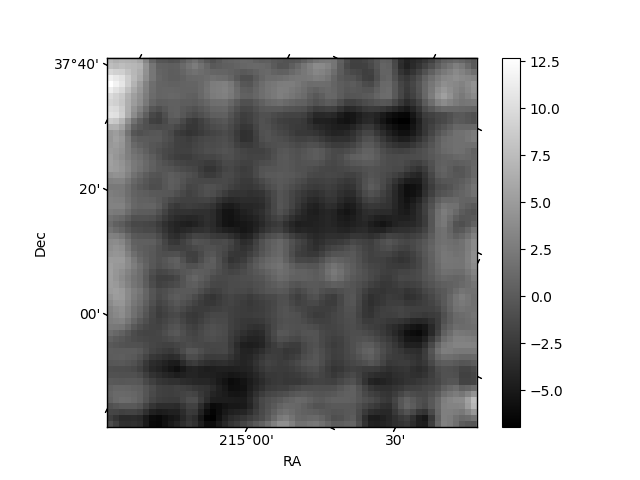
Histogram calculated using DETX and DETY for each event in the final _common_clean file
| Quadrant A | 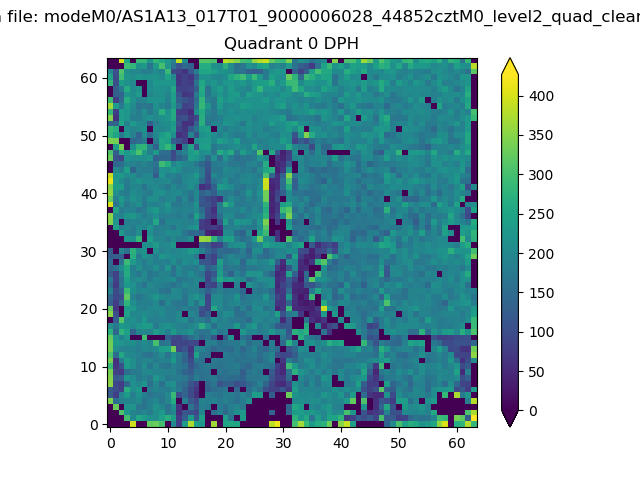 |
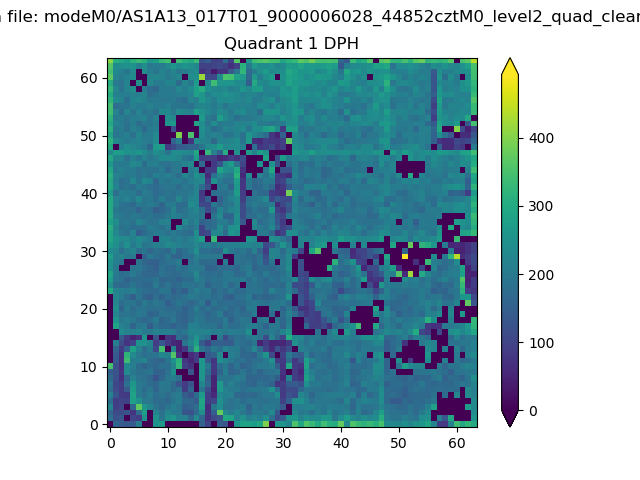 |
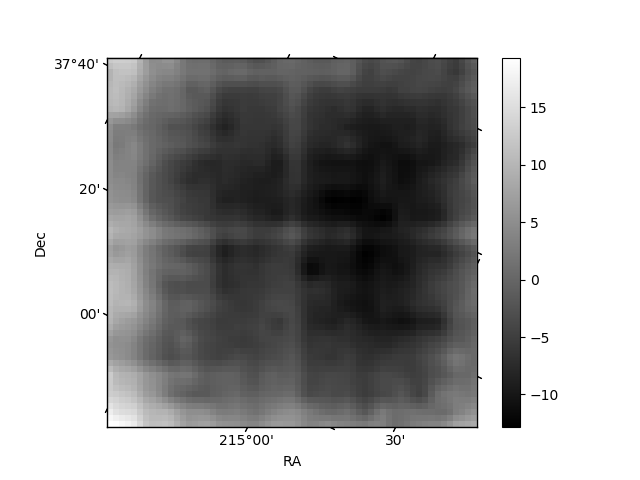
Quadrant B |
|---|---|---|---|
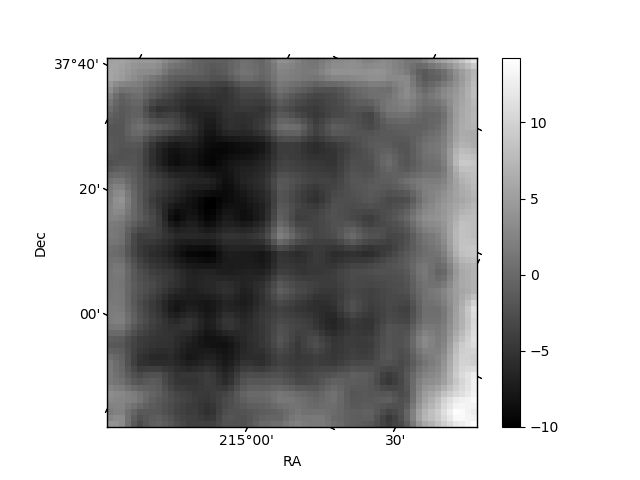
| Quadrant D | 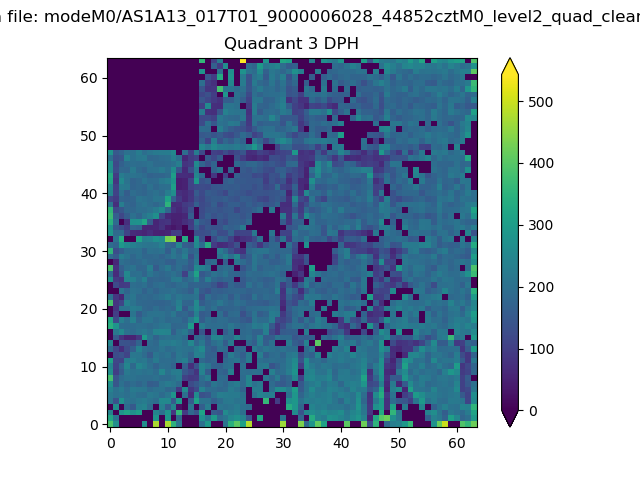 |
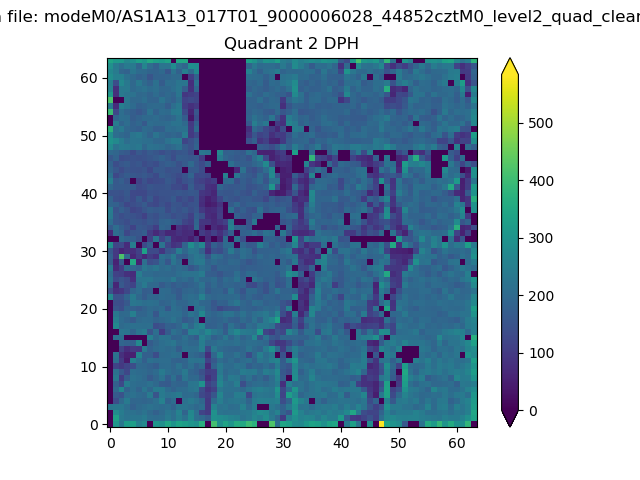 |
Quadrant C |
| Plot type | Count rate plots | Images |
|---|---|---|
| Comparison with Poisson distribution Blue bars denote a histogram of data divided into 1 sec bins. Red curve is a Poisson curve with rate = median count rate of data. |
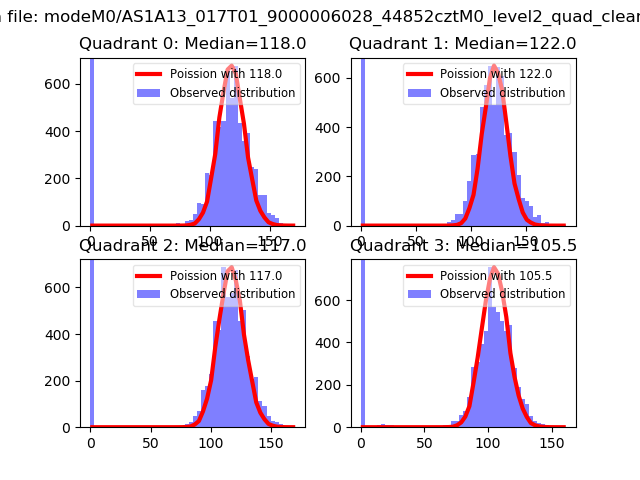 |
 |
| Quadrant-wise count rates Data is divided into 100 sec bins |
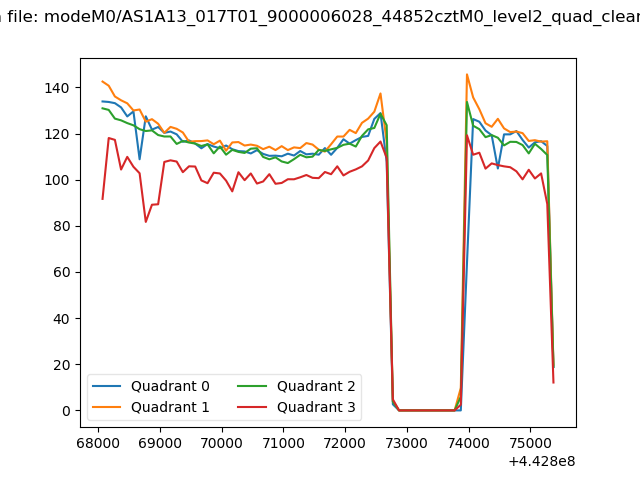 |
|
| Module-wise count rates for Quadrant A Data is divided into 100 sec bins |
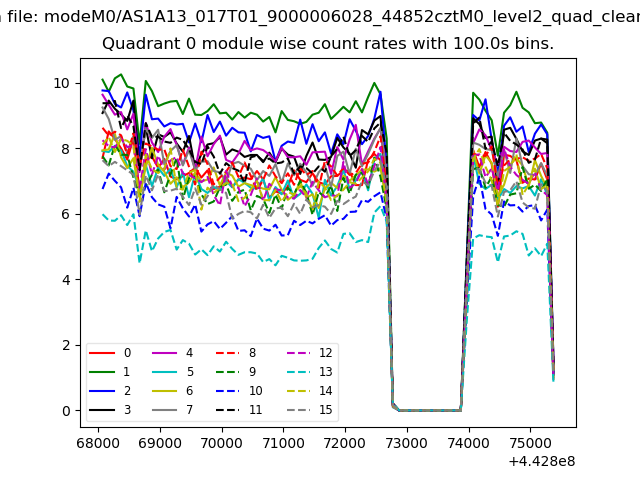 |
 |
| Module-wise count rates for Quadrant B Data is divided into 100 sec bins |
 |
 |
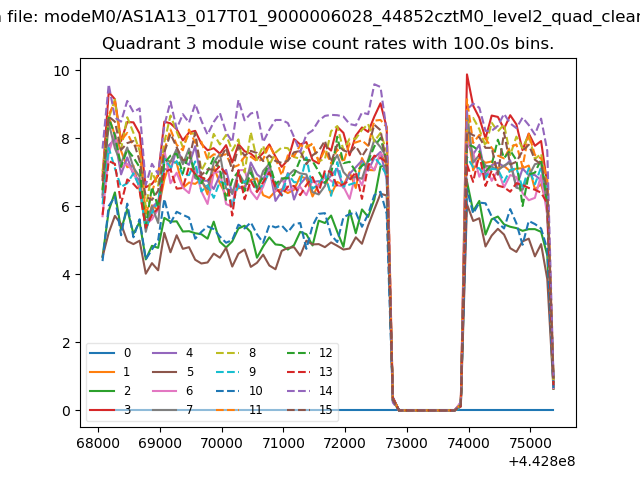
| Module-wise count rates for Quadrant C Data is divided into 100 sec bins |
 |
 |
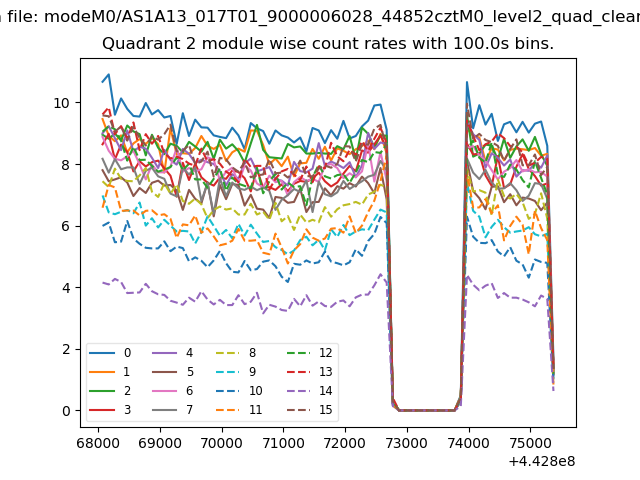
| Module-wise count rates for Quadrant D Data is divided into 100 sec bins |
 |
 |
| Parameter | Plot |
|---|---|
| CZT HV Monitor |  |
| D_VDD |  |
| Temperature 1 | 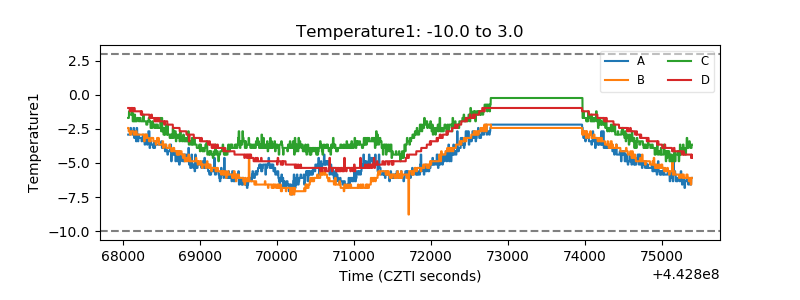 |
| Veto HV Monitor | 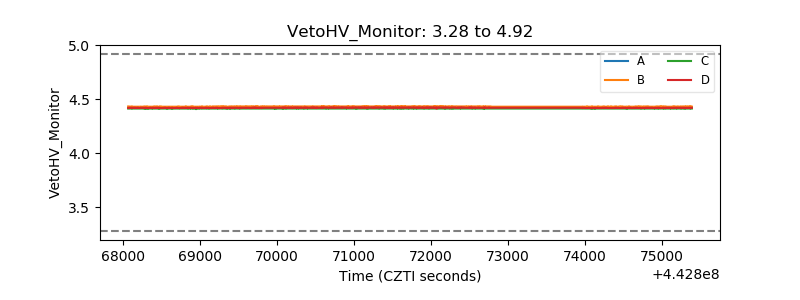 |
| Veto LLD | 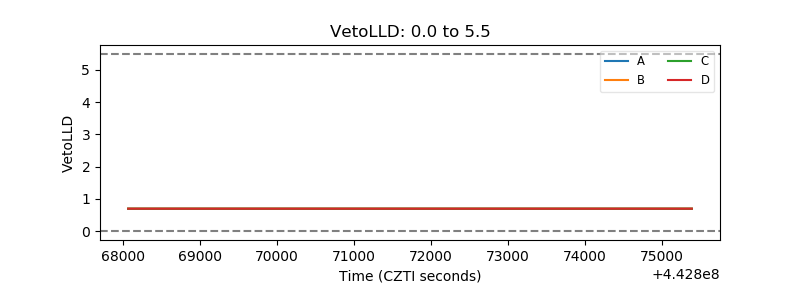 |
| Alpha Counter | 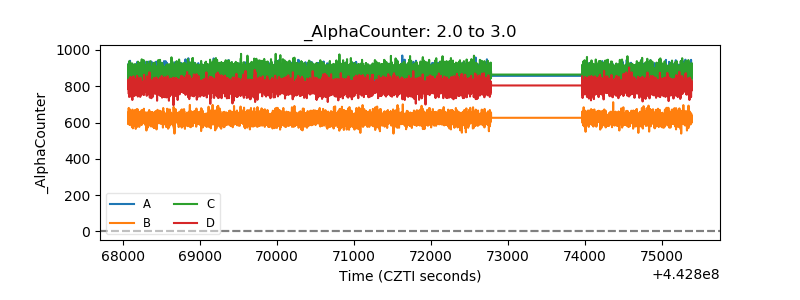 |
| _CPM_Rate | 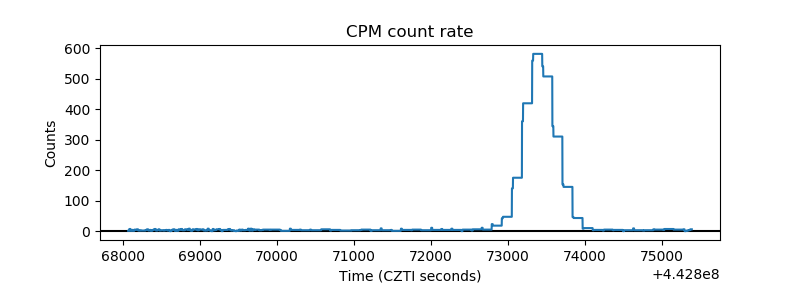 |
| CZT Counter | 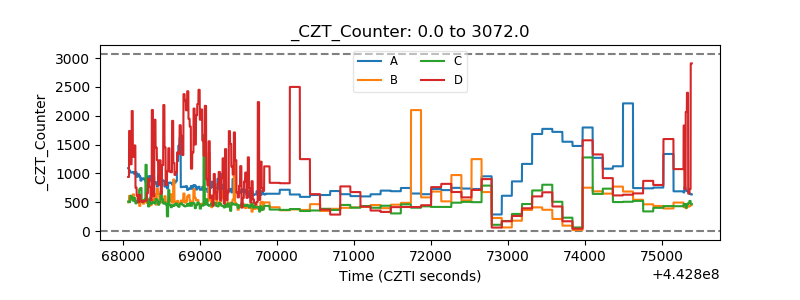 |
| +2.5 Volts monitor | 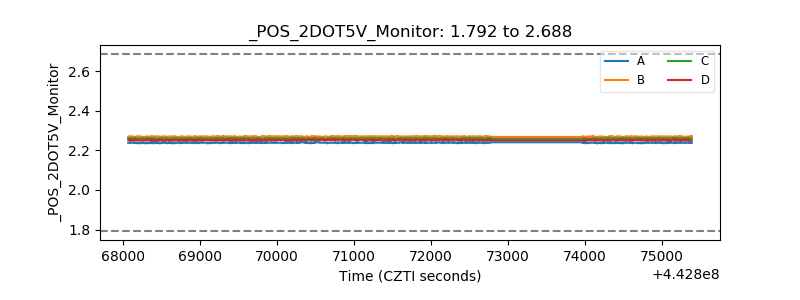 |
| +5 Volts monitor | 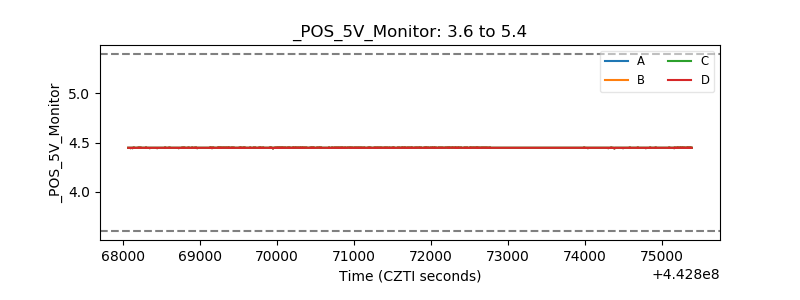 |
| _ROLL_ROT | 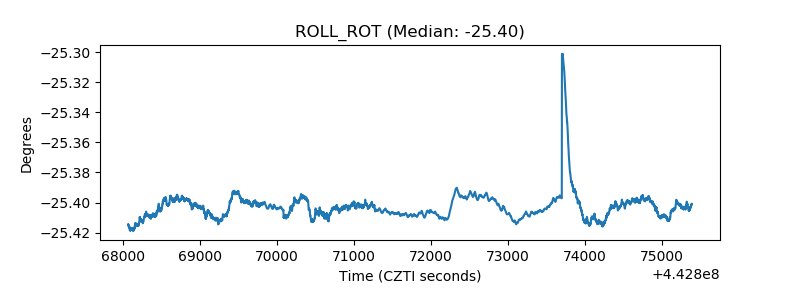 |
| _Roll_DEC | 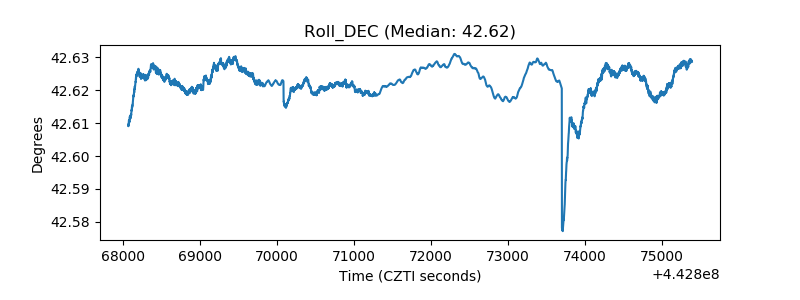 |
| _Roll_RA | 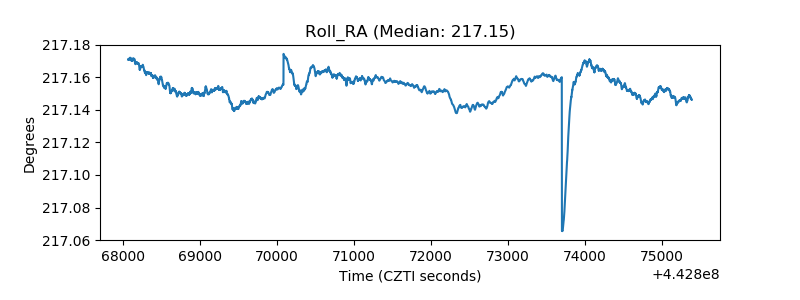 |
| Veto Counter | 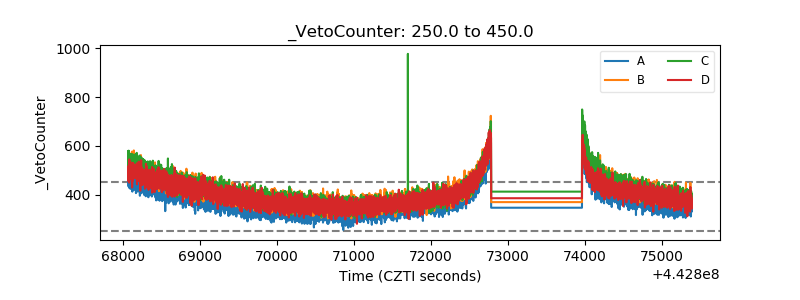 |