| Param | Original file | Final file |
|---|---|---|
| Filename | modeM0/AS1A13_017T01_9000006028_44853cztM0_level2.fits | modeM0/AS1A13_017T01_9000006028_44853cztM0_level2_quad_clean.evt |
| Size (bytes) | 496,100,160 | 112,870,080 |
| Size | 473.1 MB | 107.6 MB |
| Events in quadrant A | 5,526,573 | 745,494 |
| Events in quadrant B | 3,341,019 | 790,536 |
| Events in quadrant C | 3,233,030 | 760,966 |
| Events in quadrant D | 5,735,035 | 646,722 |
| Mode M0 | |||
|---|---|---|---|
| Quadrant | BADHDUFLAG | Total packets | Discarded packets |
| A | 0 | 22110 | 2 |
| B | 0 | 14775 | 2 |
| C | 0 | 14489 | 2 |
| D | 0 | 21927 | 2 |
| Mode SS | |||
|---|---|---|---|
| Quadrant | BADHDUFLAG | Total packets | Discarded packets |
| A | 0 | 136 | 0 |
| B | 0 | 138 | 0 |
| C | 0 | 138 | 0 |
| D | 0 | 138 | 0 |
| Mode M9 | |||
|---|---|---|---|
| Quadrant | BADHDUFLAG | Total packets | Discarded packets |
| A | 0 | 21 | 0 |
| B | 0 | 22 | 0 |
| C | 0 | 22 | 0 |
| D | 0 | 22 | 0 |
| Quadrant | Total seconds | Saturated seconds | Saturation percentage |
|---|---|---|---|
| A | 6808 | 310 | 4.553467% |
| B | 6807 | 67 | 0.984281% |
| C | 6807 | 54 | 0.793301% |
| D | 6807 | 526 | 7.727340% |
Noise dominated data is calculated using 1-second bins in cleaned event files. If a bin has >2000 counts, and if more than 50% of those come from <1% of pixels, then it is considered to be noise-dominated and hence unusable.
| Quadrant | # 1 sec bins | Bins with >0 counts | Bins with >2000 counts | High rate bins dominated by noise | Noise dominated (total time) | Noise dominated (detector-on time) | Marked lightcurve |
|---|---|---|---|---|---|---|---|
| A | 7733 | 6809 | 53 | 53 | 0.69% | 0.78% | 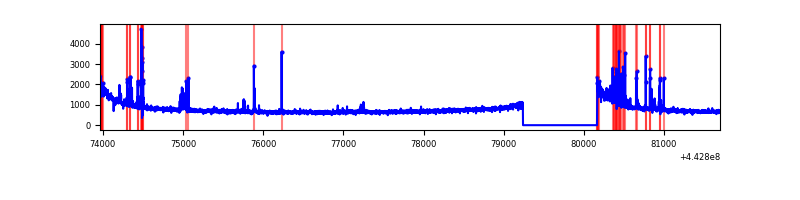 |
| B | 7732 | 6808 | 3 | 3 | 0.04% | 0.04% | 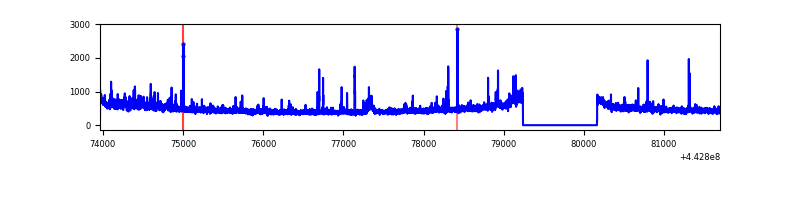 |
| C | 7732 | 6808 | 13 | 13 | 0.17% | 0.19% | 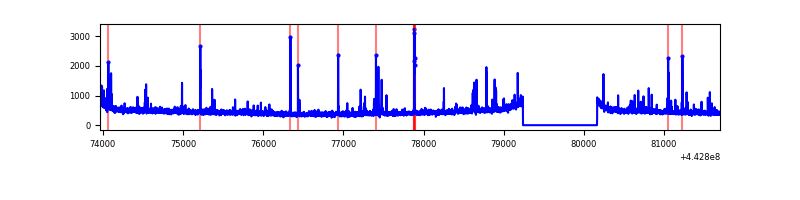 |
| D | 7732 | 6808 | 378 | 378 | 4.89% | 5.55% | 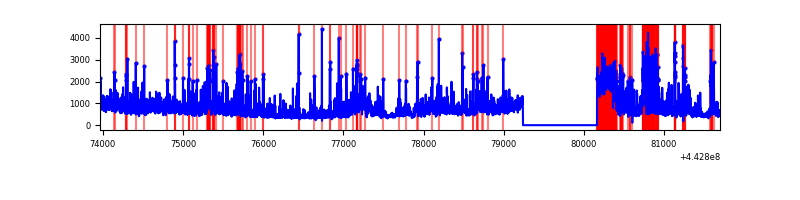 |
Top three noisy pixels from each quadrant. If the there are fewer than three noisy pixels in the level2.evt file, extra rows are filled as -1
| Pixel properties | Quadrant properties | ||||||
|---|---|---|---|---|---|---|---|
| Quadrant | DetID | PixID | Counts | Sigma | Mean | Median | Sigma |
| A | 10 | 83 | 2265912 | 14192.47 | 767 | 750 | 159.6 |
| A | 13 | 248 | 266324 | 1663.97 | 767 | 750 | 159.6 |
| A | 10 | 255 | 14160 | 84.02 | 767 | 750 | 159.6 |
| B | 0 | 155 | 95331 | 614.17 | 778 | 755 | 154.0 |
| B | 3 | 112 | 42053 | 268.19 | 778 | 755 | 154.0 |
| B | 5 | 255 | 33354 | 211.7 | 778 | 755 | 154.0 |
| C | 12 | 2 | 158339 | 877.45 | 768 | 773 | 179.6 |
| C | 3 | 233 | 25772 | 139.21 | 768 | 773 | 179.6 |
| C | 1 | 3 | 24764 | 133.6 | 768 | 773 | 179.6 |
| D | 13 | 174 | 1245870 | 6658.81 | 740 | 716 | 187.0 |
| D | 5 | 235 | 350221 | 1869.08 | 740 | 716 | 187.0 |
| D | 2 | 249 | 276706 | 1475.93 | 740 | 716 | 187.0 |
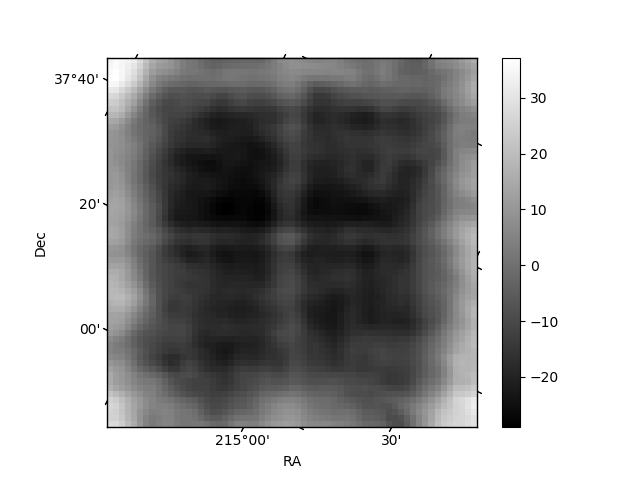
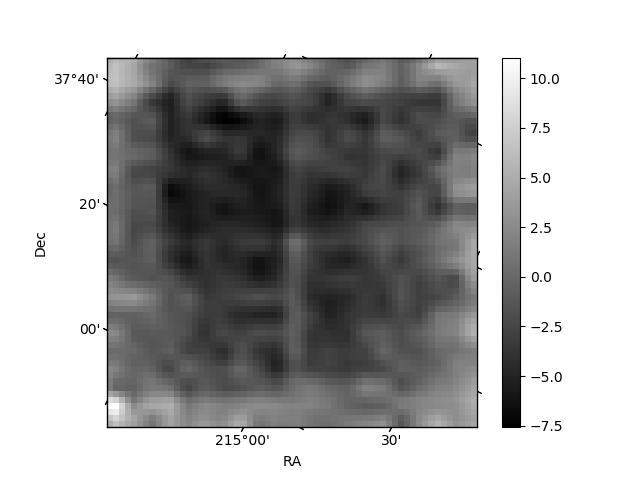
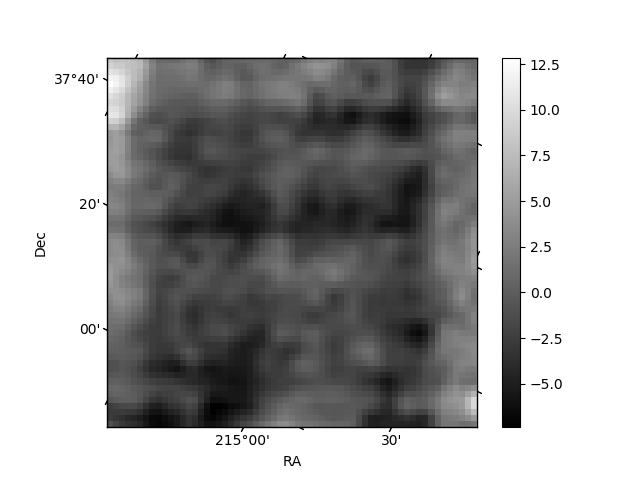
Histogram calculated using DETX and DETY for each event in the final _common_clean file
| Quadrant A | 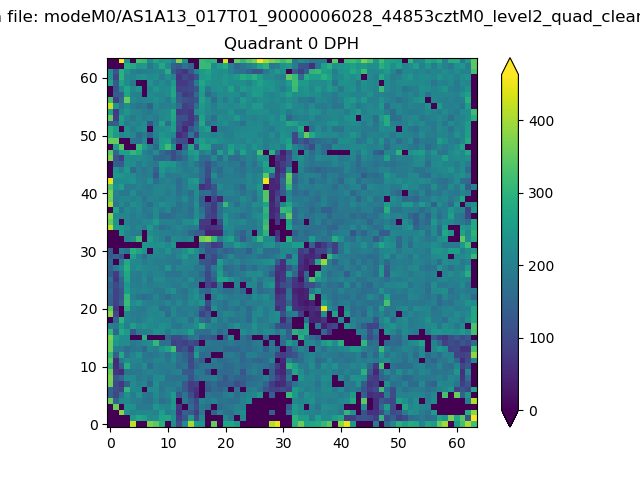 |
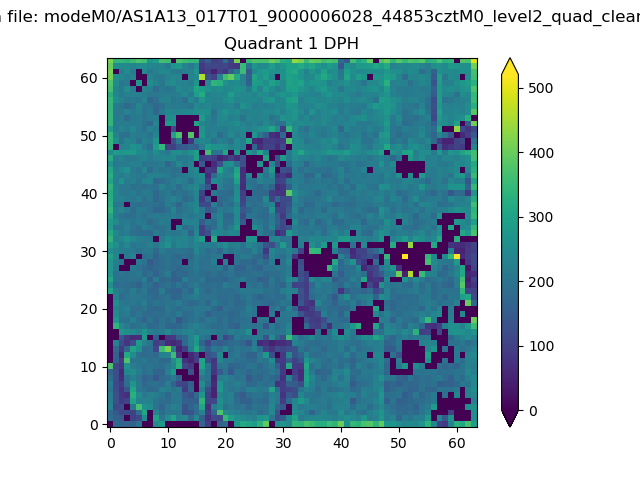 |
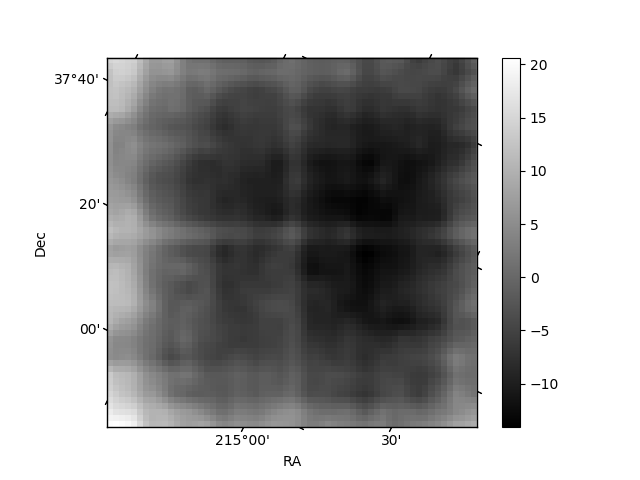
Quadrant B |
|---|---|---|---|
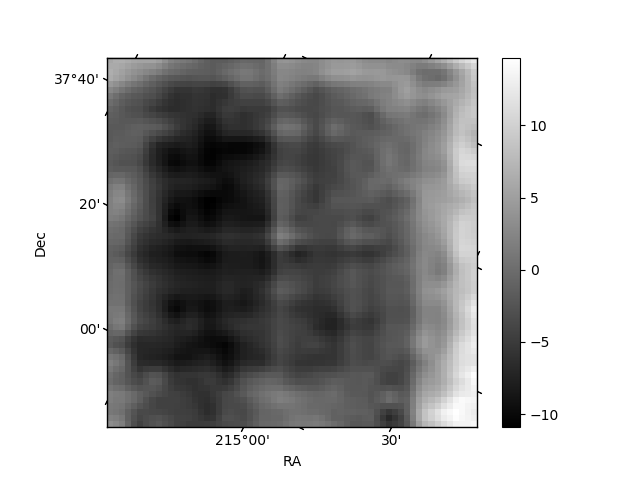
| Quadrant D | 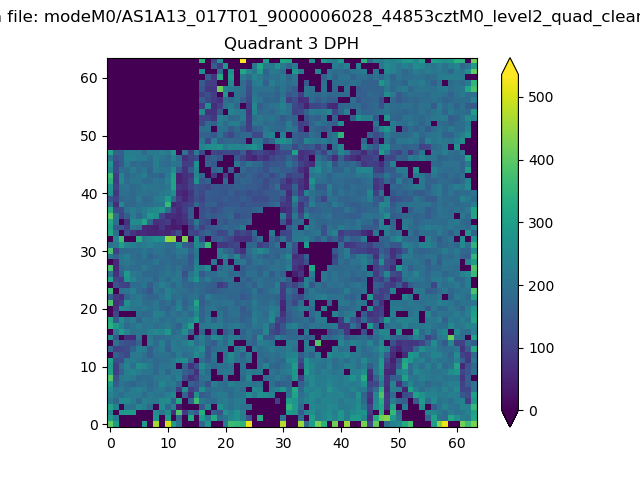 |
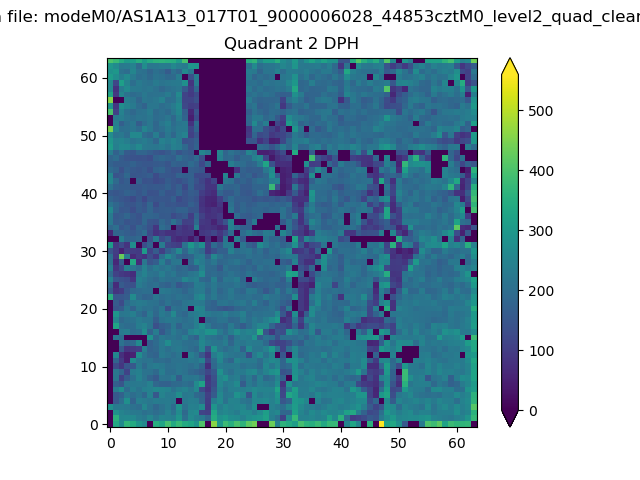 |
Quadrant C |
| Plot type | Count rate plots | Images |
|---|---|---|
| Comparison with Poisson distribution Blue bars denote a histogram of data divided into 1 sec bins. Red curve is a Poisson curve with rate = median count rate of data. |
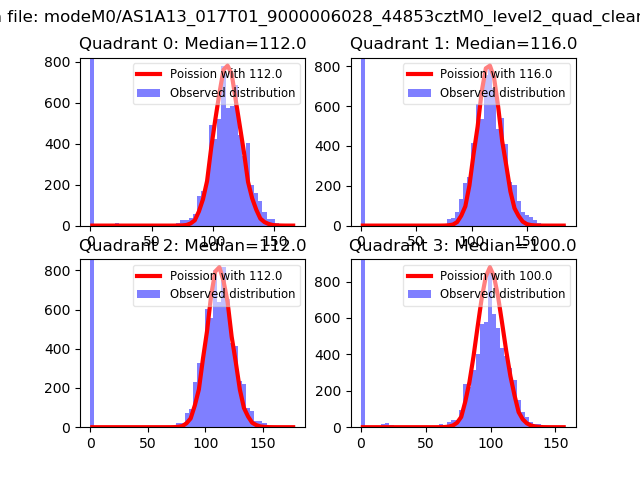 |
 |
| Quadrant-wise count rates Data is divided into 100 sec bins |
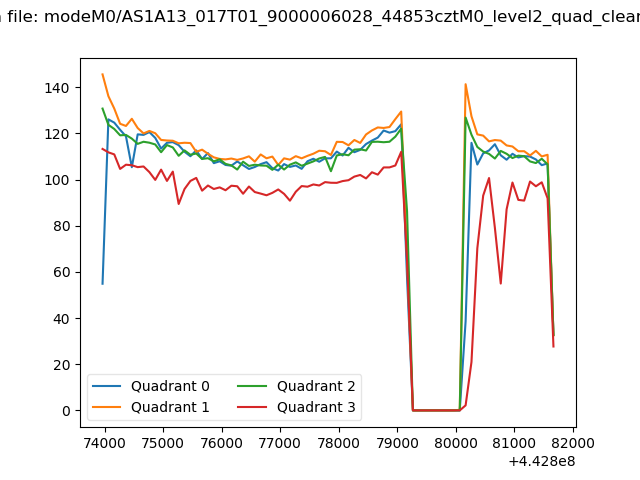 |
|
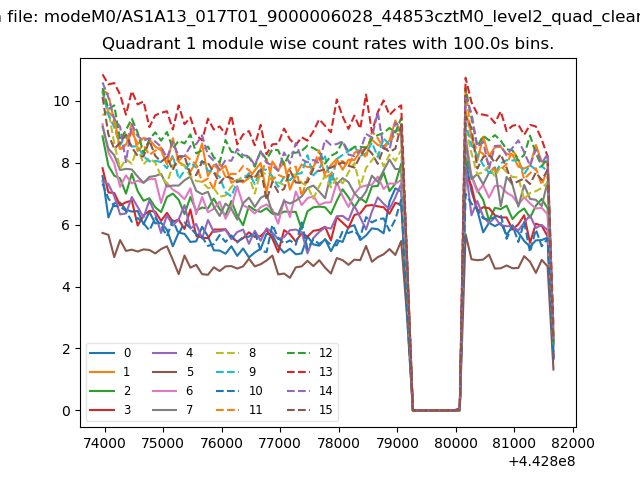
| Module-wise count rates for Quadrant A Data is divided into 100 sec bins |
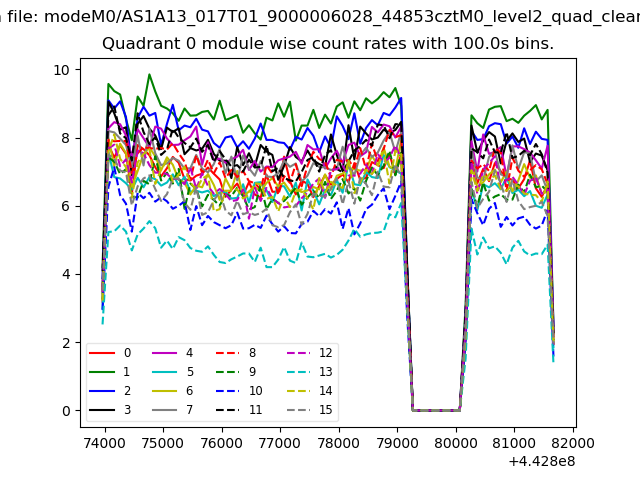 |
 |
| Module-wise count rates for Quadrant B Data is divided into 100 sec bins |
 |
 |
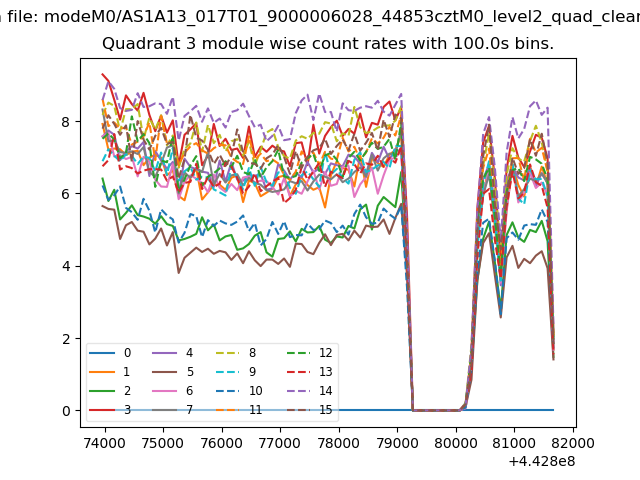
| Module-wise count rates for Quadrant C Data is divided into 100 sec bins |
 |
 |
| Module-wise count rates for Quadrant D Data is divided into 100 sec bins |
 |
 |
| Parameter | Plot |
|---|---|
| CZT HV Monitor | 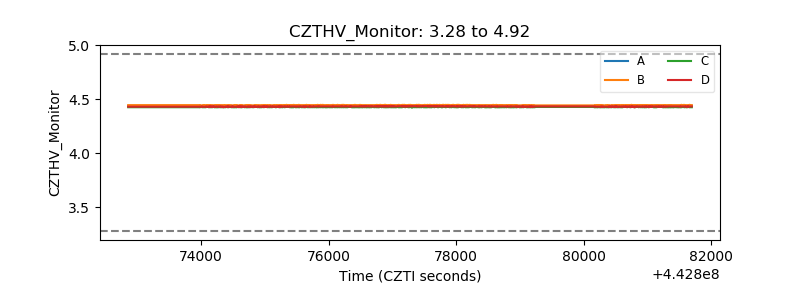 |
| D_VDD | 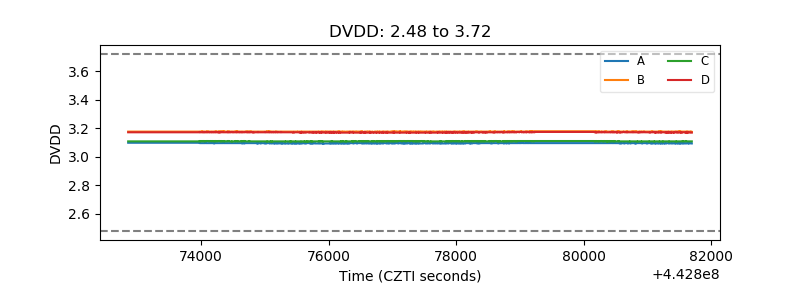 |
| Temperature 1 | 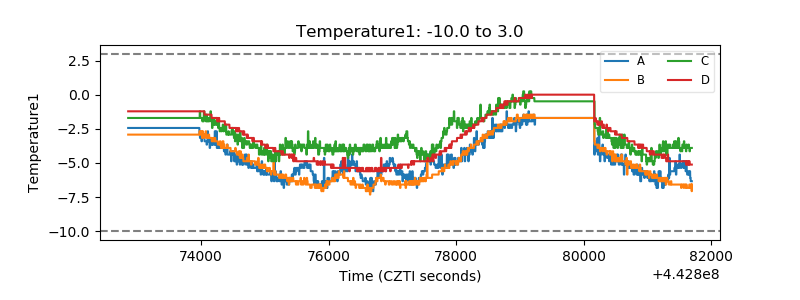 |
| Veto HV Monitor | 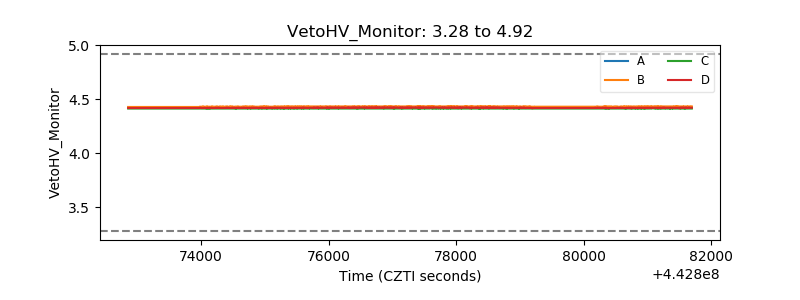 |
| Veto LLD | 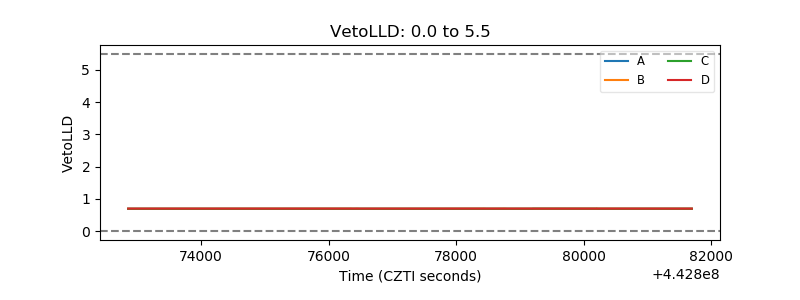 |
| Alpha Counter | 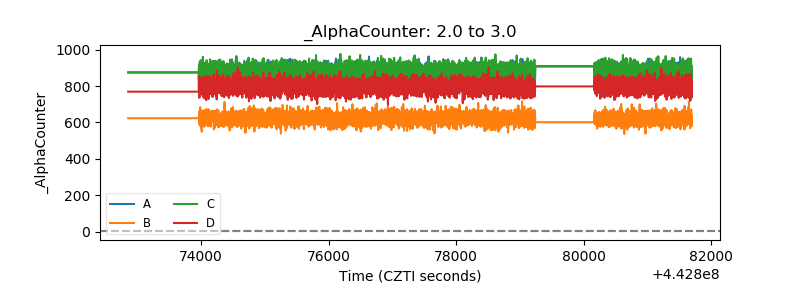 |
| _CPM_Rate | 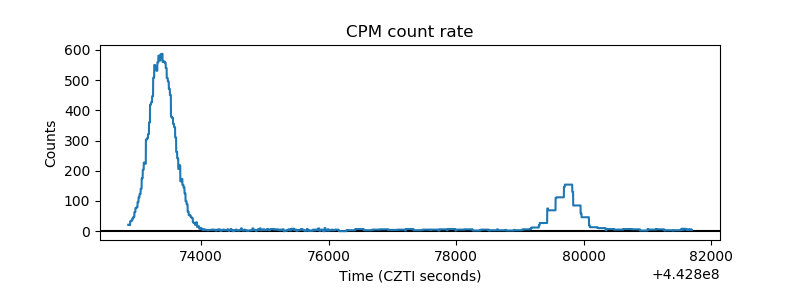 |
| CZT Counter | 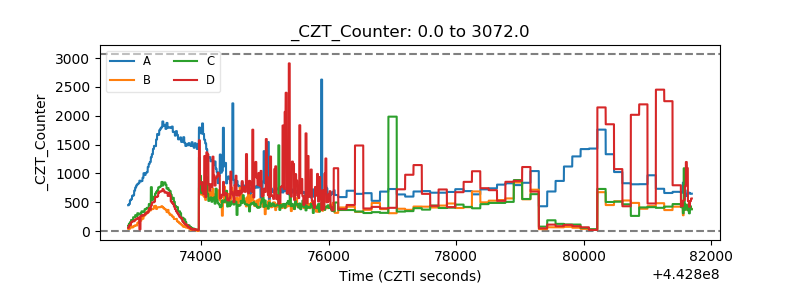 |
| +2.5 Volts monitor | 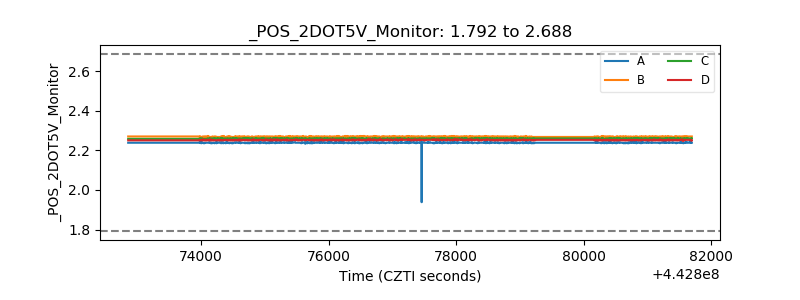 |
| +5 Volts monitor | 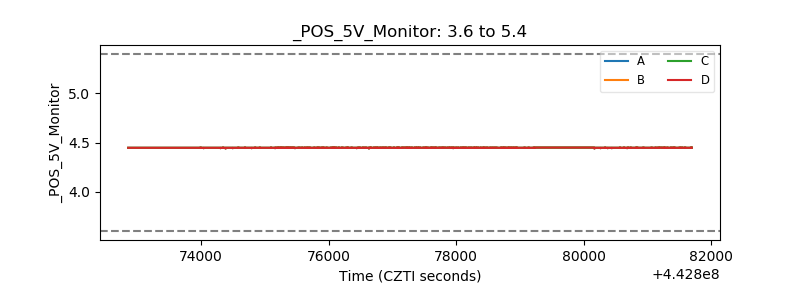 |
| _ROLL_ROT | 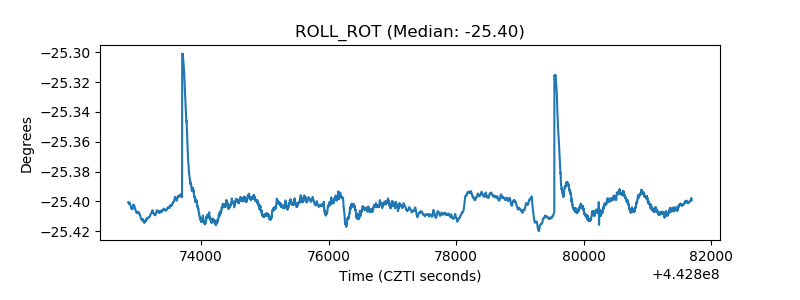 |
| _Roll_DEC | 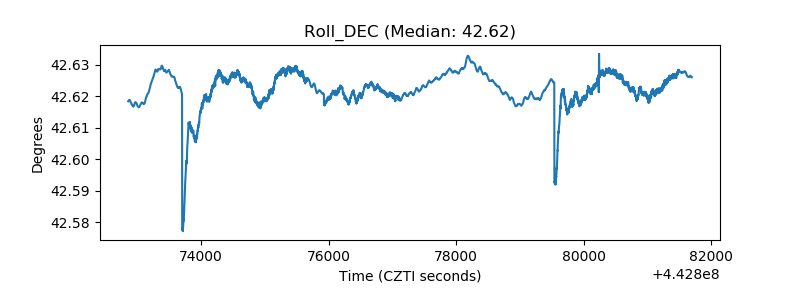 |
| _Roll_RA | 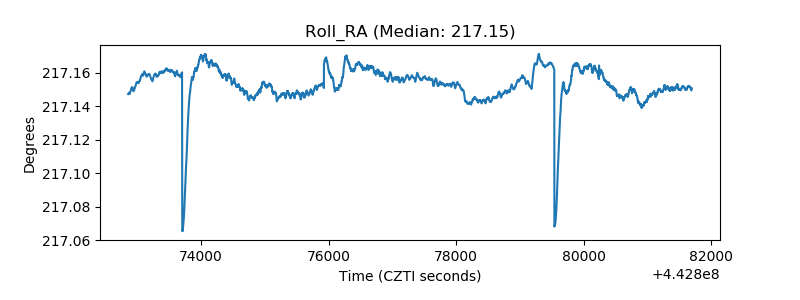 |
| Veto Counter | 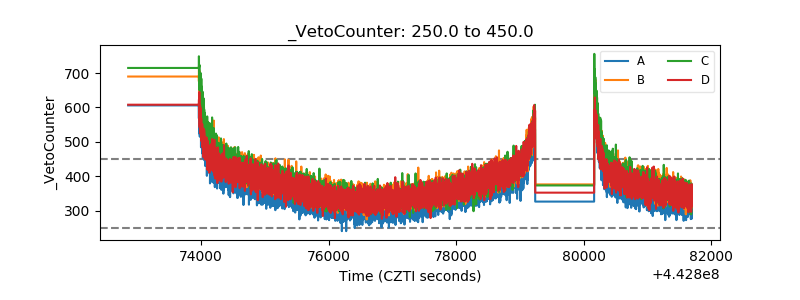 |