| Param | Original file | Final file |
|---|---|---|
| Filename | modeM0/AS1A13_017T01_9000006028_44854cztM0_level2.fits | modeM0/AS1A13_017T01_9000006028_44854cztM0_level2_quad_clean.evt |
| Size (bytes) | 550,540,800 | 116,009,280 |
| Size | 525.0 MB | 110.6 MB |
| Events in quadrant A | 5,729,005 | 774,736 |
| Events in quadrant B | 3,628,501 | 816,667 |
| Events in quadrant C | 3,341,156 | 785,351 |
| Events in quadrant D | 7,116,411 | 629,958 |
| Mode M0 | |||
|---|---|---|---|
| Quadrant | BADHDUFLAG | Total packets | Discarded packets |
| A | 0 | 23131 | 2 |
| B | 0 | 15938 | 2 |
| C | 0 | 15337 | 2 |
| D | 0 | 26192 | 2 |
| Mode SS | |||
|---|---|---|---|
| Quadrant | BADHDUFLAG | Total packets | Discarded packets |
| A | 0 | 146 | 0 |
| B | 0 | 146 | 0 |
| C | 0 | 146 | 0 |
| D | 0 | 146 | 0 |
| Mode M9 | |||
|---|---|---|---|
| Quadrant | BADHDUFLAG | Total packets | Discarded packets |
| A | 0 | 9 | 0 |
| B | 0 | 9 | 0 |
| C | 0 | 10 | 0 |
| D | 0 | 10 | 0 |
| Quadrant | Total seconds | Saturated seconds | Saturation percentage |
|---|---|---|---|
| A | 7272 | 297 | 4.084158% |
| B | 7272 | 93 | 1.278878% |
| C | 7272 | 28 | 0.385039% |
| D | 7272 | 1010 | 13.888889% |
Noise dominated data is calculated using 1-second bins in cleaned event files. If a bin has >2000 counts, and if more than 50% of those come from <1% of pixels, then it is considered to be noise-dominated and hence unusable.
| Quadrant | # 1 sec bins | Bins with >0 counts | Bins with >2000 counts | High rate bins dominated by noise | Noise dominated (total time) | Noise dominated (detector-on time) | Marked lightcurve |
|---|---|---|---|---|---|---|---|
| A | 7762 | 7273 | 78 | 78 | 1.00% | 1.07% | 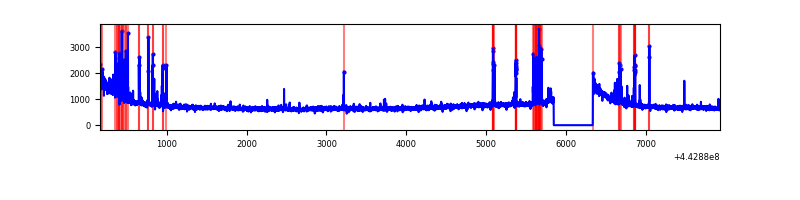 |
| B | 7762 | 7273 | 33 | 33 | 0.43% | 0.45% | 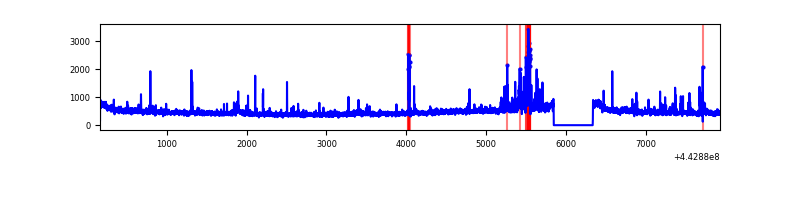 |
| C | 7762 | 7273 | 6 | 6 | 0.08% | 0.08% | 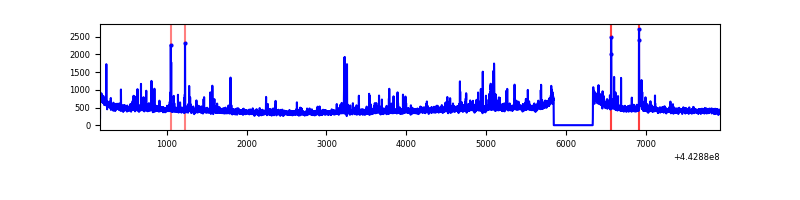 |
| D | 7762 | 7273 | 702 | 702 | 9.04% | 9.65% | 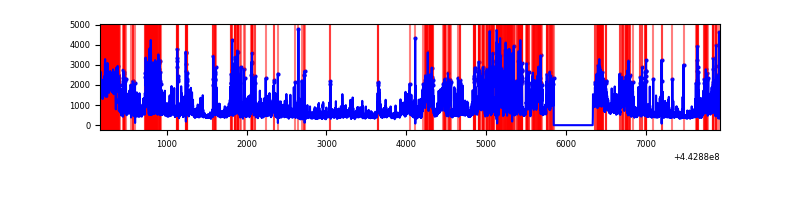 |
Top three noisy pixels from each quadrant. If the there are fewer than three noisy pixels in the level2.evt file, extra rows are filled as -1
| Pixel properties | Quadrant properties | ||||||
|---|---|---|---|---|---|---|---|
| Quadrant | DetID | PixID | Counts | Sigma | Mean | Median | Sigma |
| A | 10 | 83 | 2271760 | 13620.01 | 804 | 787 | 166.7 |
| A | 13 | 248 | 284096 | 1699.13 | 804 | 787 | 166.7 |
| A | 10 | 248 | 21843 | 126.28 | 804 | 787 | 166.7 |
| B | 4 | 170 | 120502 | 736.42 | 817 | 791 | 162.6 |
| B | 0 | 155 | 75513 | 459.66 | 817 | 791 | 162.6 |
| B | 5 | 255 | 59256 | 359.65 | 817 | 791 | 162.6 |
| C | 12 | 2 | 88320 | 464.11 | 805 | 809 | 188.6 |
| C | 12 | 250 | 55707 | 291.15 | 805 | 809 | 188.6 |
| C | 1 | 3 | 33833 | 175.14 | 805 | 809 | 188.6 |
| D | 13 | 174 | 1390425 | 7373.23 | 750 | 726 | 188.5 |
| D | 13 | 249 | 888375 | 4709.54 | 750 | 726 | 188.5 |
| D | 5 | 222 | 495914 | 2627.29 | 750 | 726 | 188.5 |
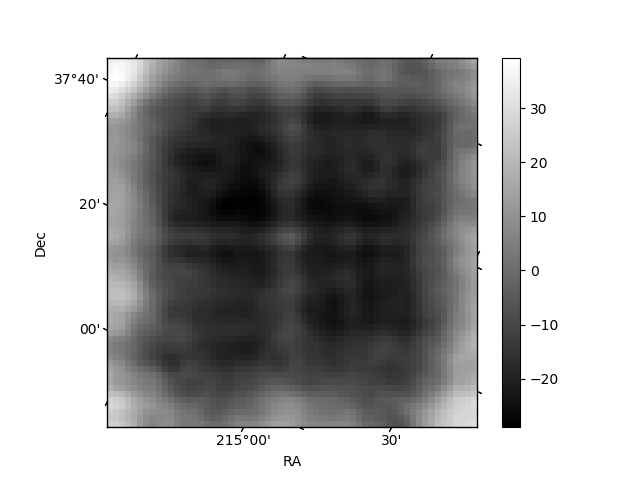
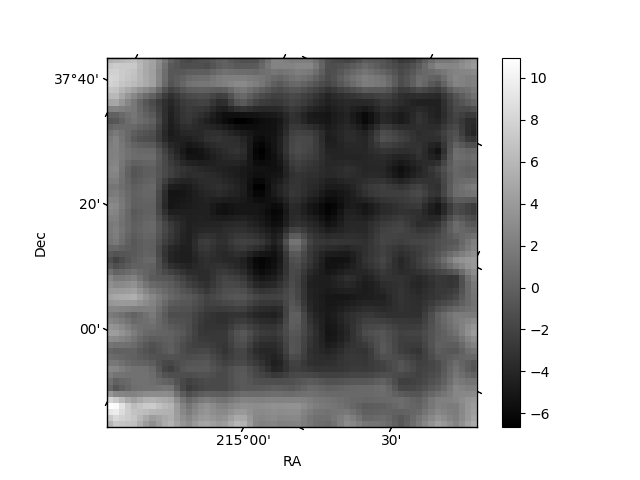
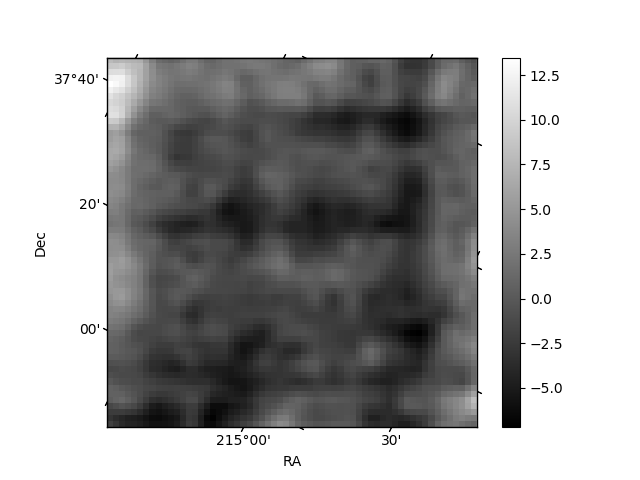
Histogram calculated using DETX and DETY for each event in the final _common_clean file
| Quadrant A | 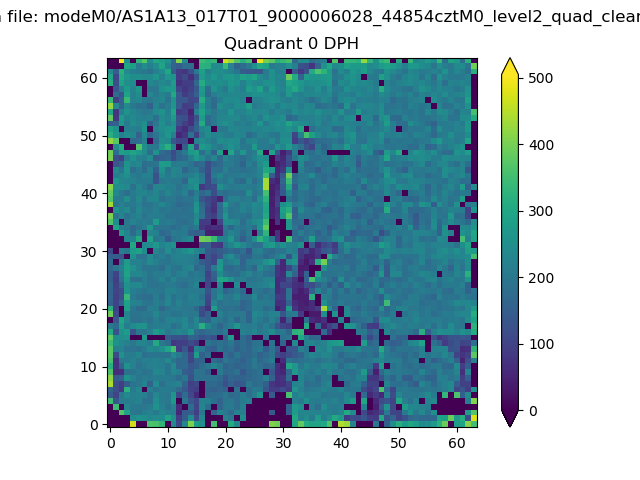 |
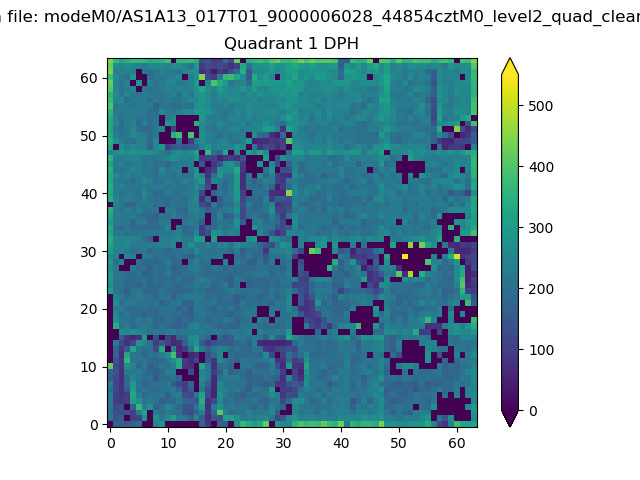 |
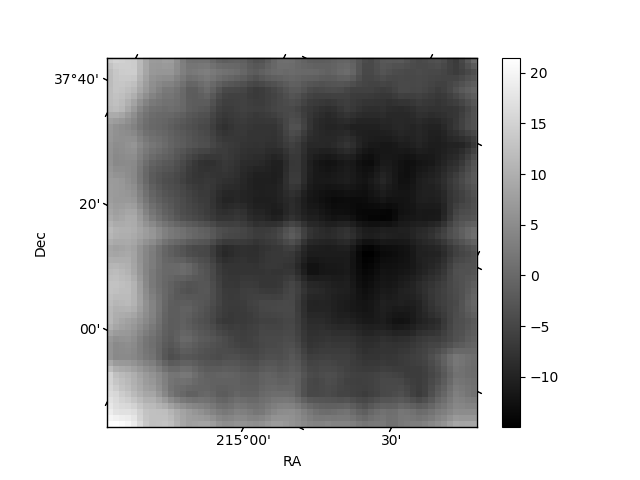
Quadrant B |
|---|---|---|---|
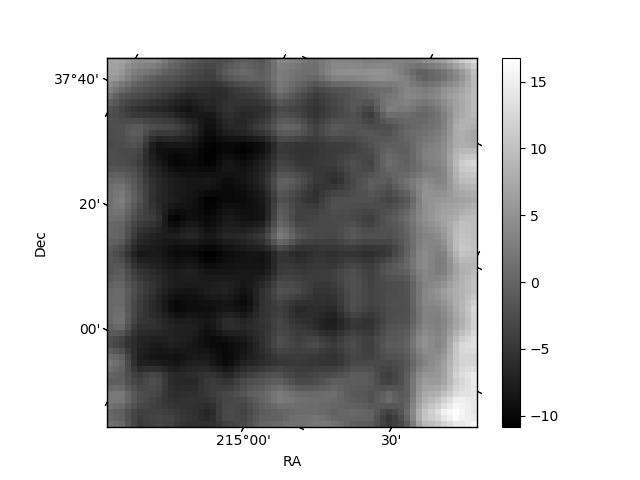
| Quadrant D | 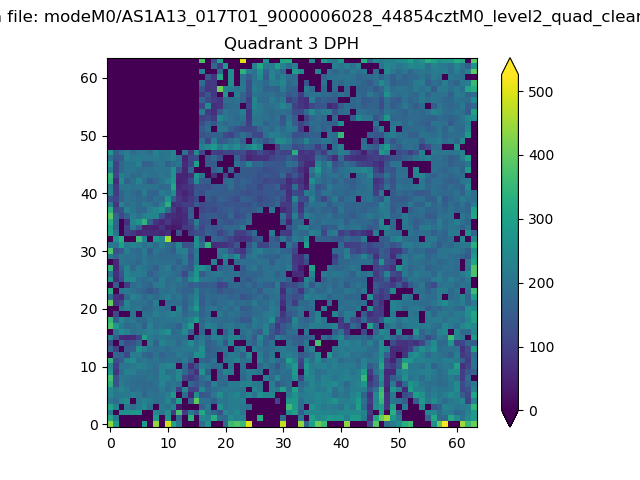 |
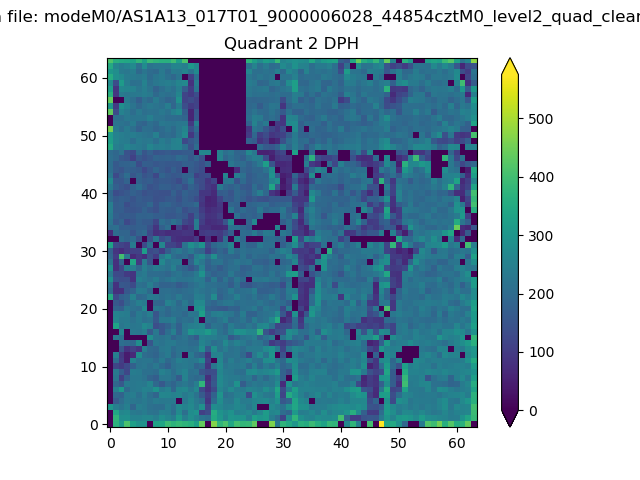 |
Quadrant C |
| Plot type | Count rate plots | Images |
|---|---|---|
| Comparison with Poisson distribution Blue bars denote a histogram of data divided into 1 sec bins. Red curve is a Poisson curve with rate = median count rate of data. |
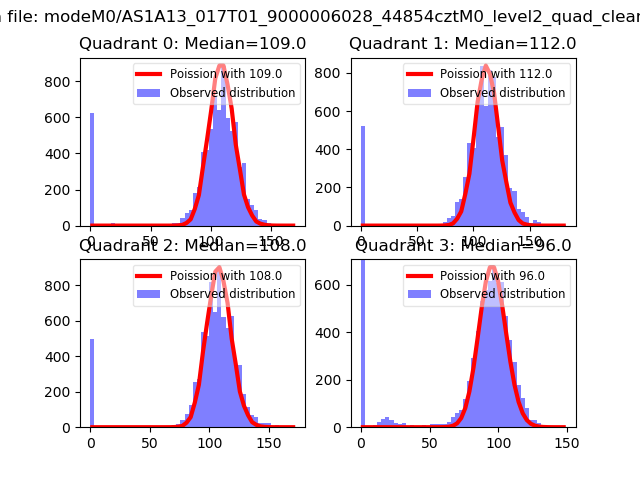 |
 |
| Quadrant-wise count rates Data is divided into 100 sec bins |
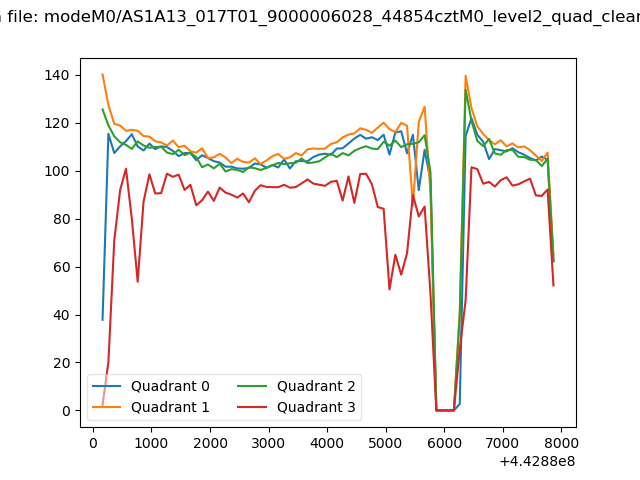 |
|
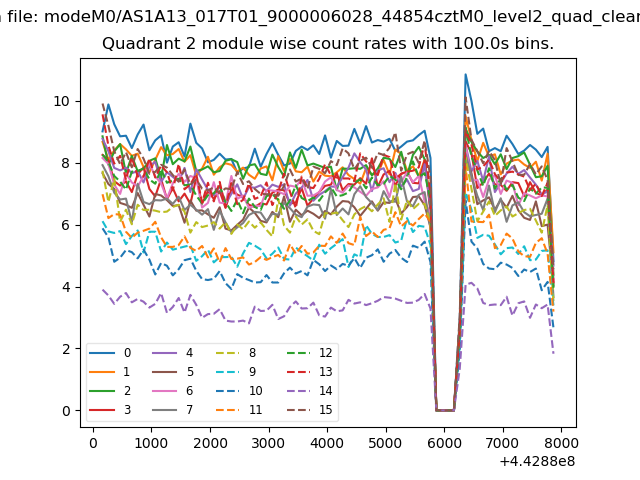
| Module-wise count rates for Quadrant A Data is divided into 100 sec bins |
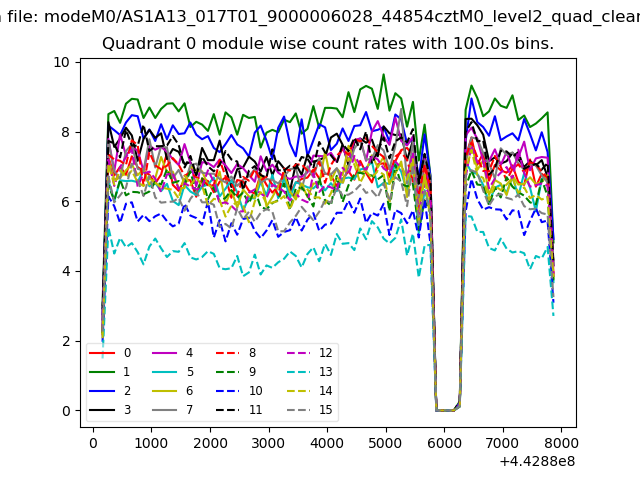 |
 |
| Module-wise count rates for Quadrant B Data is divided into 100 sec bins |
 |
 |
| Module-wise count rates for Quadrant C Data is divided into 100 sec bins |
 |
 |
| Module-wise count rates for Quadrant D Data is divided into 100 sec bins |
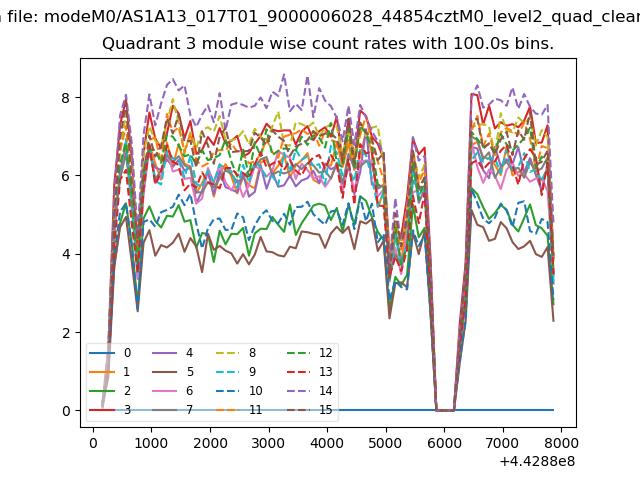 |
 |
| Parameter | Plot |
|---|---|
| CZT HV Monitor |  |
| D_VDD | 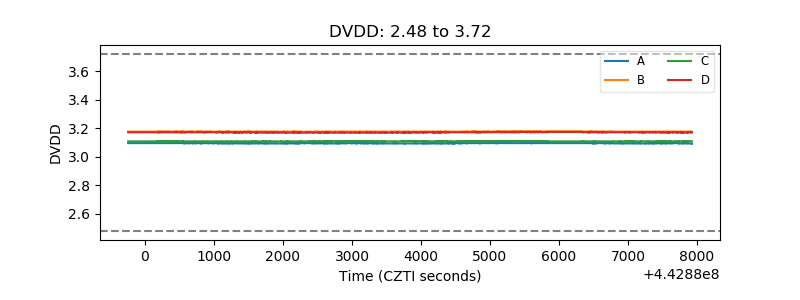 |
| Temperature 1 | 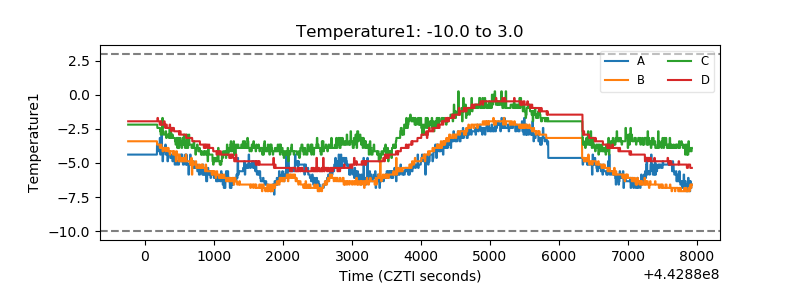 |
| Veto HV Monitor | 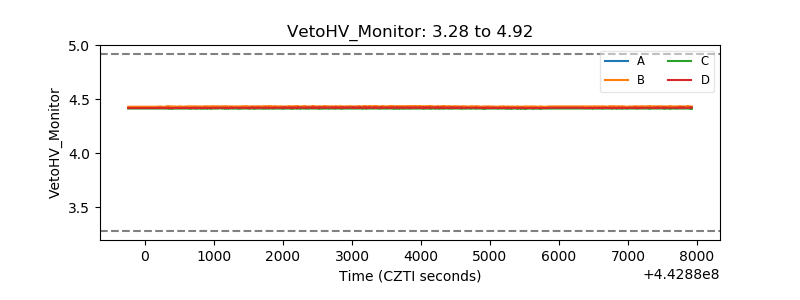 |
| Veto LLD | 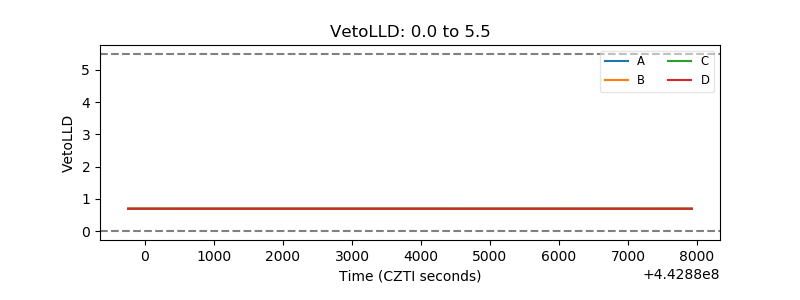 |
| Alpha Counter | 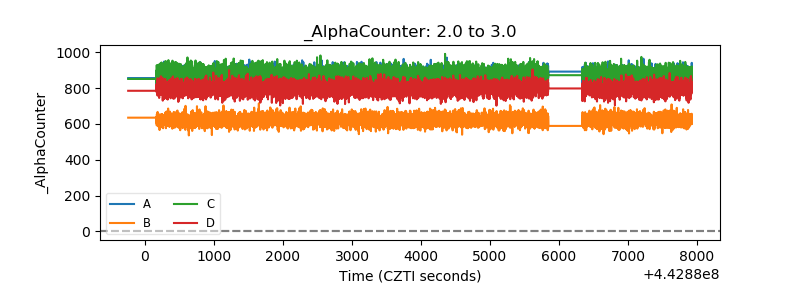 |
| _CPM_Rate | 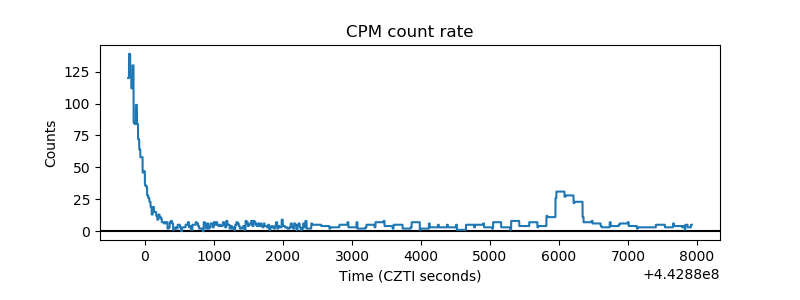 |
| CZT Counter | 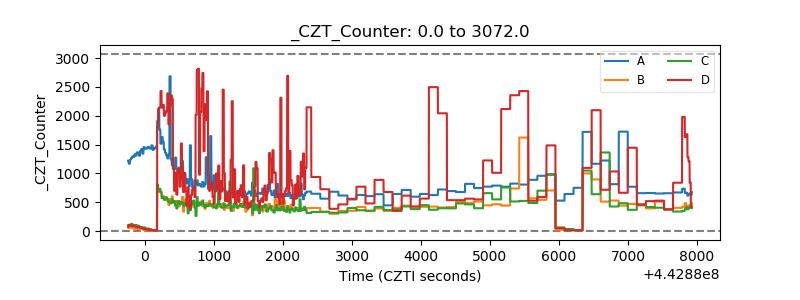 |
| +2.5 Volts monitor | 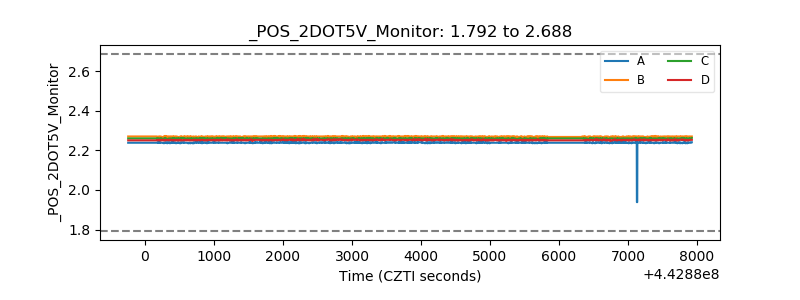 |
| +5 Volts monitor | 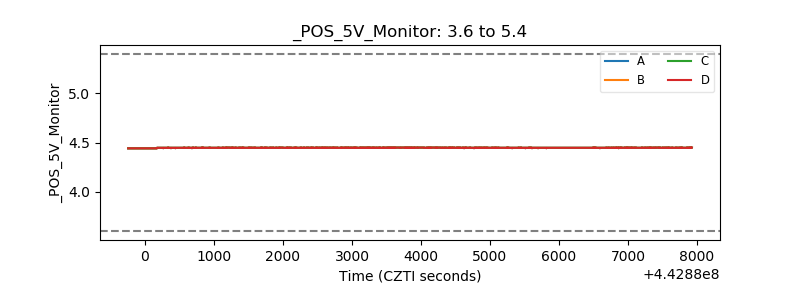 |
| _ROLL_ROT | 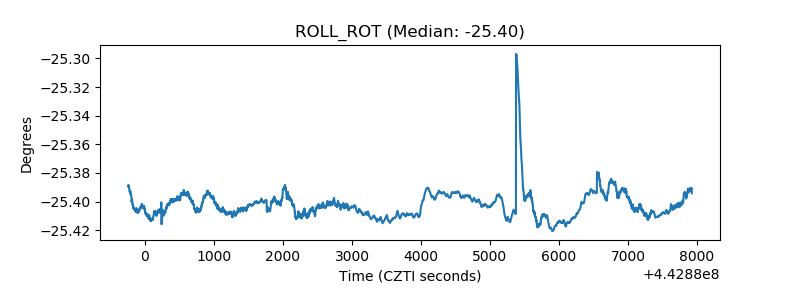 |
| _Roll_DEC | 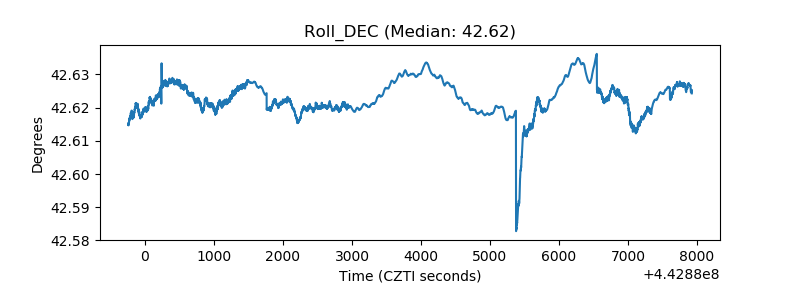 |
| _Roll_RA | 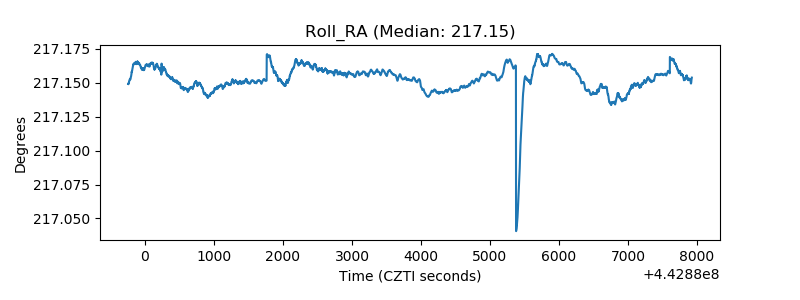 |
| Veto Counter | 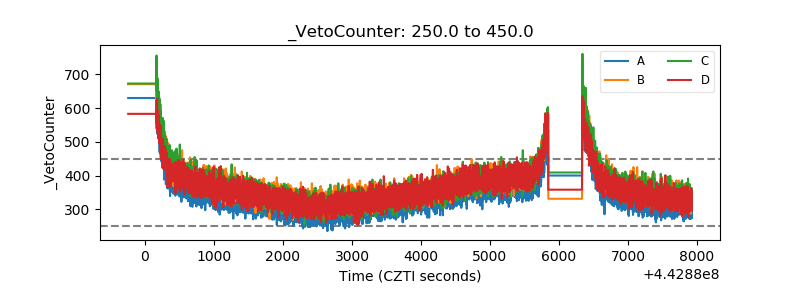 |