| Param | Original file | Final file |
|---|---|---|
| Filename | modeM0/AS1A13_017T01_9000006028_44855cztM0_level2.fits | modeM0/AS1A13_017T01_9000006028_44855cztM0_level2_quad_clean.evt |
| Size (bytes) | 572,051,520 | 128,566,080 |
| Size | 545.6 MB | 122.6 MB |
| Events in quadrant A | 6,006,438 | 861,585 |
| Events in quadrant B | 3,928,641 | 893,661 |
| Events in quadrant C | 3,866,450 | 854,404 |
| Events in quadrant D | 6,752,087 | 725,807 |
| Mode M0 | |||
|---|---|---|---|
| Quadrant | BADHDUFLAG | Total packets | Discarded packets |
| A | 0 | 24662 | 1 |
| B | 0 | 17432 | 2 |
| C | 0 | 17561 | 1 |
| D | 0 | 25899 | 1 |
| Mode SS | |||
|---|---|---|---|
| Quadrant | BADHDUFLAG | Total packets | Discarded packets |
| A | 0 | 162 | 0 |
| B | 0 | 162 | 0 |
| C | 0 | 162 | 0 |
| D | 0 | 162 | 0 |
| Mode M9 | |||
|---|---|---|---|
| Quadrant | BADHDUFLAG | Total packets | Discarded packets |
| A | 0 | 5 | 0 |
| B | 0 | 5 | 0 |
| C | 0 | 5 | 0 |
| D | 0 | 5 | 0 |
| Quadrant | Total seconds | Saturated seconds | Saturation percentage |
|---|---|---|---|
| A | 8018 | 192 | 2.394612% |
| B | 8018 | 95 | 1.184834% |
| C | 8019 | 50 | 0.623519% |
| D | 8019 | 762 | 9.502432% |
Noise dominated data is calculated using 1-second bins in cleaned event files. If a bin has >2000 counts, and if more than 50% of those come from <1% of pixels, then it is considered to be noise-dominated and hence unusable.
| Quadrant | # 1 sec bins | Bins with >0 counts | Bins with >2000 counts | High rate bins dominated by noise | Noise dominated (total time) | Noise dominated (detector-on time) | Marked lightcurve |
|---|---|---|---|---|---|---|---|
| A | 8508 | 8019 | 24 | 24 | 0.28% | 0.30% | 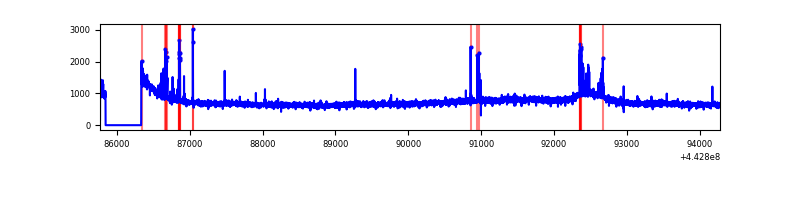 |
| B | 8509 | 8020 | 27 | 27 | 0.32% | 0.34% | 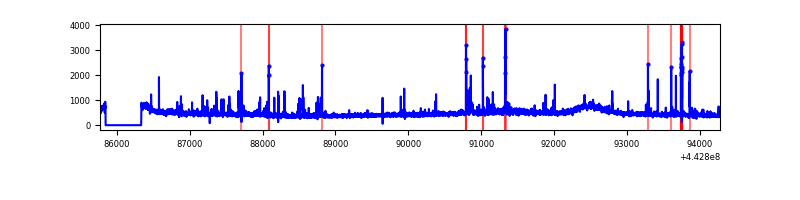 |
| C | 8509 | 8020 | 32 | 32 | 0.38% | 0.40% | 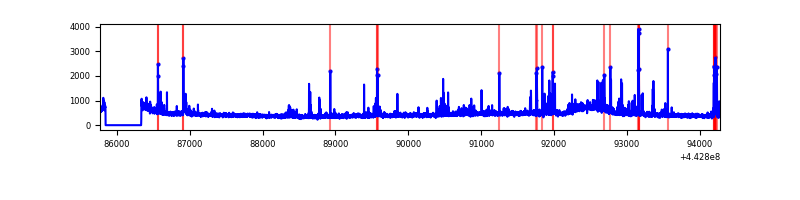 |
| D | 8509 | 8020 | 449 | 449 | 5.28% | 5.60% |  |
Top three noisy pixels from each quadrant. If the there are fewer than three noisy pixels in the level2.evt file, extra rows are filled as -1
| Pixel properties | Quadrant properties | ||||||
|---|---|---|---|---|---|---|---|
| Quadrant | DetID | PixID | Counts | Sigma | Mean | Median | Sigma |
| A | 10 | 83 | 2350287 | 12480.65 | 903 | 884 | 188.2 |
| A | 13 | 248 | 145745 | 769.54 | 903 | 884 | 188.2 |
| A | 7 | 191 | 11265 | 55.15 | 903 | 884 | 188.2 |
| B | 5 | 255 | 122450 | 678.88 | 909 | 882 | 179.1 |
| B | 4 | 170 | 49477 | 271.37 | 909 | 882 | 179.1 |
| B | 0 | 155 | 35993 | 196.07 | 909 | 882 | 179.1 |
| C | 1 | 3 | 176958 | 827.41 | 894 | 897 | 212.8 |
| C | 12 | 250 | 108196 | 504.26 | 894 | 897 | 212.8 |
| C | 12 | 2 | 67362 | 312.36 | 894 | 897 | 212.8 |
| D | 1 | 52 | 797612 | 3704.7 | 854 | 826 | 215.1 |
| D | 13 | 174 | 614114 | 2851.51 | 854 | 826 | 215.1 |
| D | 5 | 222 | 493380 | 2290.15 | 854 | 826 | 215.1 |
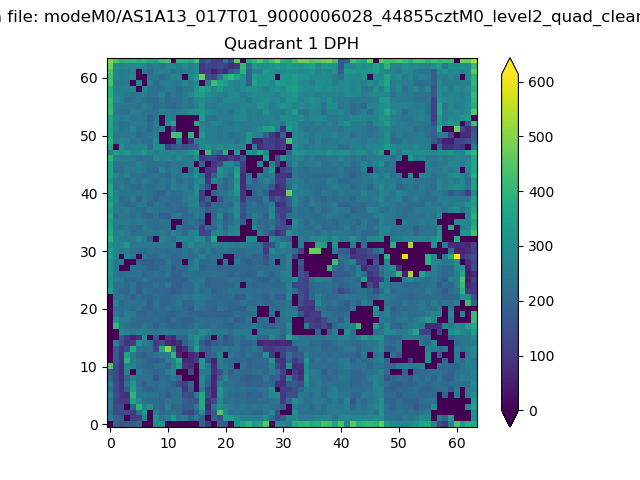
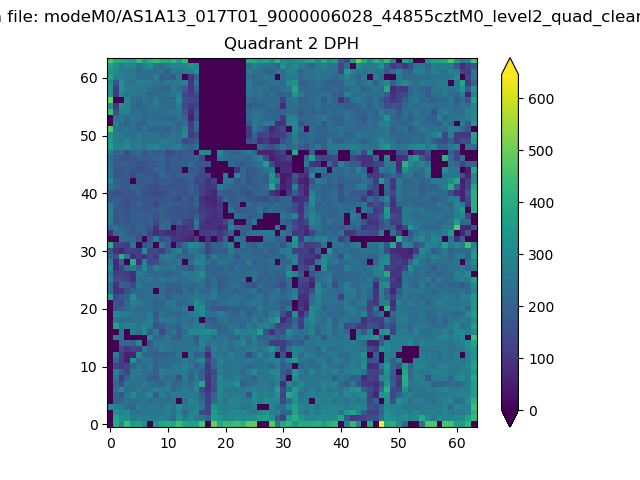
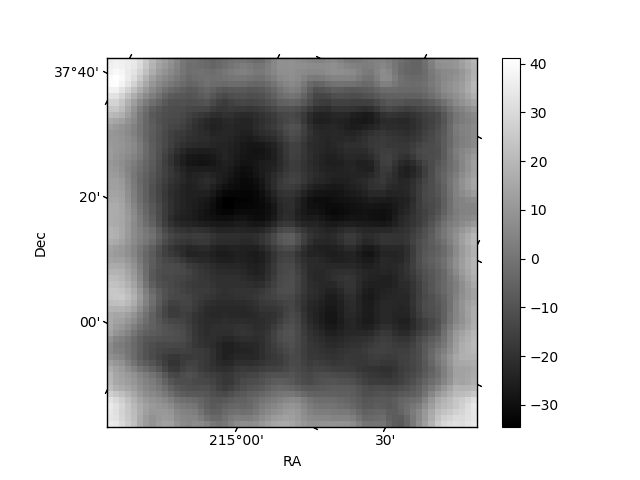
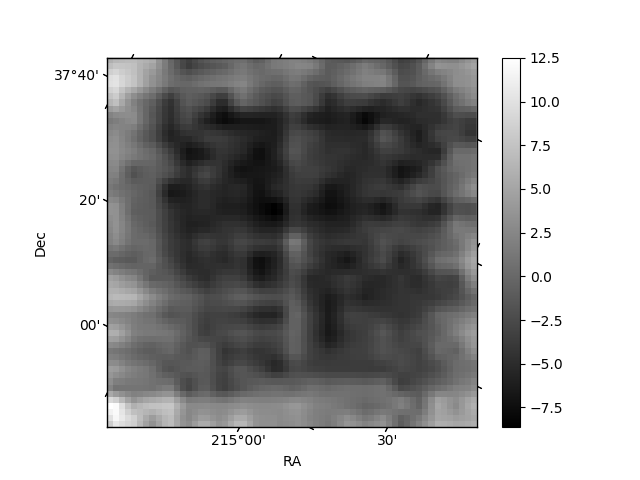
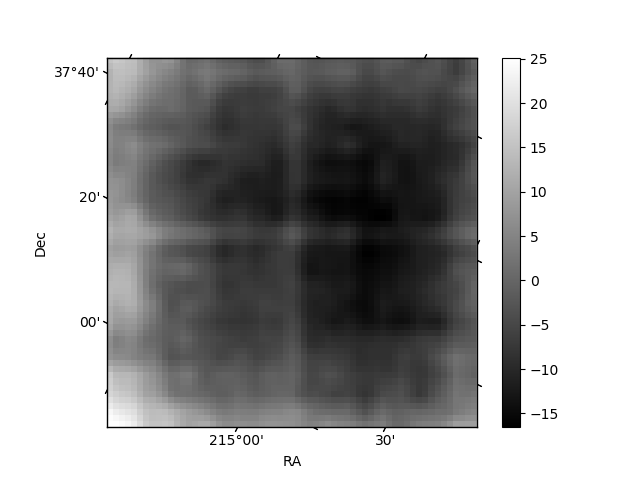
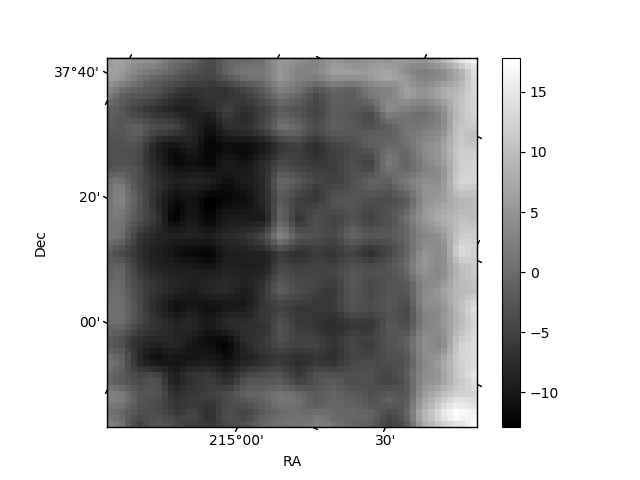
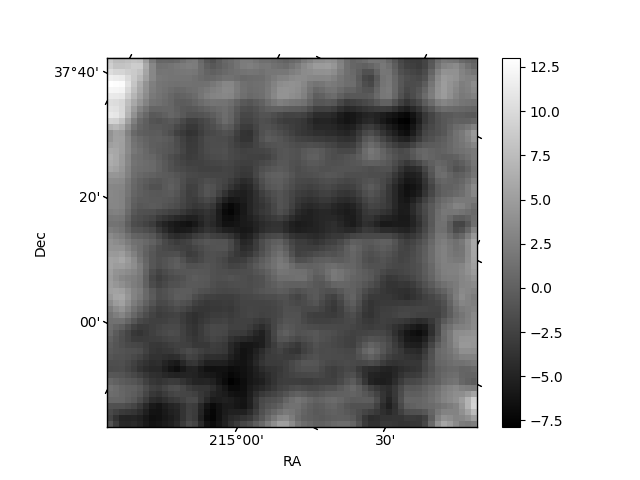
Histogram calculated using DETX and DETY for each event in the final _common_clean file
| Quadrant A | 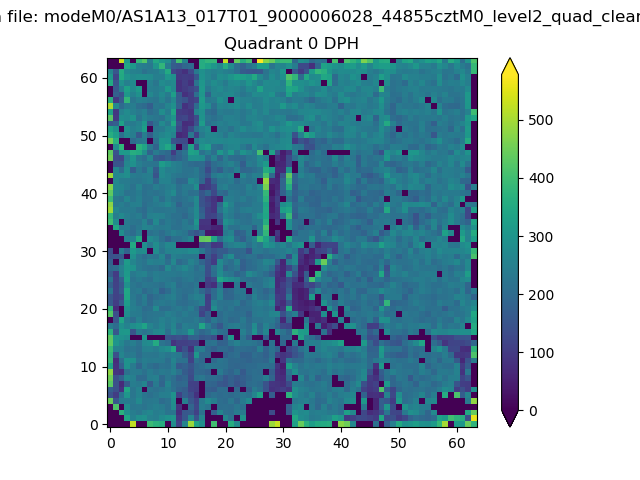 |
 |
Quadrant B |
|---|---|---|---|
| Quadrant D | 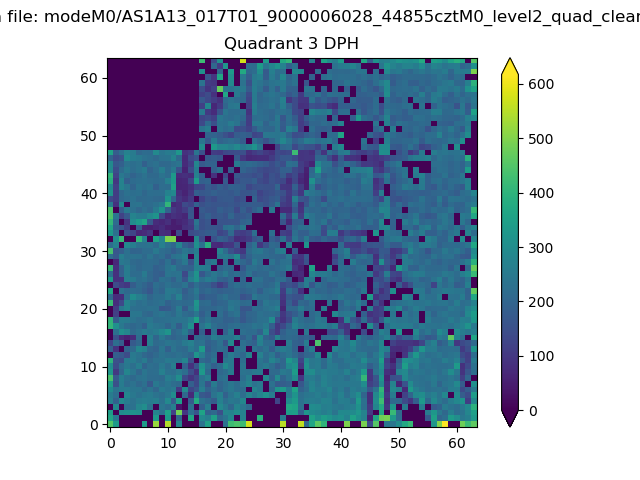 |
 |
Quadrant C |
| Plot type | Count rate plots | Images |
|---|---|---|
| Comparison with Poisson distribution Blue bars denote a histogram of data divided into 1 sec bins. Red curve is a Poisson curve with rate = median count rate of data. |
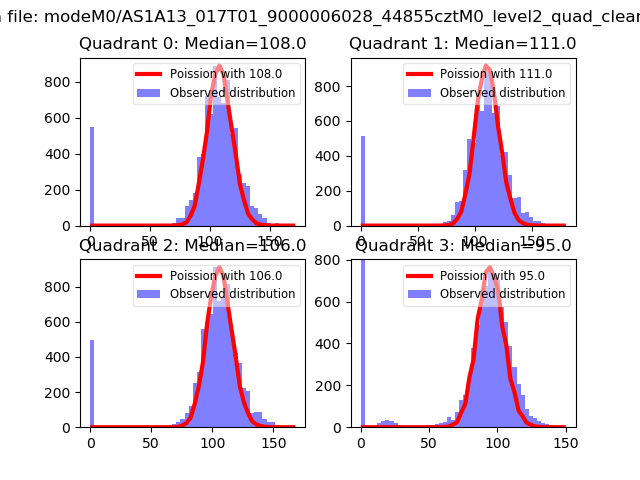 |
 |
| Quadrant-wise count rates Data is divided into 100 sec bins |
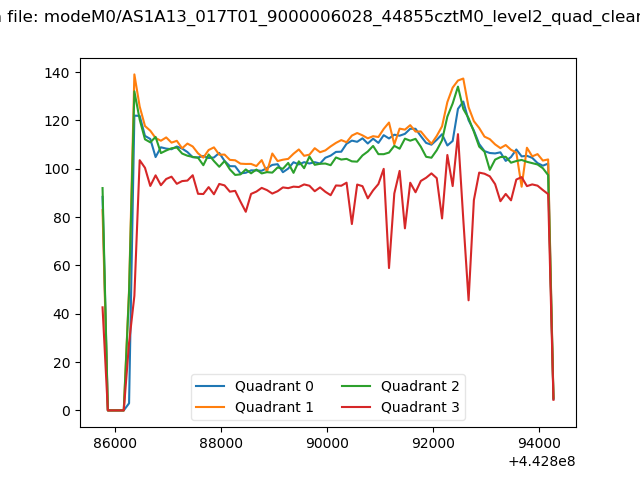 |
|
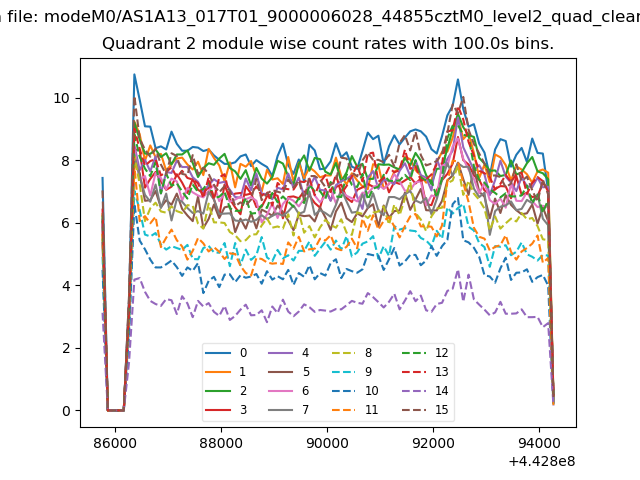
| Module-wise count rates for Quadrant A Data is divided into 100 sec bins |
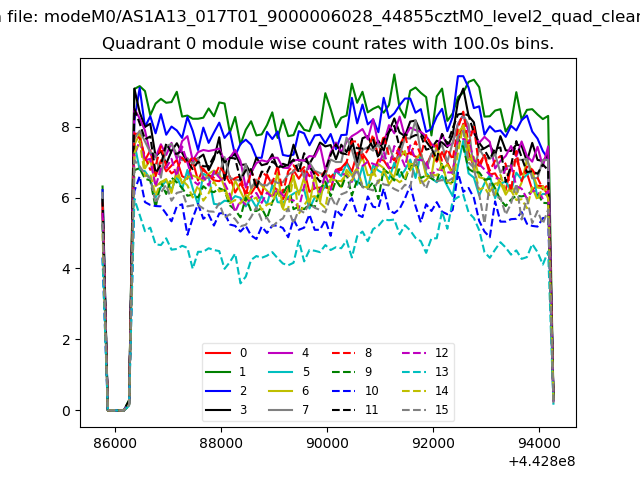 |
 |
| Module-wise count rates for Quadrant B Data is divided into 100 sec bins |
 |
 |
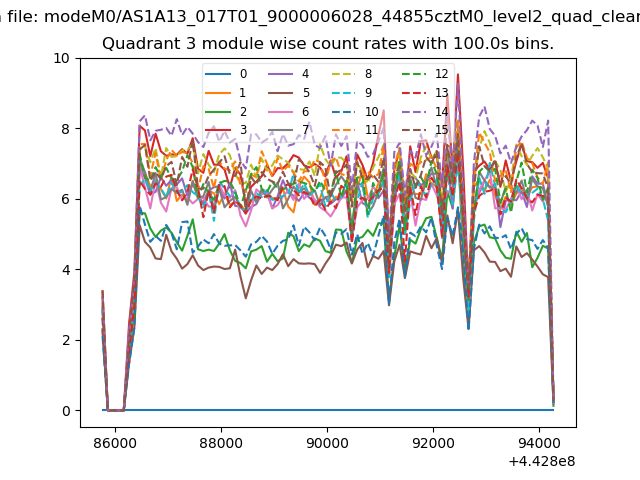
| Module-wise count rates for Quadrant C Data is divided into 100 sec bins |
 |
 |
| Module-wise count rates for Quadrant D Data is divided into 100 sec bins |
 |
 |
| Parameter | Plot |
|---|---|
| CZT HV Monitor |  |
| D_VDD | 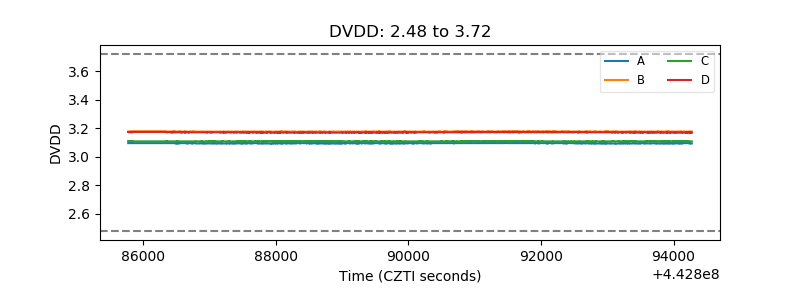 |
| Temperature 1 | 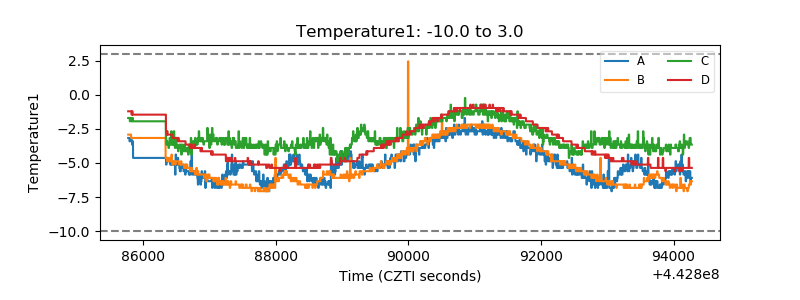 |
| Veto HV Monitor | 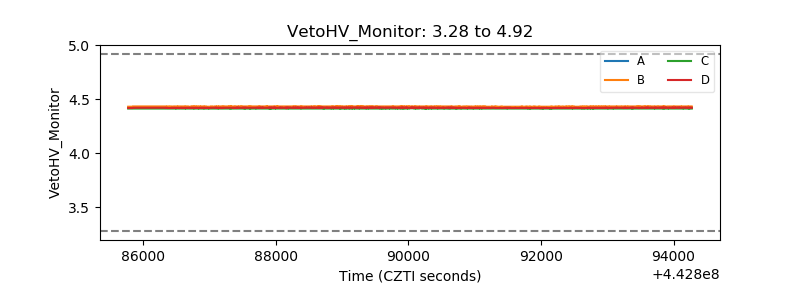 |
| Veto LLD | 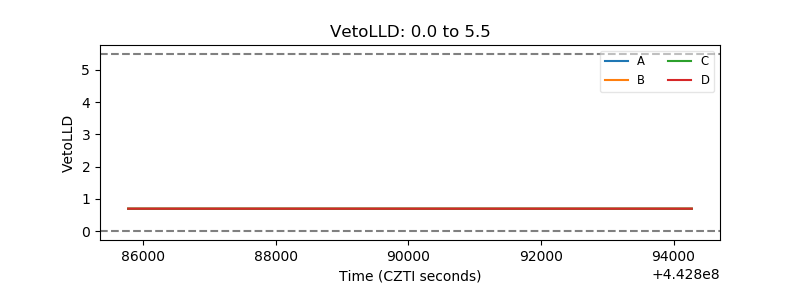 |
| Alpha Counter | 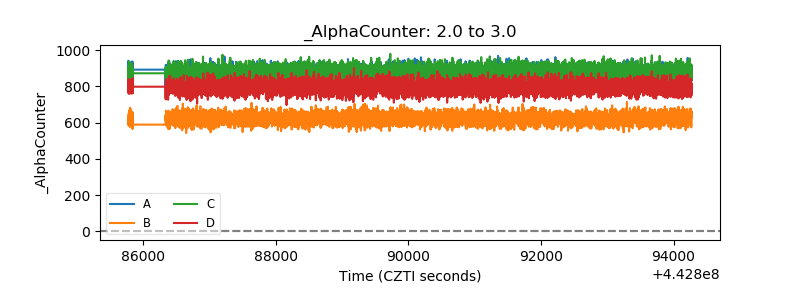 |
| _CPM_Rate | 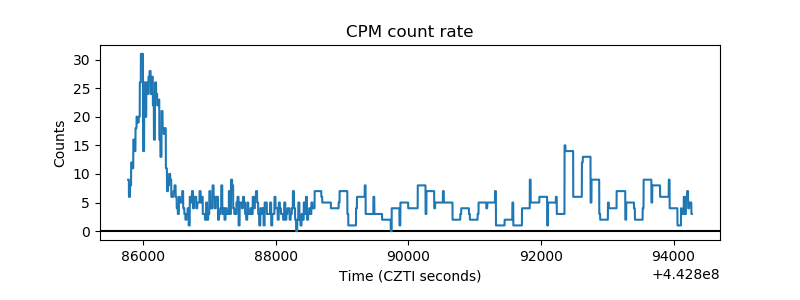 |
| CZT Counter | 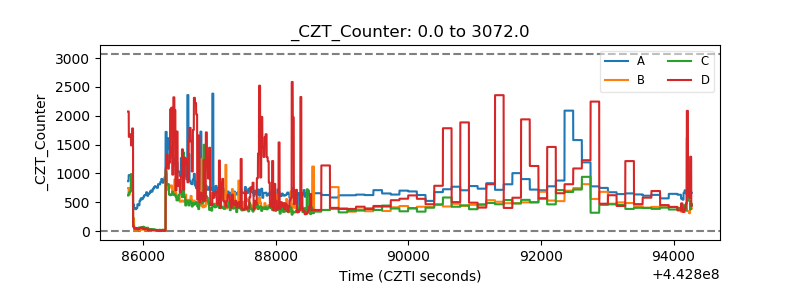 |
| +2.5 Volts monitor | 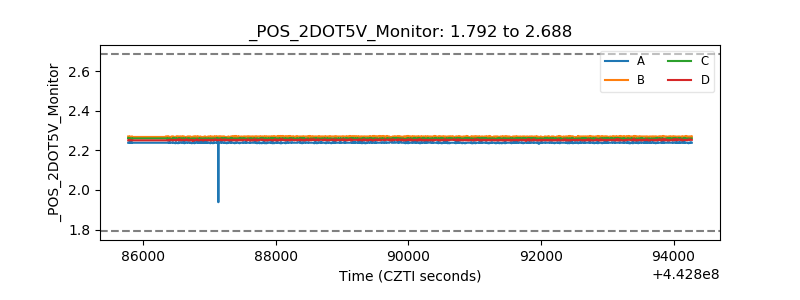 |
| +5 Volts monitor | 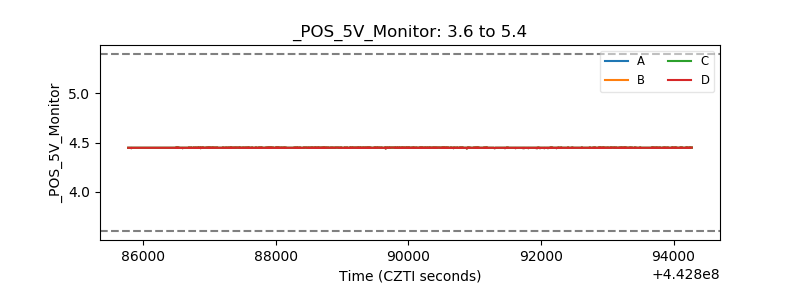 |
| _ROLL_ROT | 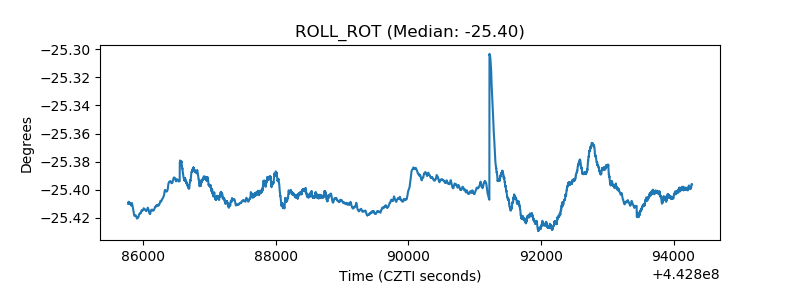 |
| _Roll_DEC | 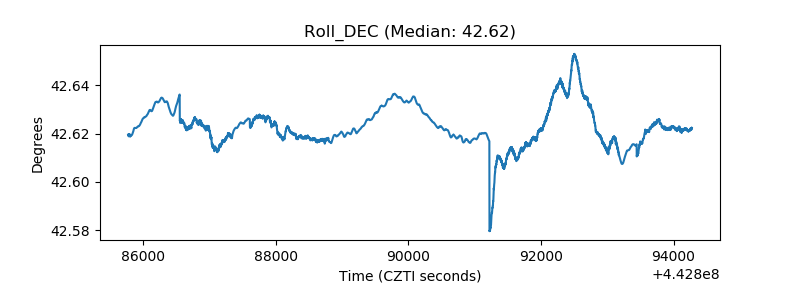 |
| _Roll_RA | 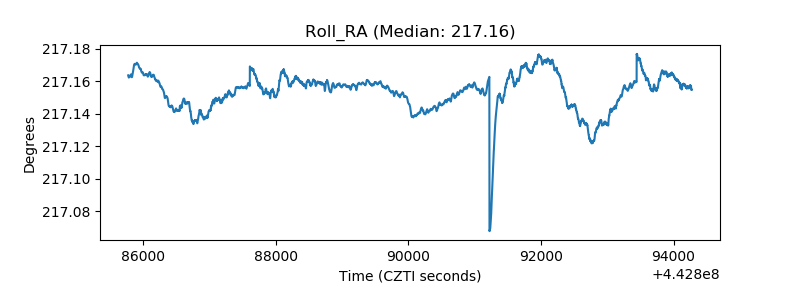 |
| Veto Counter | 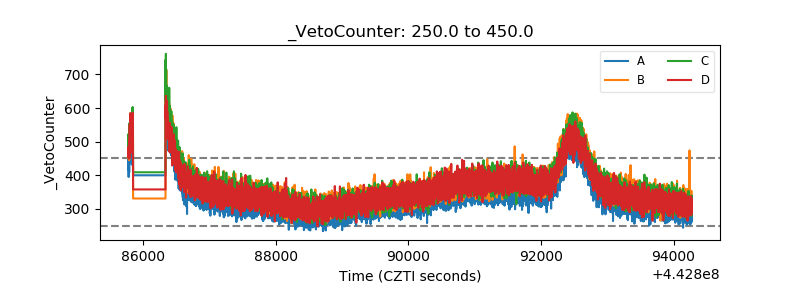 |