| Param | Original file | Final file |
|---|---|---|
| Filename | modeM0/AS1A13_017T01_9000006028_44857cztM0_level2.fits | modeM0/AS1A13_017T01_9000006028_44857cztM0_level2_quad_clean.evt |
| Size (bytes) | 497,522,880 | 120,951,360 |
| Size | 474.5 MB | 115.3 MB |
| Events in quadrant A | 5,491,698 | 797,440 |
| Events in quadrant B | 3,617,299 | 824,622 |
| Events in quadrant C | 3,605,471 | 796,145 |
| Events in quadrant D | 5,119,051 | 721,559 |
| Mode M0 | |||
|---|---|---|---|
| Quadrant | BADHDUFLAG | Total packets | Discarded packets |
| A | 0 | 22795 | 0 |
| B | 0 | 16245 | 0 |
| C | 0 | 16349 | 0 |
| D | 0 | 20429 | 0 |
| Mode SS | |||
|---|---|---|---|
| Quadrant | BADHDUFLAG | Total packets | Discarded packets |
| A | 0 | 150 | 0 |
| B | 0 | 150 | 0 |
| C | 0 | 150 | 0 |
| D | 0 | 150 | 0 |
| Quadrant | Total seconds | Saturated seconds | Saturation percentage |
|---|---|---|---|
| A | 7510 | 192 | 2.556591% |
| B | 7509 | 210 | 2.796644% |
| C | 7509 | 57 | 0.759089% |
| D | 7509 | 221 | 2.943135% |
Noise dominated data is calculated using 1-second bins in cleaned event files. If a bin has >2000 counts, and if more than 50% of those come from <1% of pixels, then it is considered to be noise-dominated and hence unusable.
| Quadrant | # 1 sec bins | Bins with >0 counts | Bins with >2000 counts | High rate bins dominated by noise | Noise dominated (total time) | Noise dominated (detector-on time) | Marked lightcurve |
|---|---|---|---|---|---|---|---|
| A | 7510 | 7510 | 14 | 14 | 0.19% | 0.19% | 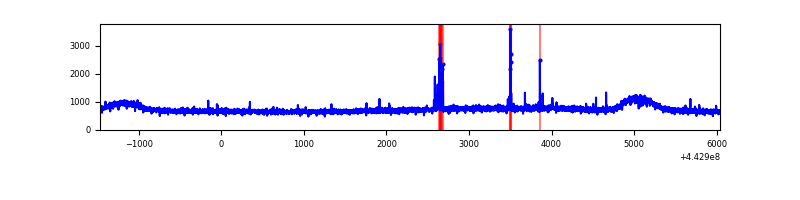 |
| B | 7509 | 7509 | 11 | 11 | 0.15% | 0.15% | 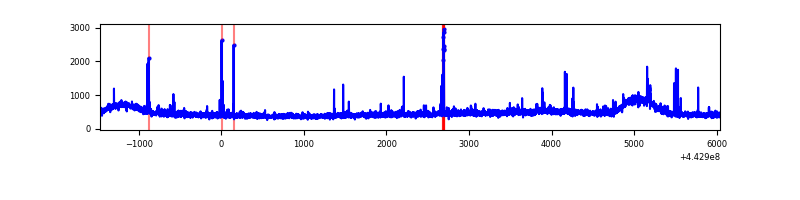 |
| C | 7509 | 7509 | 17 | 17 | 0.23% | 0.23% | 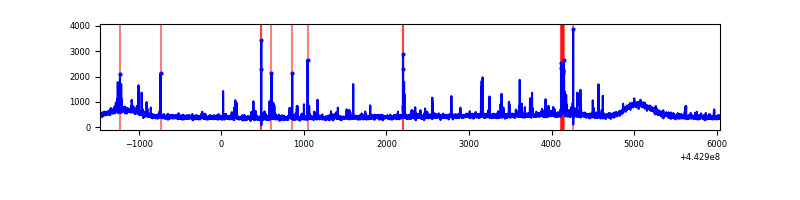 |
| D | 7509 | 7509 | 153 | 153 | 2.04% | 2.04% | 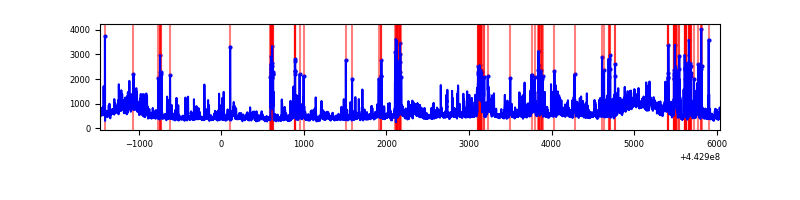 |
Top three noisy pixels from each quadrant. If the there are fewer than three noisy pixels in the level2.evt file, extra rows are filled as -1
| Pixel properties | Quadrant properties | ||||||
|---|---|---|---|---|---|---|---|
| Quadrant | DetID | PixID | Counts | Sigma | Mean | Median | Sigma |
| A | 10 | 83 | 2049979 | 11146.88 | 871 | 850 | 183.8 |
| A | 13 | 248 | 63367 | 340.08 | 871 | 850 | 183.8 |
| A | 3 | 137 | 10696 | 53.56 | 871 | 850 | 183.8 |
| B | 5 | 255 | 61391 | 346.0 | 869 | 840 | 175.0 |
| B | 5 | 172 | 29304 | 162.65 | 869 | 840 | 175.0 |
| B | 0 | 190 | 24627 | 135.92 | 869 | 840 | 175.0 |
| C | 1 | 3 | 118186 | 572.72 | 856 | 861 | 204.9 |
| C | 12 | 250 | 72635 | 350.36 | 856 | 861 | 204.9 |
| C | 14 | 254 | 35297 | 168.1 | 856 | 861 | 204.9 |
| D | 13 | 174 | 587377 | 2735.01 | 845 | 817 | 214.5 |
| D | 5 | 235 | 332841 | 1548.16 | 845 | 817 | 214.5 |
| D | 1 | 52 | 229931 | 1068.31 | 845 | 817 | 214.5 |
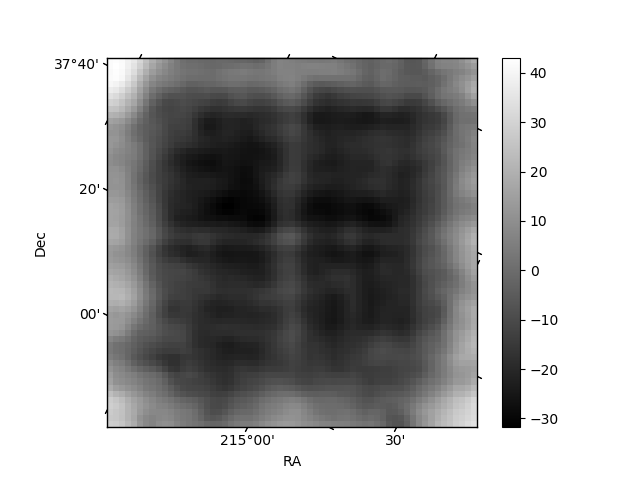
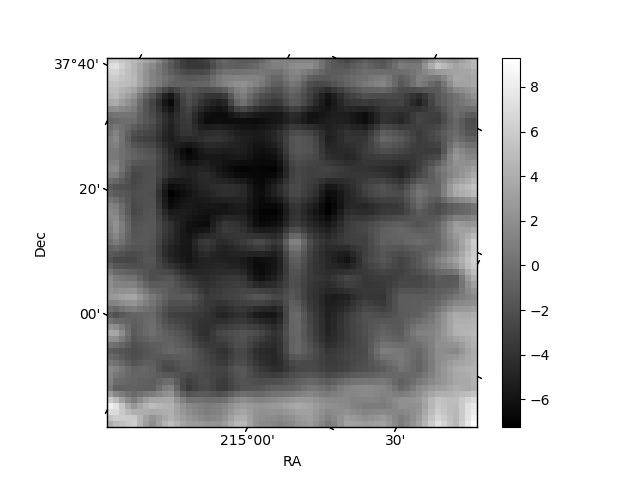
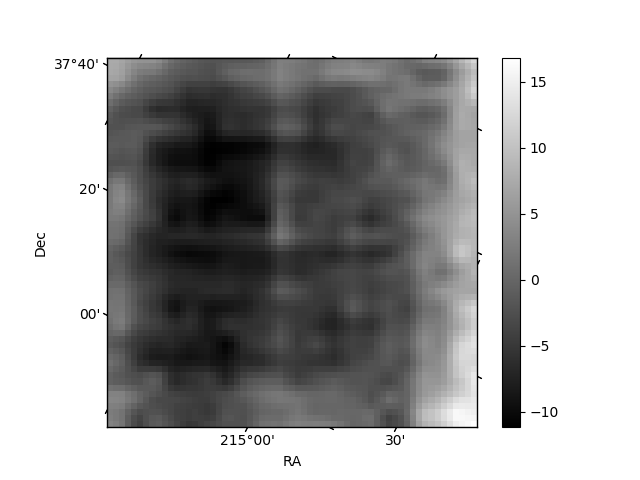
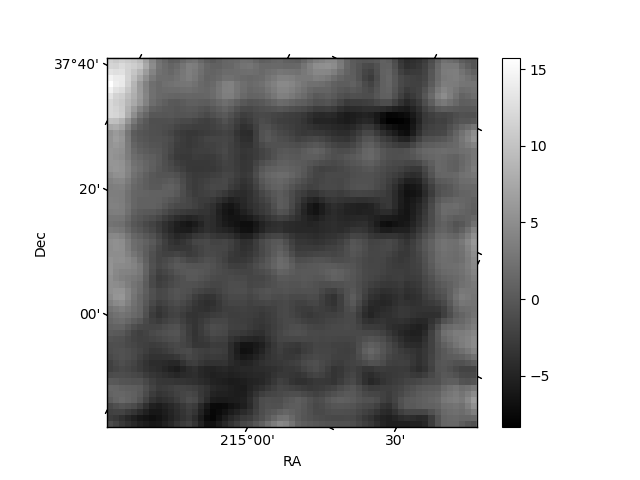
Histogram calculated using DETX and DETY for each event in the final _common_clean file
| Quadrant A | 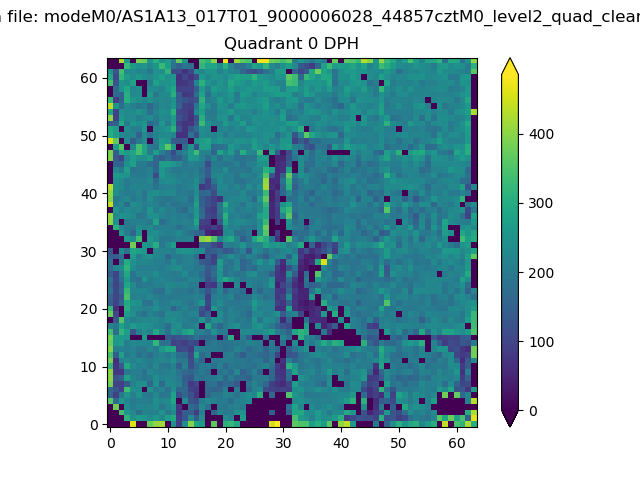 |
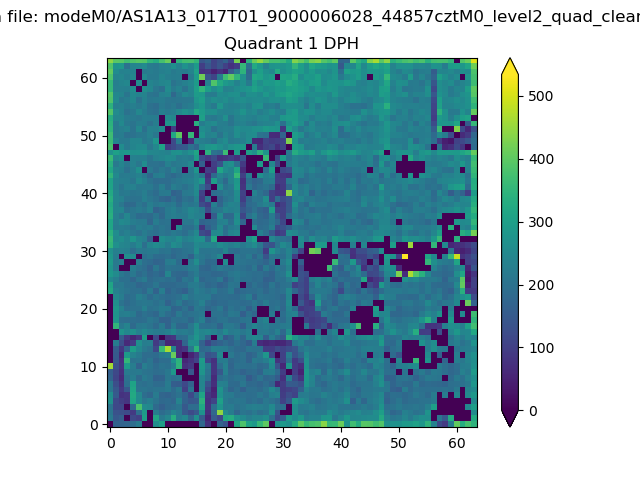 |
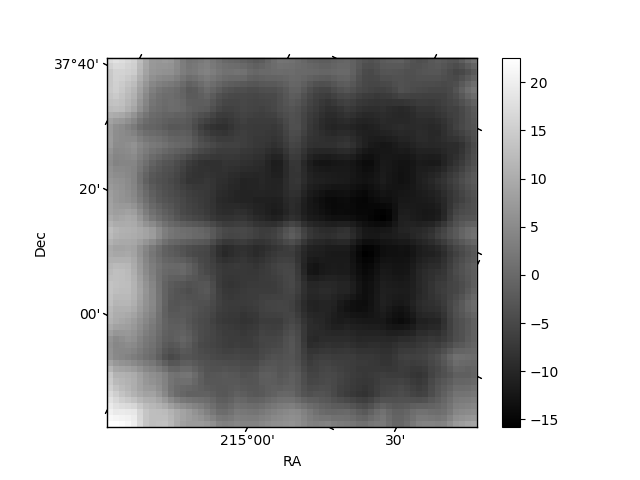
Quadrant B |
|---|---|---|---|
| Quadrant D | 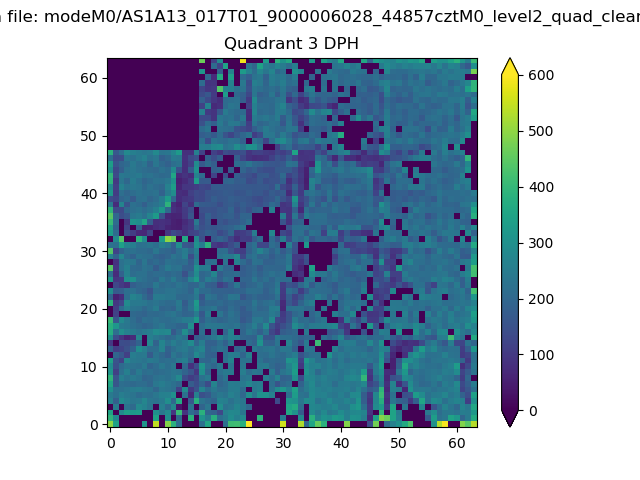 |
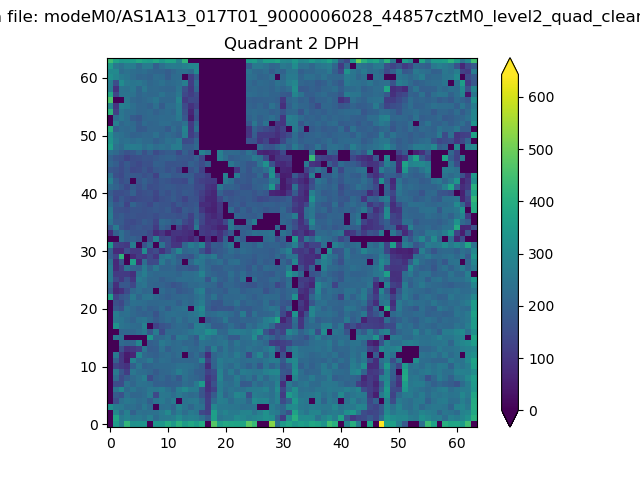 |
Quadrant C |
| Plot type | Count rate plots | Images |
|---|---|---|
| Comparison with Poisson distribution Blue bars denote a histogram of data divided into 1 sec bins. Red curve is a Poisson curve with rate = median count rate of data. |
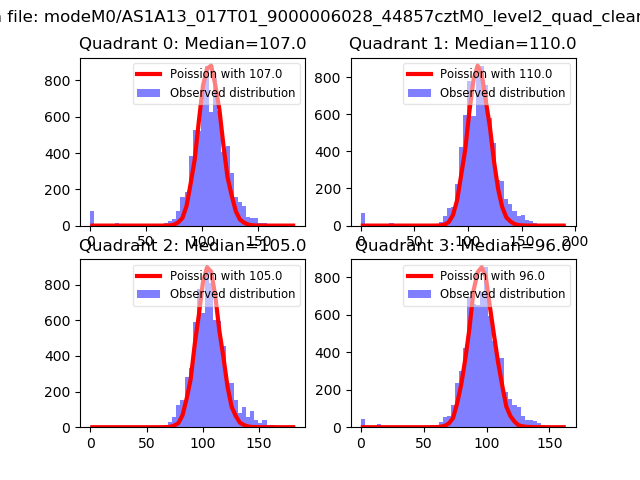 |
 |
| Quadrant-wise count rates Data is divided into 100 sec bins |
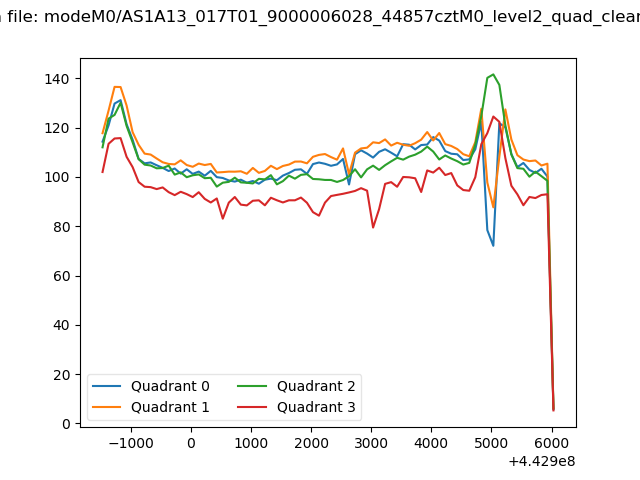 |
|
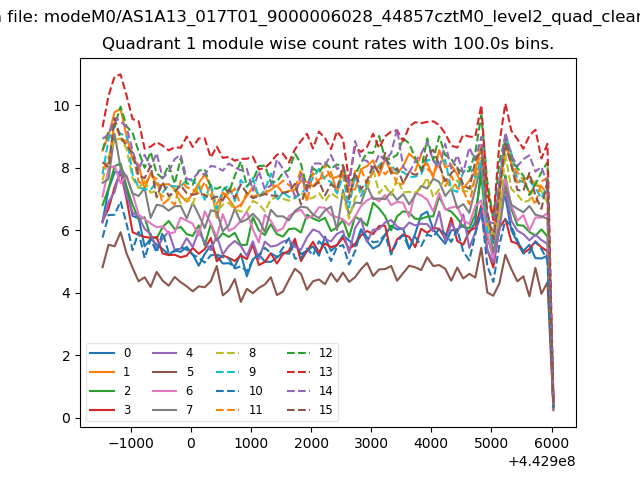
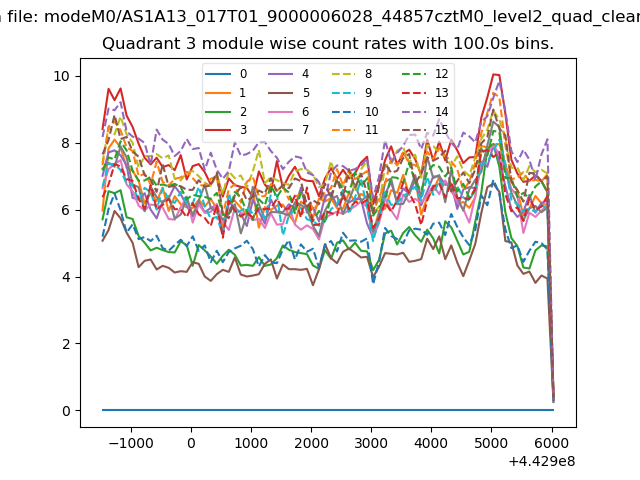
| Module-wise count rates for Quadrant A Data is divided into 100 sec bins |
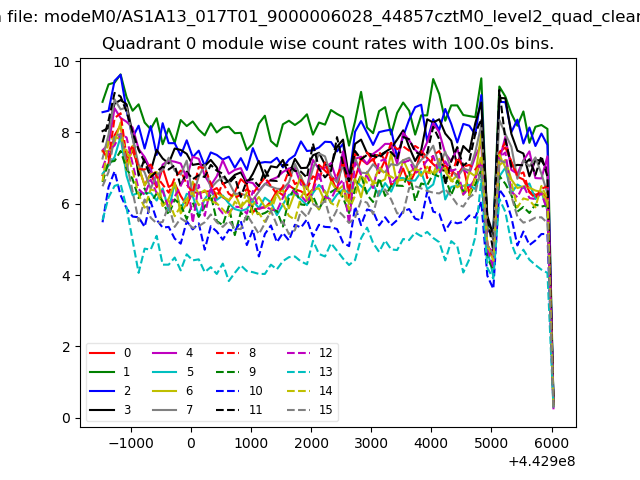 |
 |
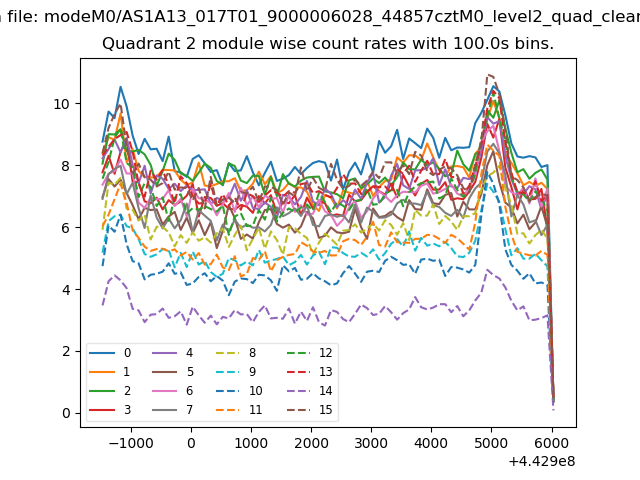
| Module-wise count rates for Quadrant B Data is divided into 100 sec bins |
 |
 |
| Module-wise count rates for Quadrant C Data is divided into 100 sec bins |
 |
 |
| Module-wise count rates for Quadrant D Data is divided into 100 sec bins |
 |
 |
| Parameter | Plot |
|---|---|
| CZT HV Monitor | 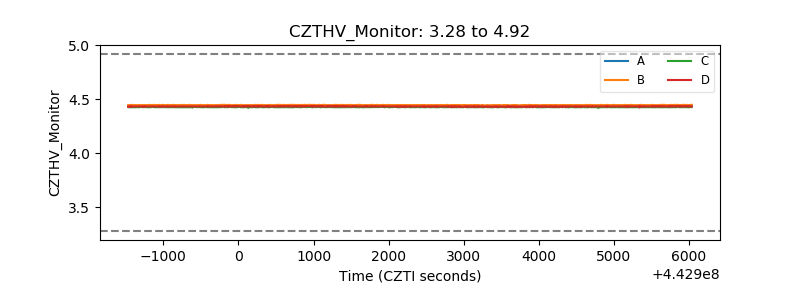 |
| D_VDD | 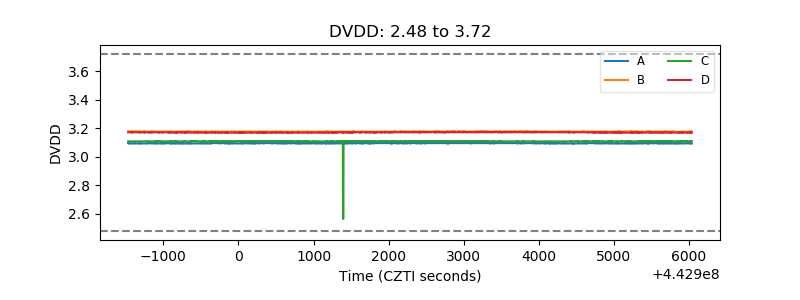 |
| Temperature 1 | 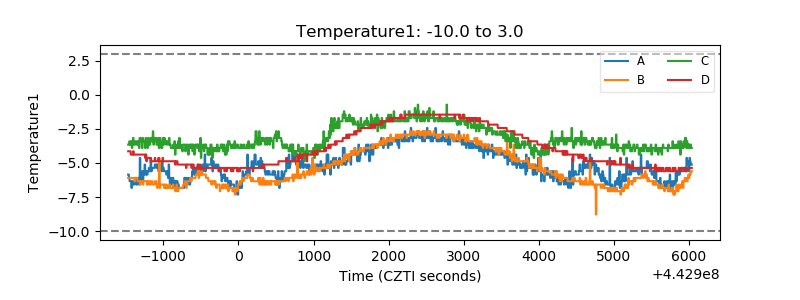 |
| Veto HV Monitor | 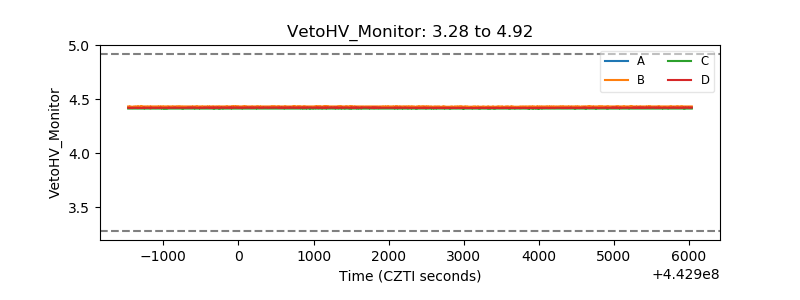 |
| Veto LLD | 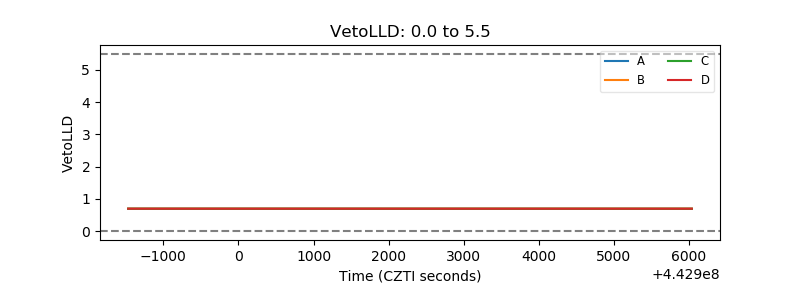 |
| Alpha Counter | 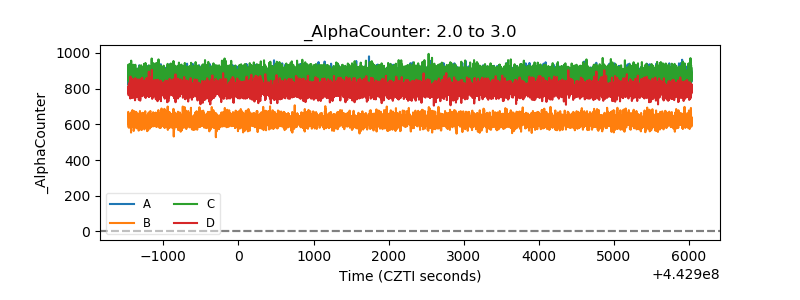 |
| _CPM_Rate | 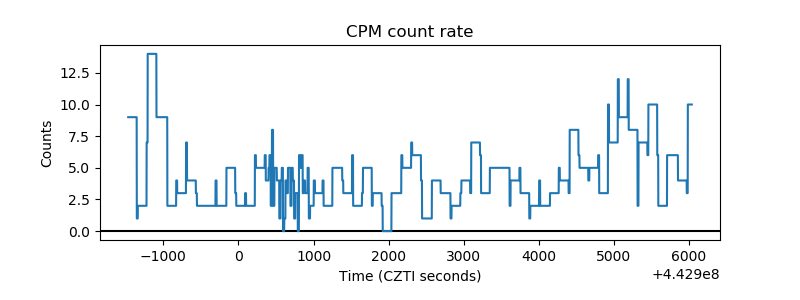 |
| CZT Counter | 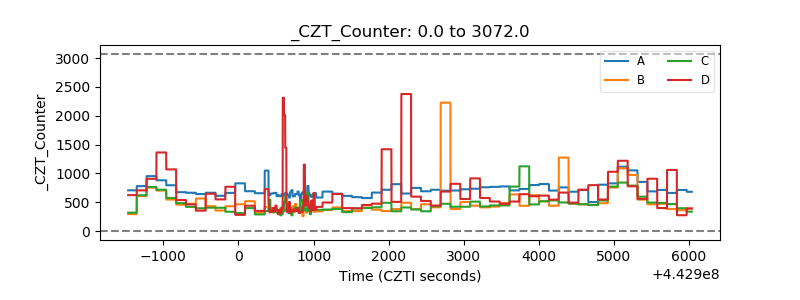 |
| +2.5 Volts monitor | 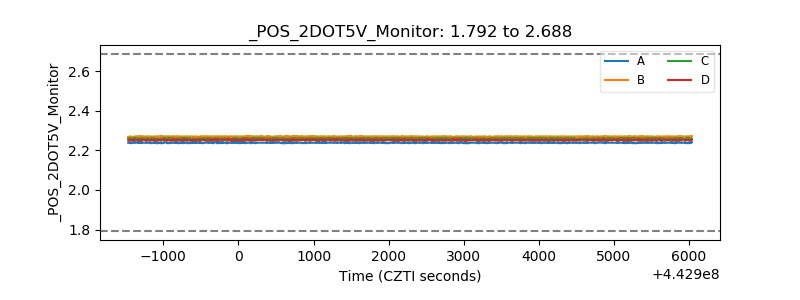 |
| +5 Volts monitor | 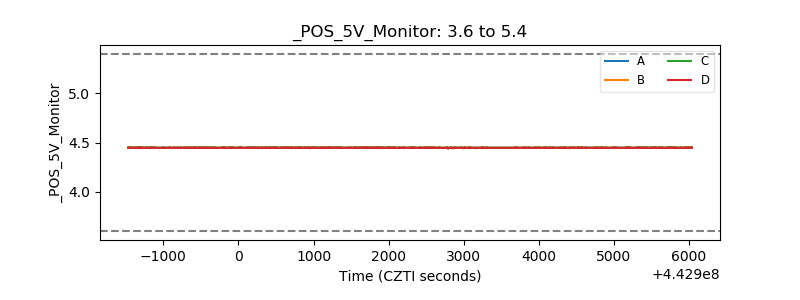 |
| _ROLL_ROT |  |
| _Roll_DEC | 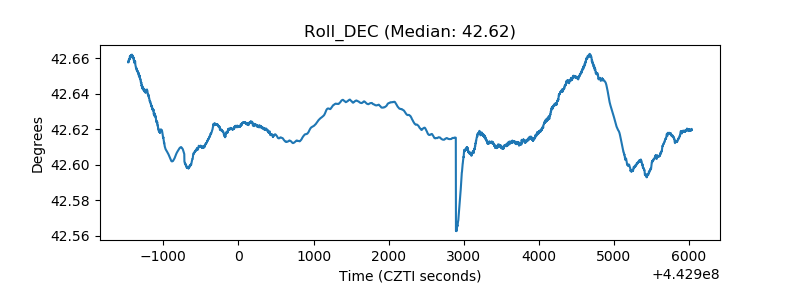 |
| _Roll_RA | 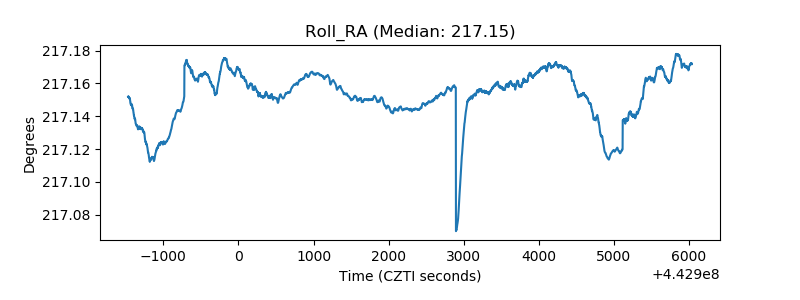 |
| Veto Counter | 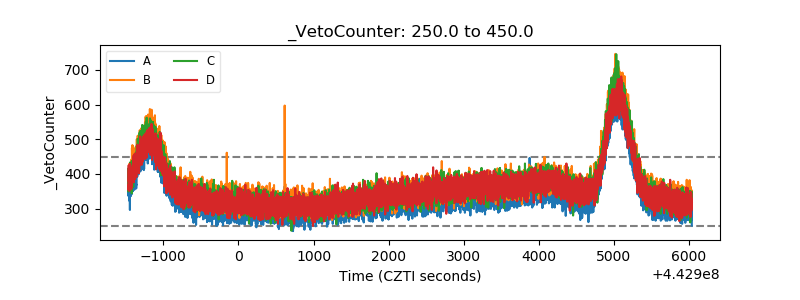 |