| Param | Original file | Final file |
|---|---|---|
| Filename | modeM0/AS1A13_017T01_9000006028_44859cztM0_level2.fits | modeM0/AS1A13_017T01_9000006028_44859cztM0_level2_quad_clean.evt |
| Size (bytes) | 836,092,800 | 193,561,920 |
| Size | 797.4 MB | 184.6 MB |
| Events in quadrant A | 8,939,309 | 1,284,428 |
| Events in quadrant B | 5,576,960 | 1,325,652 |
| Events in quadrant C | 5,570,663 | 1,268,246 |
| Events in quadrant D | 9,904,116 | 1,125,571 |
| Mode M0 | |||
|---|---|---|---|
| Quadrant | BADHDUFLAG | Total packets | Discarded packets |
| A | 0 | 37529 | 2 |
| B | 0 | 25508 | 2 |
| C | 0 | 25776 | 2 |
| D | 0 | 38084 | 3 |
| Mode SS | |||
|---|---|---|---|
| Quadrant | BADHDUFLAG | Total packets | Discarded packets |
| A | 0 | 254 | 0 |
| B | 0 | 254 | 0 |
| C | 0 | 254 | 0 |
| D | 0 | 254 | 0 |
| Mode M9 | |||
|---|---|---|---|
| Quadrant | BADHDUFLAG | Total packets | Discarded packets |
| A | 0 | 10 | 0 |
| B | 0 | 10 | 0 |
| C | 0 | 10 | 0 |
| D | 0 | 10 | 0 |
| Quadrant | Total seconds | Saturated seconds | Saturation percentage |
|---|---|---|---|
| A | 12381 | 239 | 1.930377% |
| B | 12381 | 108 | 0.872304% |
| C | 12381 | 83 | 0.670382% |
| D | 12380 | 552 | 4.458805% |
Noise dominated data is calculated using 1-second bins in cleaned event files. If a bin has >2000 counts, and if more than 50% of those come from <1% of pixels, then it is considered to be noise-dominated and hence unusable.
| Quadrant | # 1 sec bins | Bins with >0 counts | Bins with >2000 counts | High rate bins dominated by noise | Noise dominated (total time) | Noise dominated (detector-on time) | Marked lightcurve |
|---|---|---|---|---|---|---|---|
| A | 13446 | 12383 | 21 | 21 | 0.16% | 0.17% | 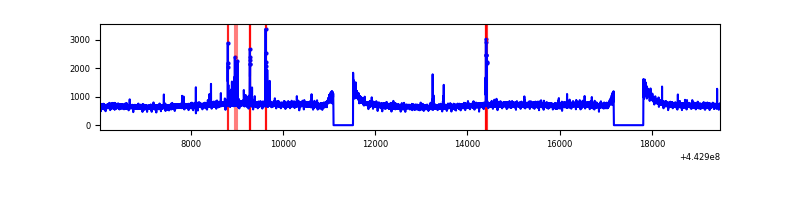 |
| B | 13446 | 12383 | 7 | 7 | 0.05% | 0.06% | 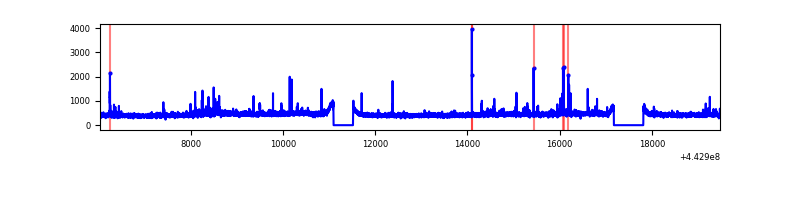 |
| C | 13446 | 12383 | 38 | 38 | 0.28% | 0.31% | 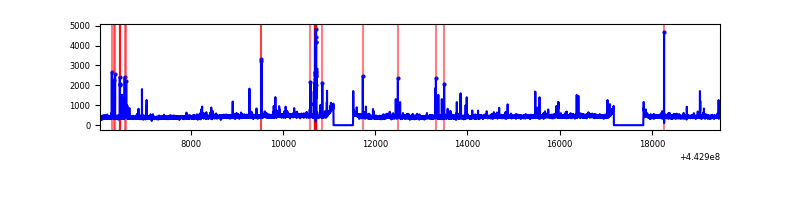 |
| D | 13445 | 12382 | 472 | 472 | 3.51% | 3.81% | 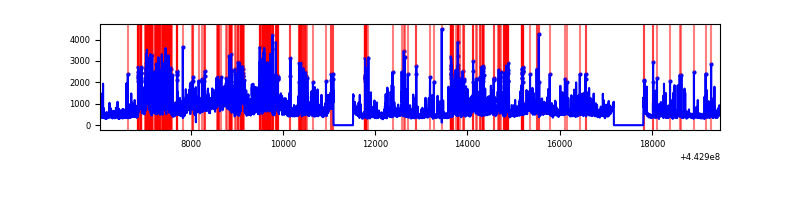 |
Top three noisy pixels from each quadrant. If the there are fewer than three noisy pixels in the level2.evt file, extra rows are filled as -1
| Pixel properties | Quadrant properties | ||||||
|---|---|---|---|---|---|---|---|
| Quadrant | DetID | PixID | Counts | Sigma | Mean | Median | Sigma |
| A | 10 | 83 | 3573990 | 12759.06 | 1352 | 1324 | 280.0 |
| A | 13 | 248 | 119018 | 420.32 | 1352 | 1324 | 280.0 |
| A | 7 | 3 | 16139 | 52.91 | 1352 | 1324 | 280.0 |
| B | 5 | 255 | 71700 | 263.4 | 1346 | 1304 | 267.3 |
| B | 0 | 155 | 39797 | 144.03 | 1346 | 1304 | 267.3 |
| B | 0 | 168 | 37661 | 136.04 | 1346 | 1304 | 267.3 |
| C | 1 | 3 | 195443 | 628.98 | 1319 | 1327 | 308.6 |
| C | 0 | 64 | 64396 | 204.36 | 1319 | 1327 | 308.6 |
| C | 12 | 250 | 51861 | 163.74 | 1319 | 1327 | 308.6 |
| D | 13 | 174 | 1350261 | 4147.52 | 1302 | 1262 | 325.3 |
| D | 1 | 52 | 1031471 | 3167.39 | 1302 | 1262 | 325.3 |
| D | 5 | 235 | 703543 | 2159.17 | 1302 | 1262 | 325.3 |
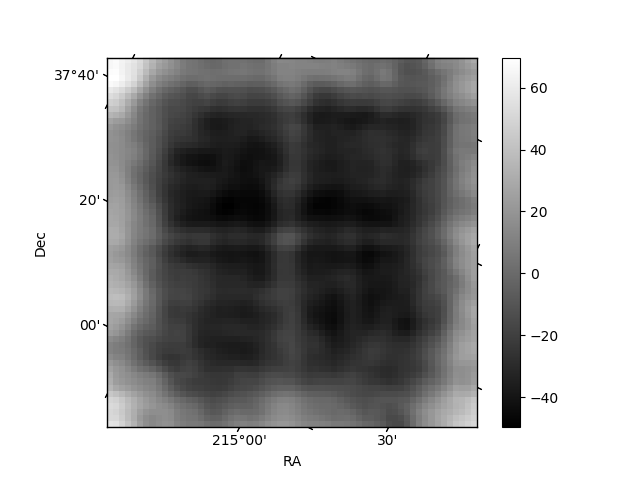
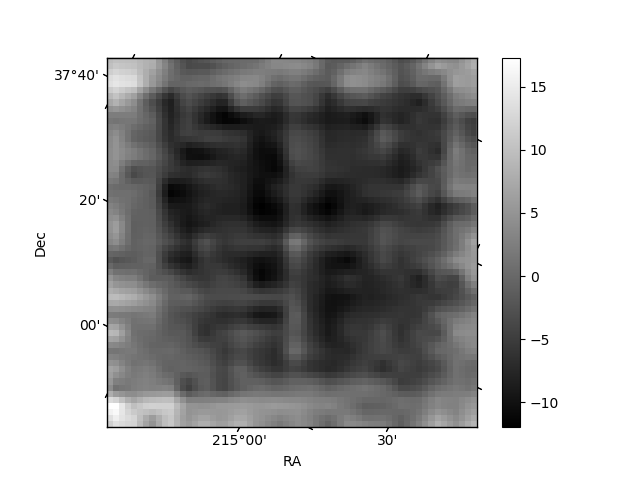
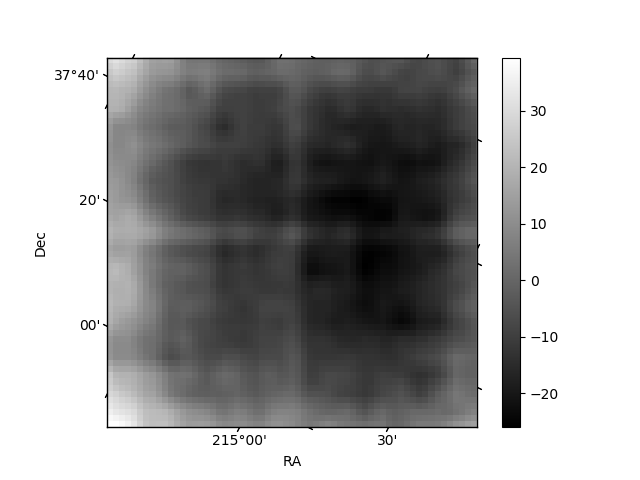
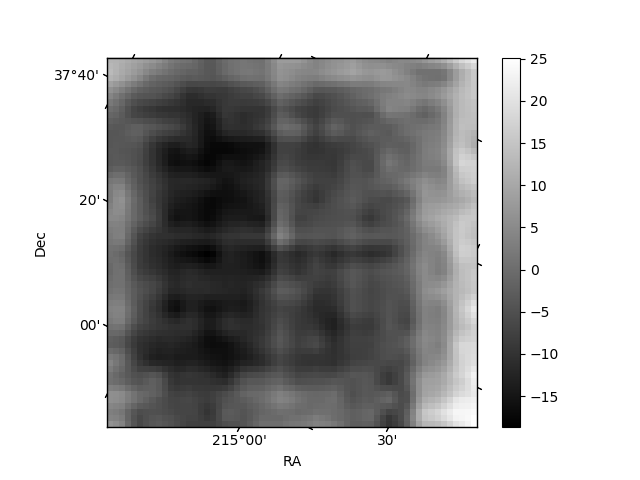
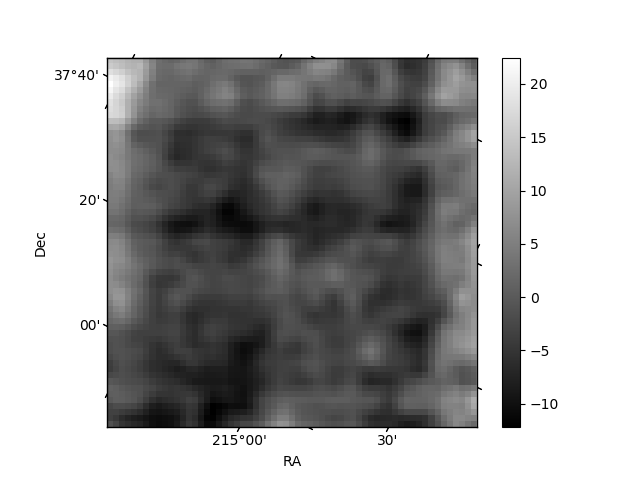
Histogram calculated using DETX and DETY for each event in the final _common_clean file
| Quadrant A | 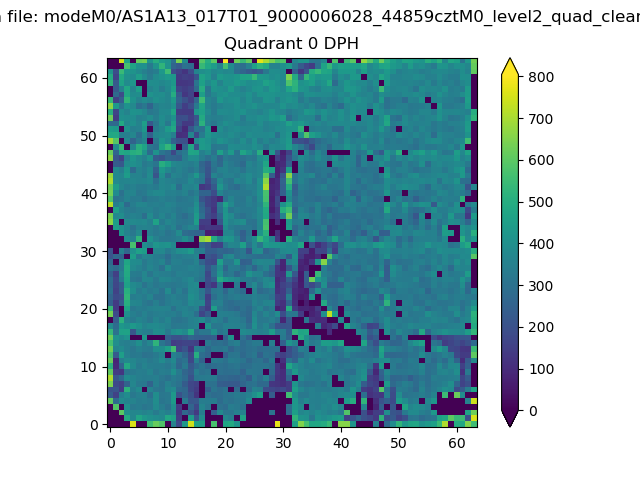 |
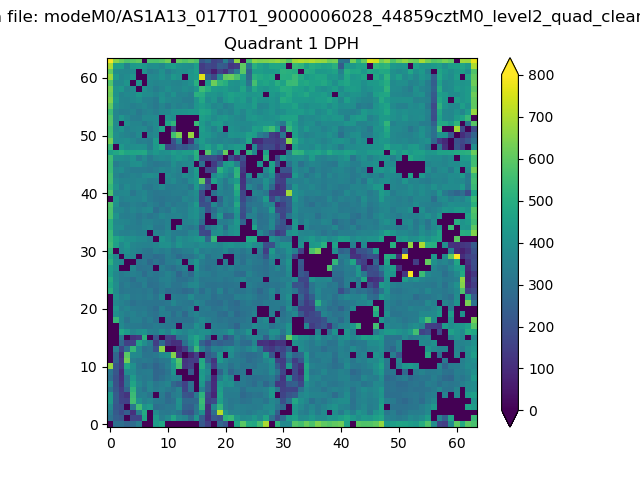 |
Quadrant B |
|---|---|---|---|
| Quadrant D | 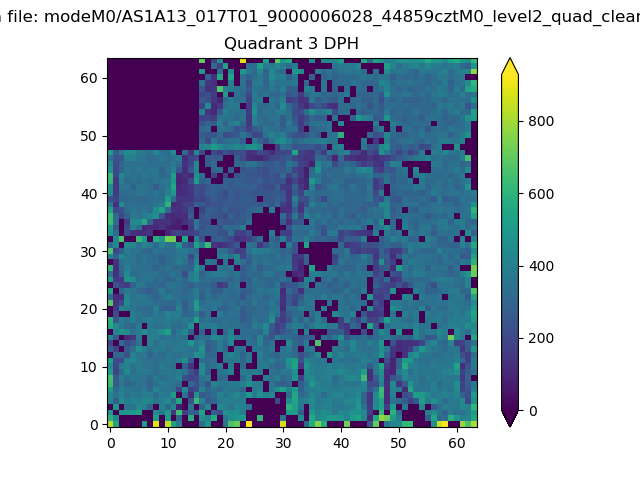 |
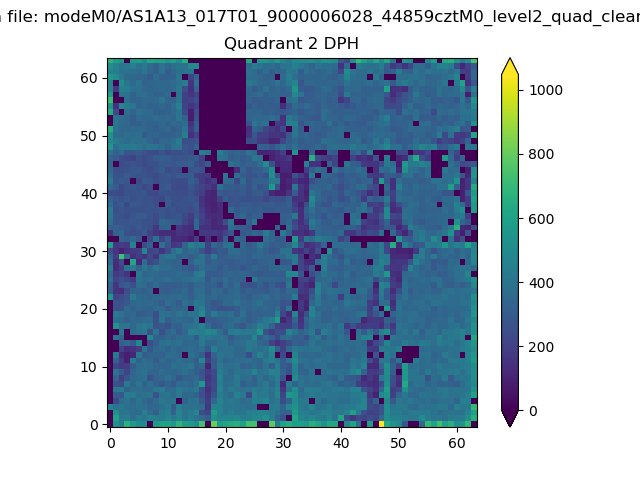 |
Quadrant C |
| Plot type | Count rate plots | Images |
|---|---|---|
| Comparison with Poisson distribution Blue bars denote a histogram of data divided into 1 sec bins. Red curve is a Poisson curve with rate = median count rate of data. |
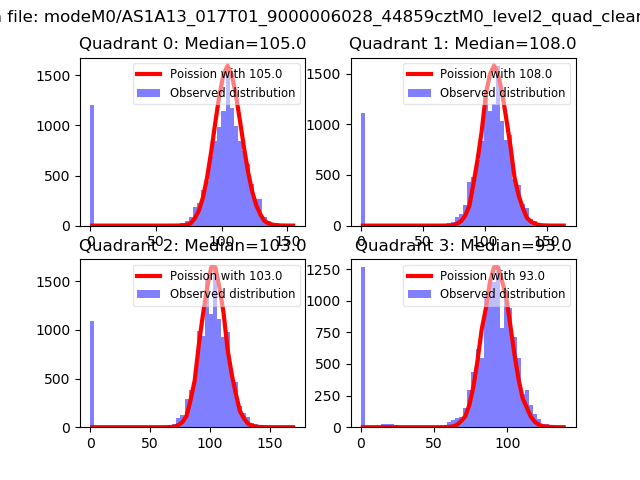 |
 |
| Quadrant-wise count rates Data is divided into 100 sec bins |
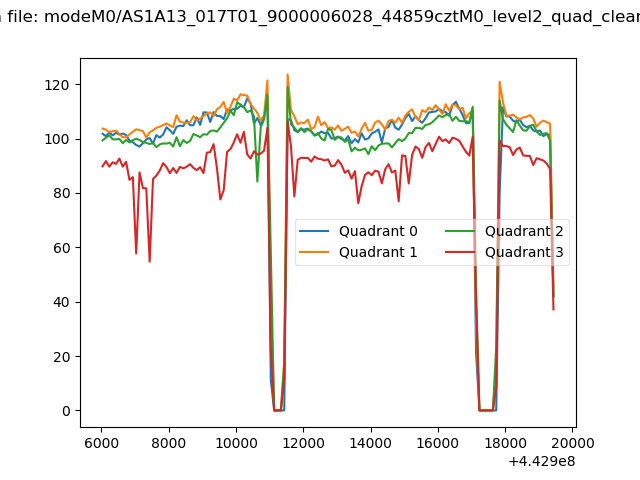 |
|
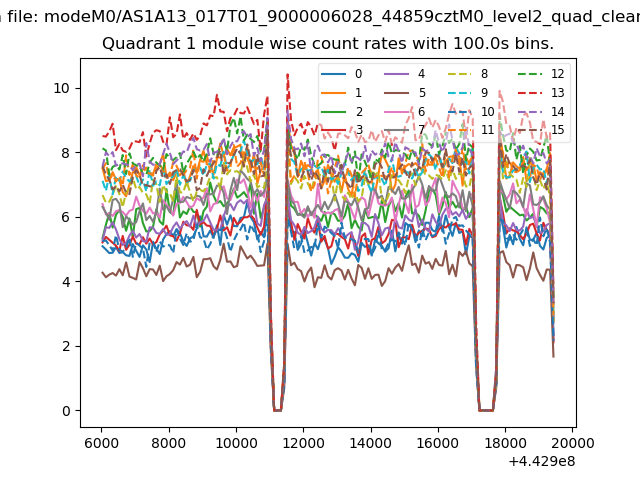
| Module-wise count rates for Quadrant A Data is divided into 100 sec bins |
 |
 |
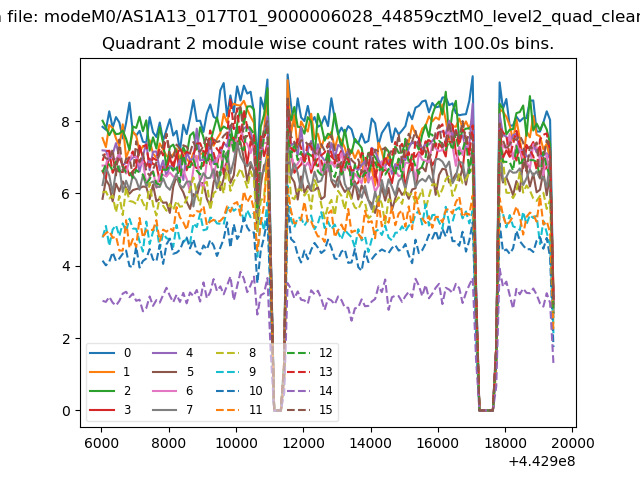
| Module-wise count rates for Quadrant B Data is divided into 100 sec bins |
 |
 |
| Module-wise count rates for Quadrant C Data is divided into 100 sec bins |
 |
 |
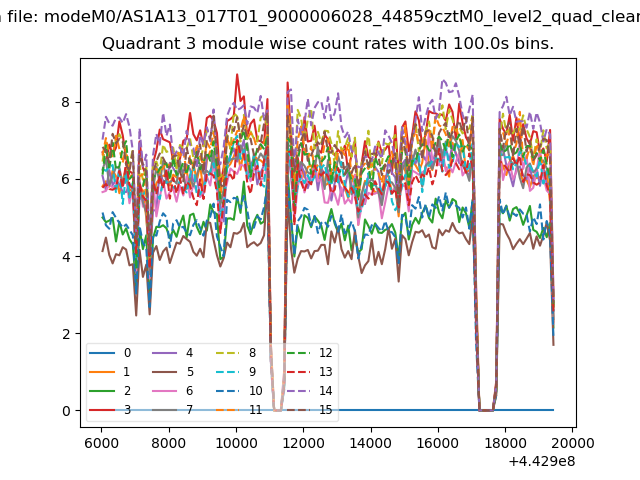
| Module-wise count rates for Quadrant D Data is divided into 100 sec bins |
 |
 |
| Parameter | Plot |
|---|---|
| CZT HV Monitor | 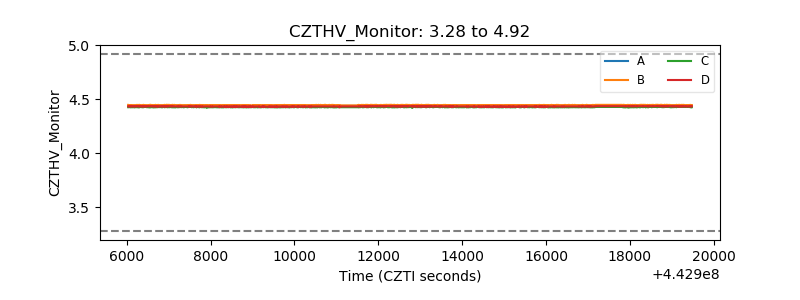 |
| D_VDD | 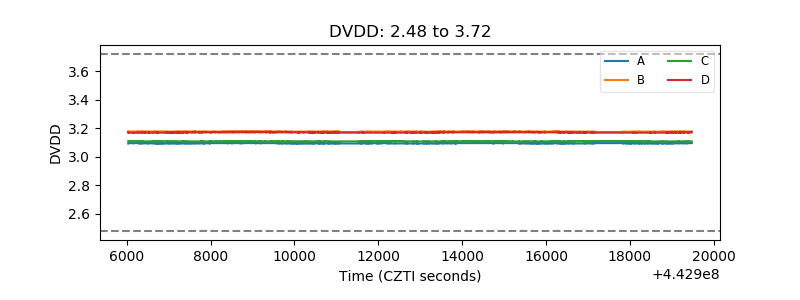 |
| Temperature 1 | 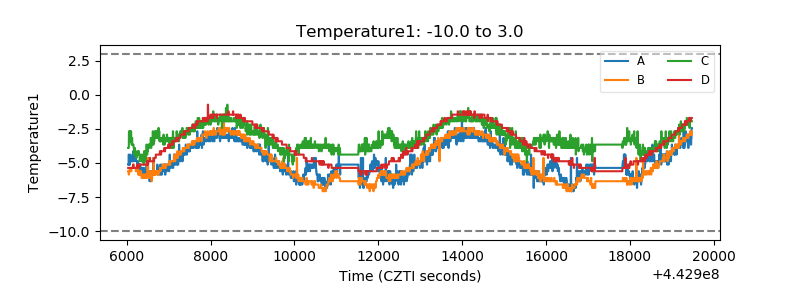 |
| Veto HV Monitor | 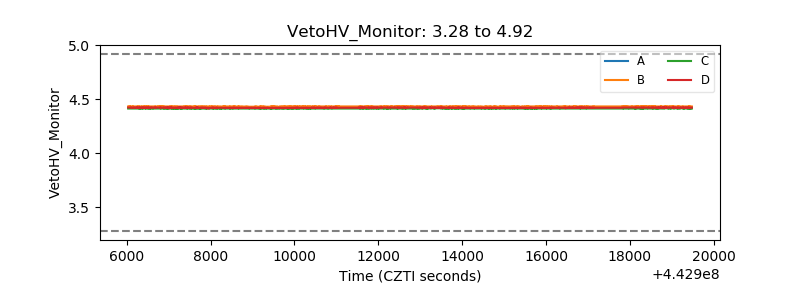 |
| Veto LLD | 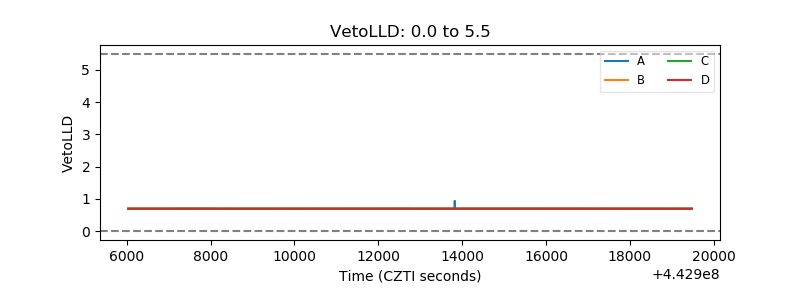 |
| Alpha Counter | 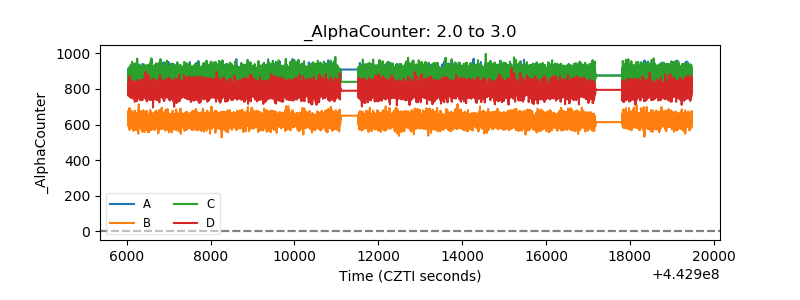 |
| _CPM_Rate | 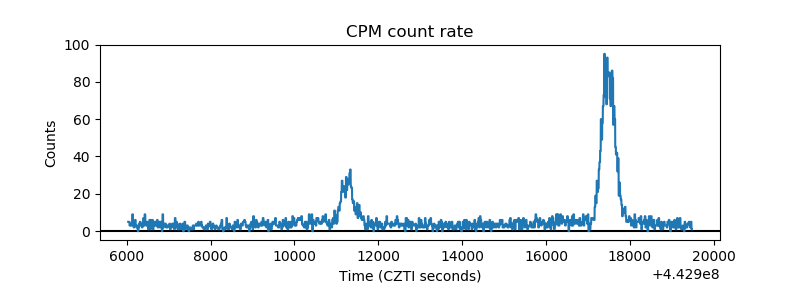 |
| CZT Counter | 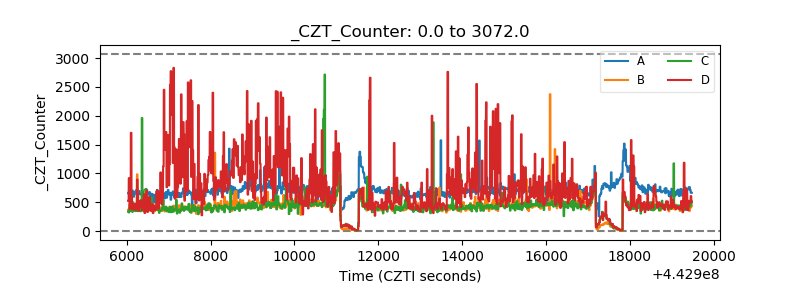 |
| +2.5 Volts monitor | 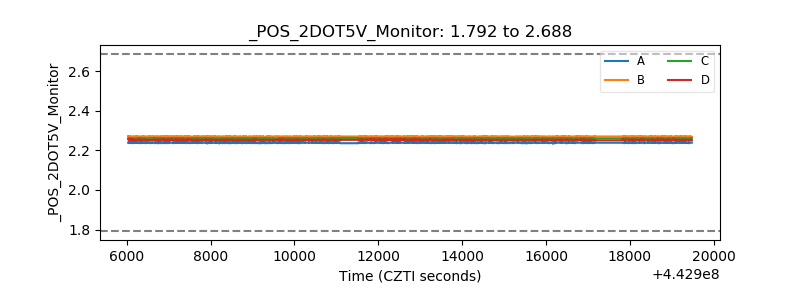 |
| +5 Volts monitor | 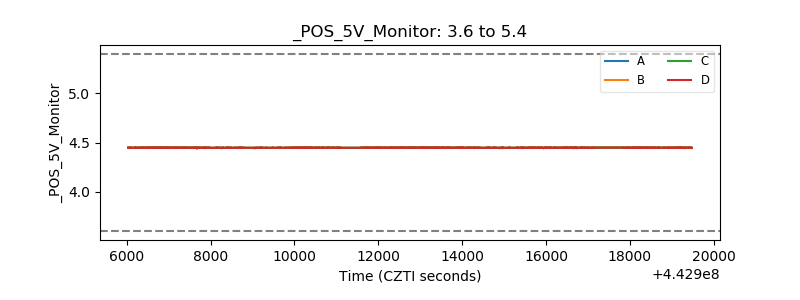 |
| _ROLL_ROT | 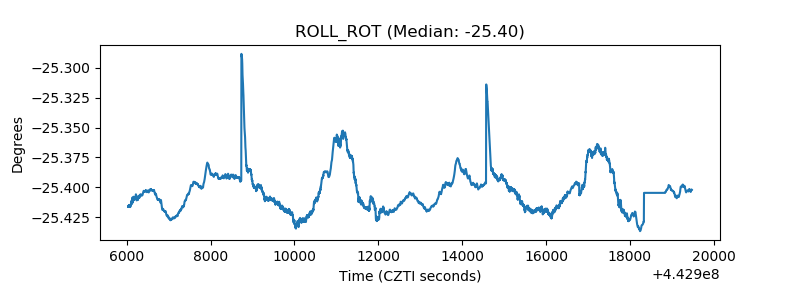 |
| _Roll_DEC | 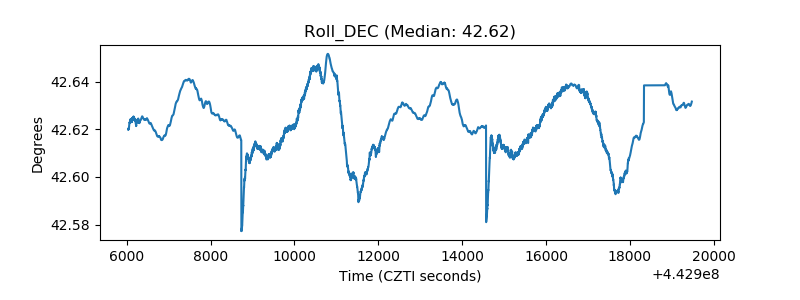 |
| _Roll_RA | 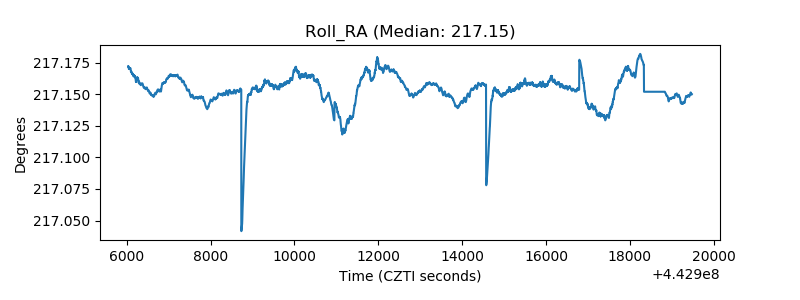 |
| Veto Counter | 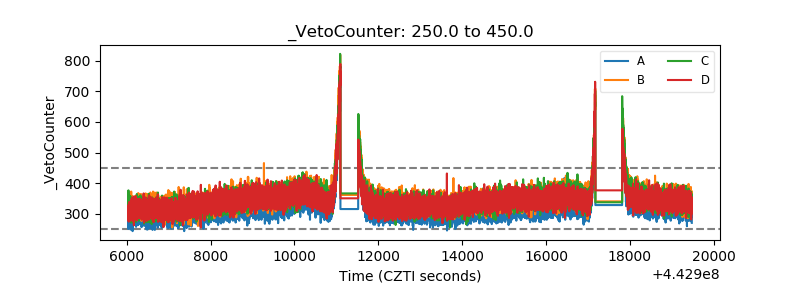 |