| Param | Original file | Final file |
|---|---|---|
| Filename | modeM0/AS1A13_017T01_9000006028_44860cztM0_level2.fits | modeM0/AS1A13_017T01_9000006028_44860cztM0_level2_quad_clean.evt |
| Size (bytes) | 447,814,080 | 100,333,440 |
| Size | 427.1 MB | 95.7 MB |
| Events in quadrant A | 4,845,275 | 661,780 |
| Events in quadrant B | 2,954,431 | 694,495 |
| Events in quadrant C | 3,293,009 | 654,094 |
| Events in quadrant D | 4,990,626 | 584,169 |
| Mode M0 | |||
|---|---|---|---|
| Quadrant | BADHDUFLAG | Total packets | Discarded packets |
| A | 0 | 19851 | 1 |
| B | 0 | 13271 | 1 |
| C | 0 | 14193 | 1 |
| D | 0 | 19280 | 1 |
| Mode SS | |||
|---|---|---|---|
| Quadrant | BADHDUFLAG | Total packets | Discarded packets |
| A | 0 | 130 | 0 |
| B | 0 | 130 | 0 |
| C | 0 | 130 | 0 |
| D | 0 | 130 | 0 |
| Mode M9 | |||
|---|---|---|---|
| Quadrant | BADHDUFLAG | Total packets | Discarded packets |
| A | 0 | 8 | 0 |
| B | 0 | 8 | 0 |
| C | 0 | 8 | 0 |
| D | 0 | 8 | 0 |
| Quadrant | Total seconds | Saturated seconds | Saturation percentage |
|---|---|---|---|
| A | 6351 | 187 | 2.944418% |
| B | 6352 | 67 | 1.054786% |
| C | 6351 | 89 | 1.401354% |
| D | 6351 | 307 | 4.833884% |
Noise dominated data is calculated using 1-second bins in cleaned event files. If a bin has >2000 counts, and if more than 50% of those come from <1% of pixels, then it is considered to be noise-dominated and hence unusable.
| Quadrant | # 1 sec bins | Bins with >0 counts | Bins with >2000 counts | High rate bins dominated by noise | Noise dominated (total time) | Noise dominated (detector-on time) | Marked lightcurve |
|---|---|---|---|---|---|---|---|
| A | 7181 | 6352 | 51 | 51 | 0.71% | 0.80% | 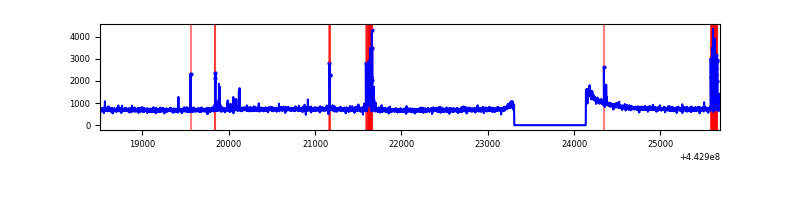 |
| B | 7182 | 6353 | 3 | 3 | 0.04% | 0.05% | 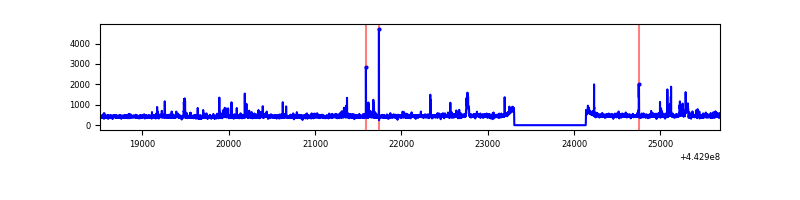 |
| C | 7181 | 6352 | 45 | 45 | 0.63% | 0.71% | 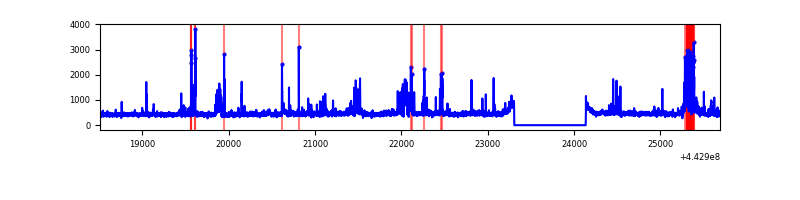 |
| D | 7181 | 6352 | 235 | 235 | 3.27% | 3.70% | 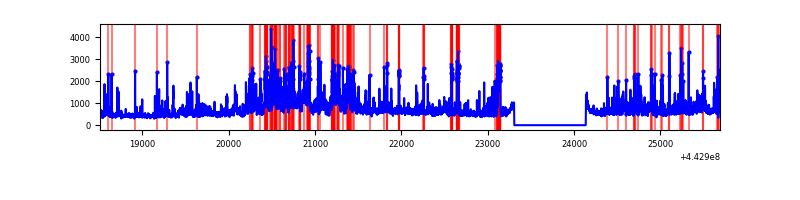 |
Top three noisy pixels from each quadrant. If the there are fewer than three noisy pixels in the level2.evt file, extra rows are filled as -1
| Pixel properties | Quadrant properties | ||||||
|---|---|---|---|---|---|---|---|
| Quadrant | DetID | PixID | Counts | Sigma | Mean | Median | Sigma |
| A | 10 | 83 | 1925346 | 13144.54 | 699 | 684 | 146.4 |
| A | 13 | 248 | 198563 | 1351.42 | 699 | 684 | 146.4 |
| A | 7 | 3 | 11590 | 74.48 | 699 | 684 | 146.4 |
| B | 0 | 183 | 78920 | 567.13 | 696 | 674 | 138.0 |
| B | 5 | 255 | 58982 | 422.62 | 696 | 674 | 138.0 |
| B | 0 | 190 | 35277 | 250.8 | 696 | 674 | 138.0 |
| C | 0 | 64 | 298093 | 1855.45 | 683 | 687 | 160.3 |
| C | 14 | 254 | 140613 | 872.97 | 683 | 687 | 160.3 |
| C | 1 | 3 | 110516 | 685.2 | 683 | 687 | 160.3 |
| D | 13 | 174 | 698659 | 4114.98 | 674 | 652 | 169.6 |
| D | 5 | 235 | 489410 | 2881.39 | 674 | 652 | 169.6 |
| D | 1 | 52 | 338514 | 1991.81 | 674 | 652 | 169.6 |
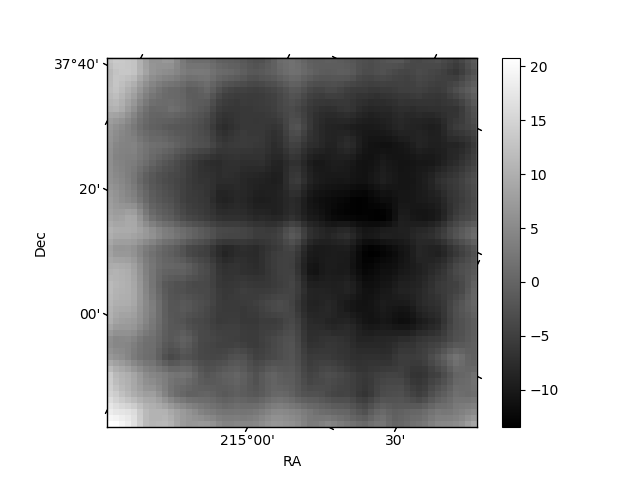
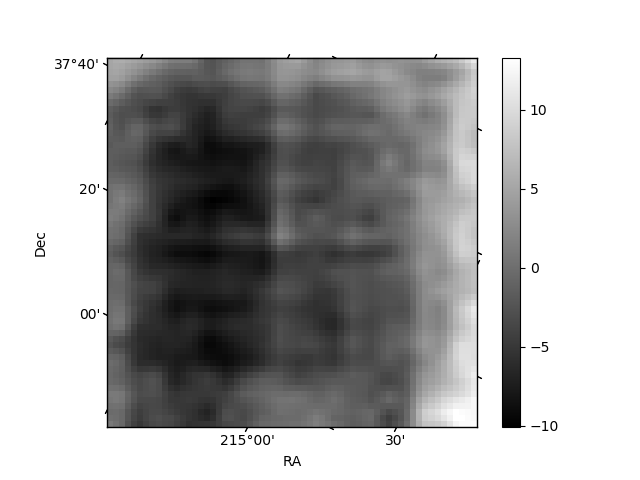
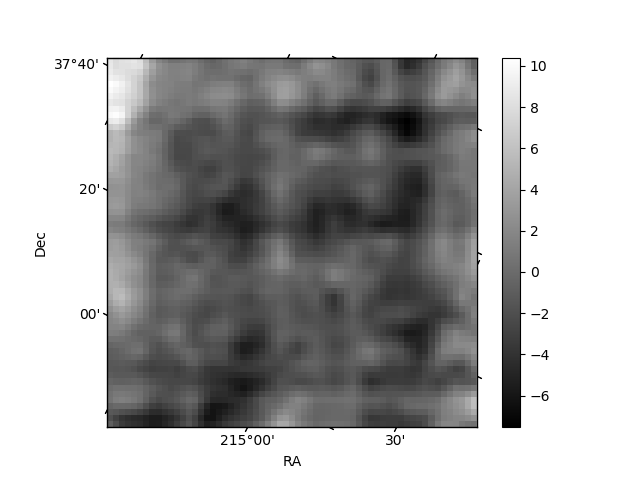
Histogram calculated using DETX and DETY for each event in the final _common_clean file
| Quadrant A | 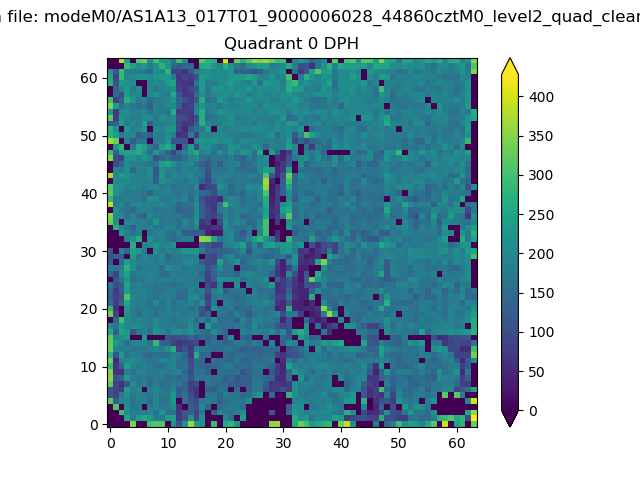 |
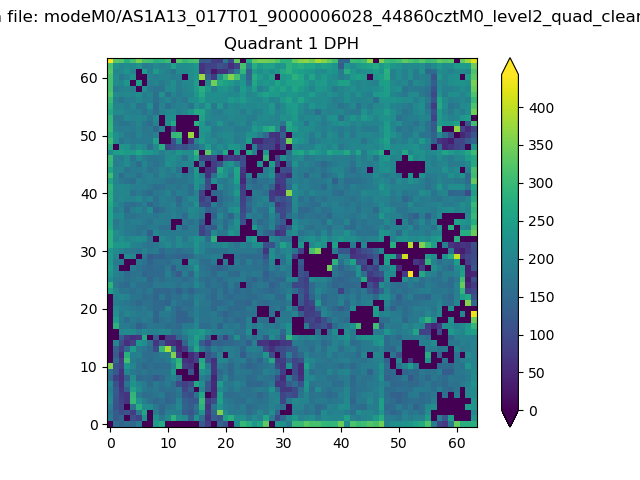 |
Quadrant B |
|---|---|---|---|
| Quadrant D | 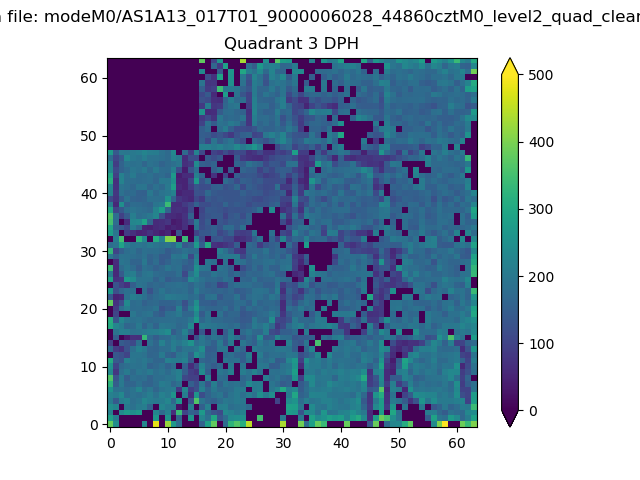 |
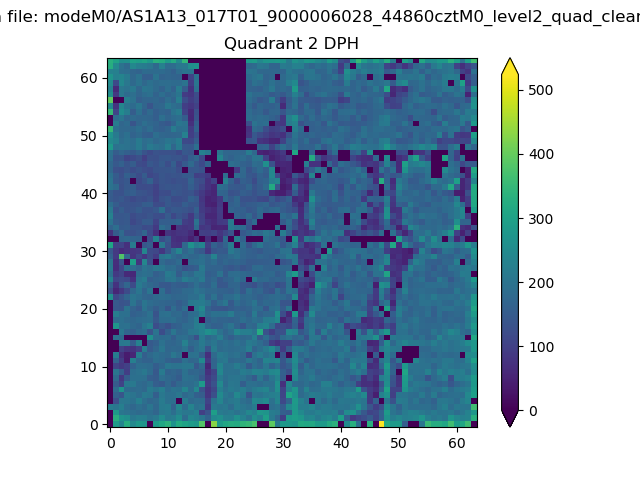 |
Quadrant C |
| Plot type | Count rate plots | Images |
|---|---|---|
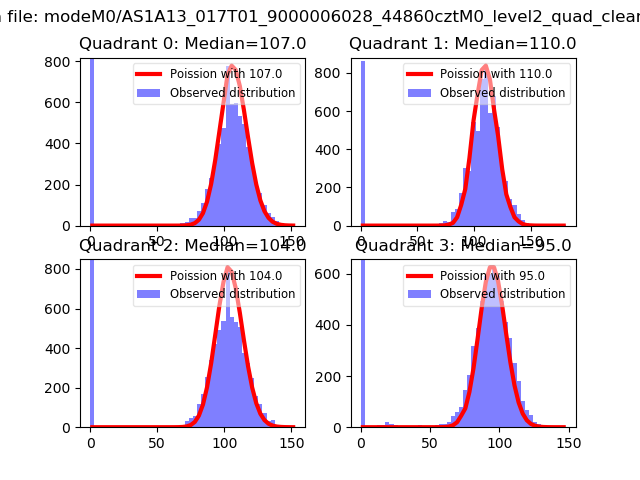
| Comparison with Poisson distribution Blue bars denote a histogram of data divided into 1 sec bins. Red curve is a Poisson curve with rate = median count rate of data. |
 |
 |
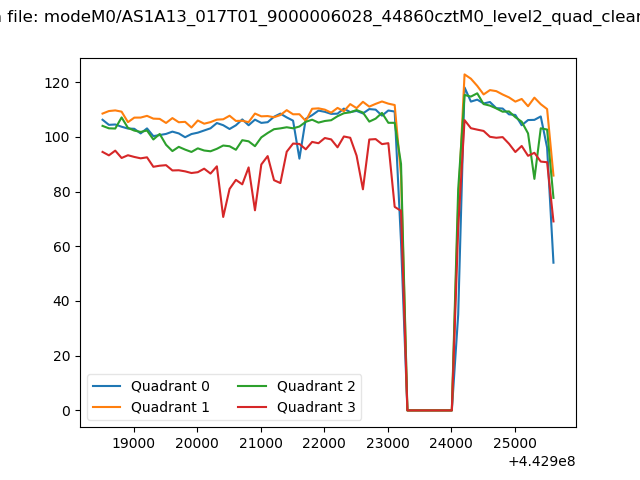
| Quadrant-wise count rates Data is divided into 100 sec bins |
 |
|
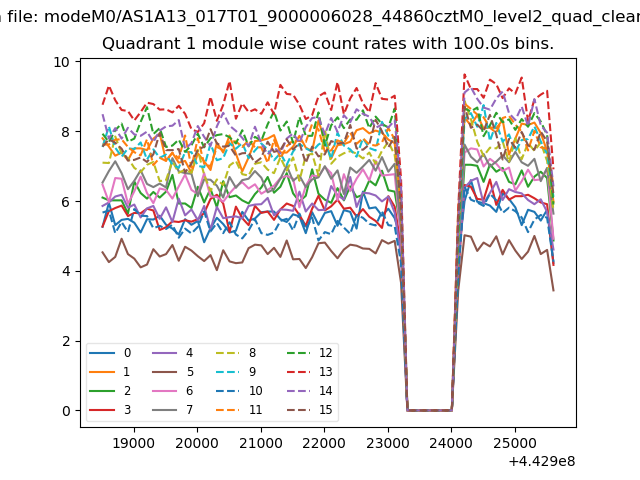
| Module-wise count rates for Quadrant A Data is divided into 100 sec bins |
 |
 |
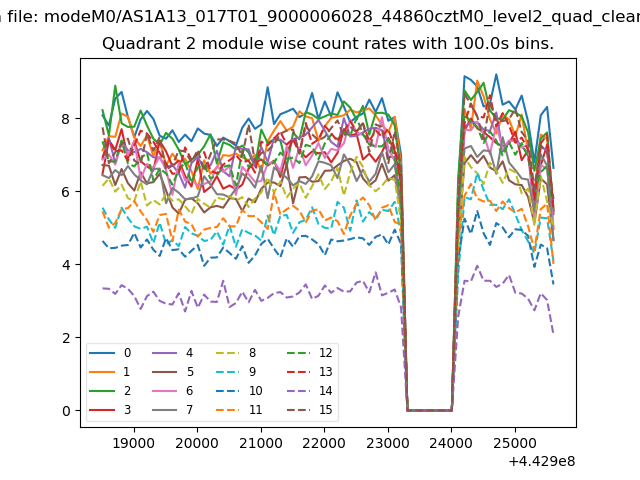
| Module-wise count rates for Quadrant B Data is divided into 100 sec bins |
 |
 |
| Module-wise count rates for Quadrant C Data is divided into 100 sec bins |
 |
 |
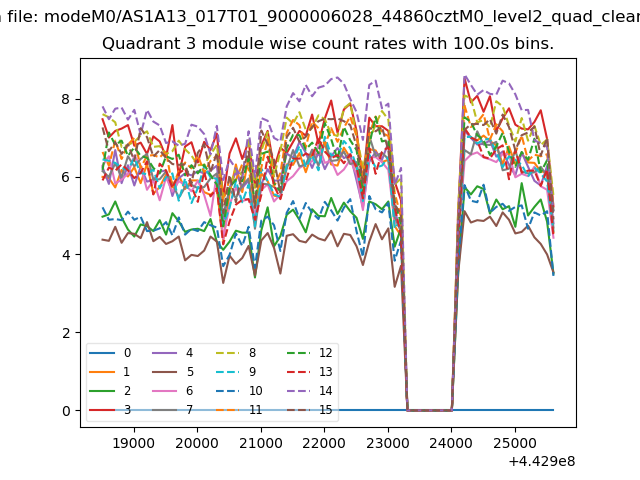
| Module-wise count rates for Quadrant D Data is divided into 100 sec bins |
 |
 |
| Parameter | Plot |
|---|---|
| CZT HV Monitor | 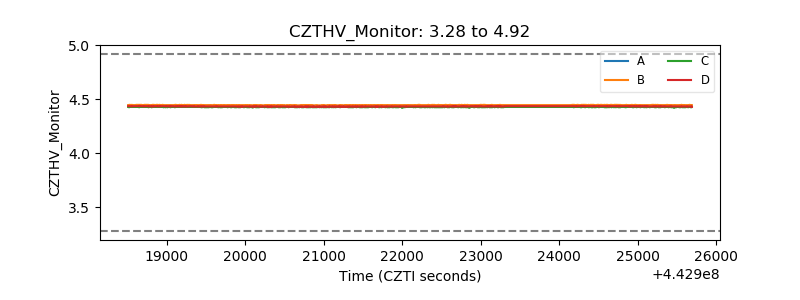 |
| D_VDD | 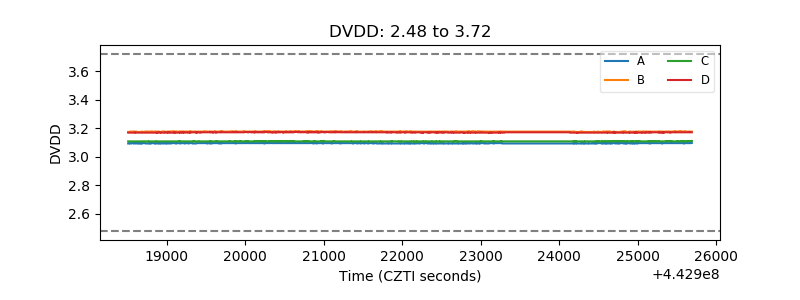 |
| Temperature 1 | 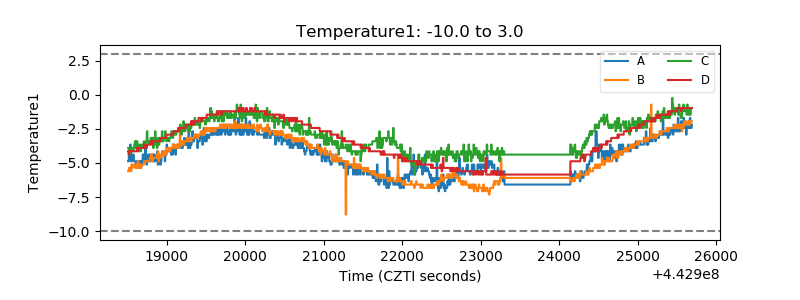 |
| Veto HV Monitor | 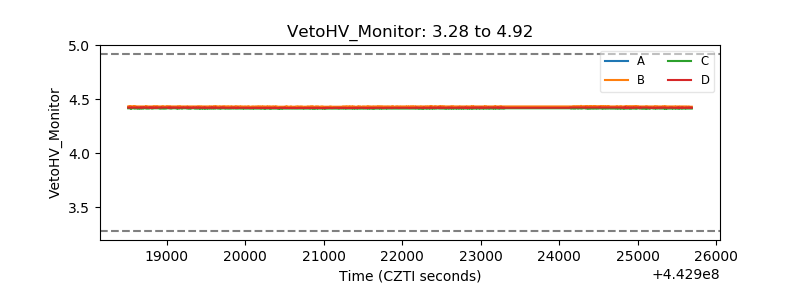 |
| Veto LLD | 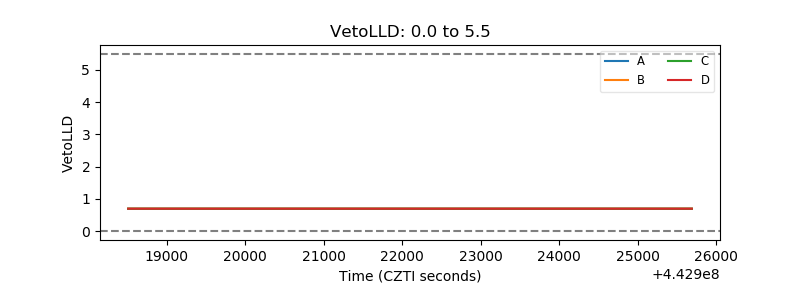 |
| Alpha Counter | 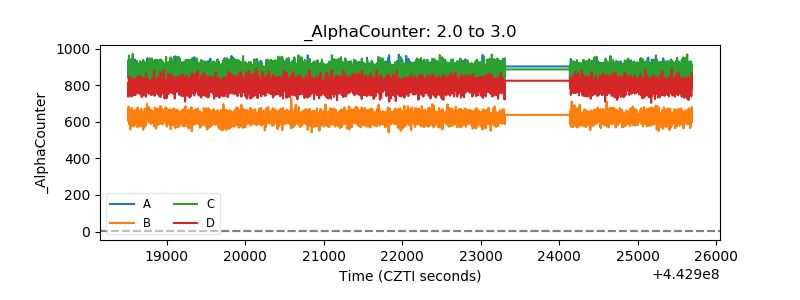 |
| _CPM_Rate | 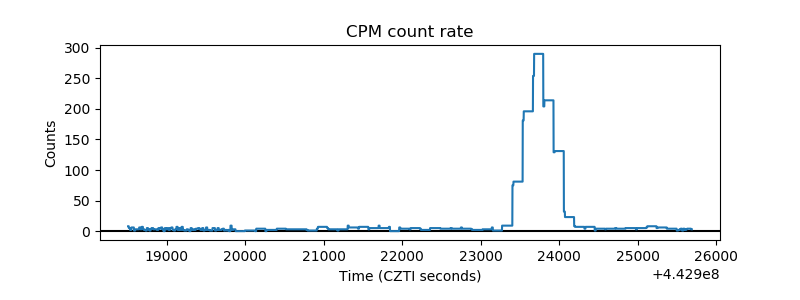 |
| CZT Counter | 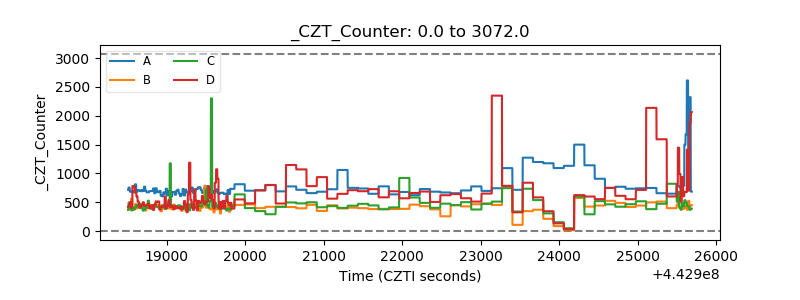 |
| +2.5 Volts monitor | 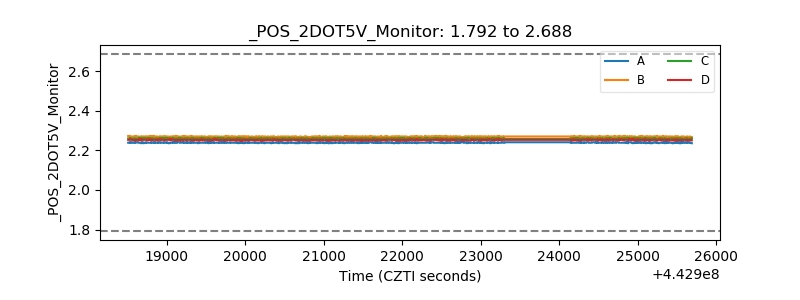 |
| +5 Volts monitor | 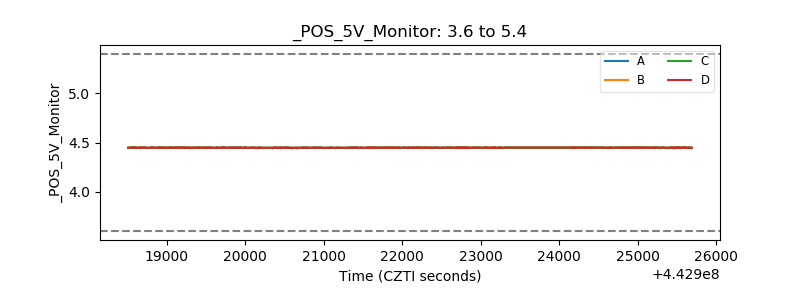 |
| _ROLL_ROT | 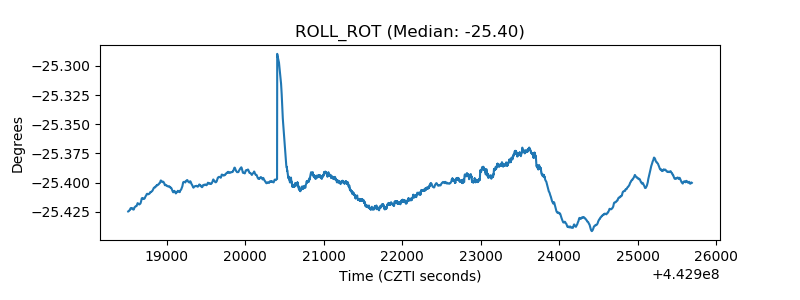 |
| _Roll_DEC | 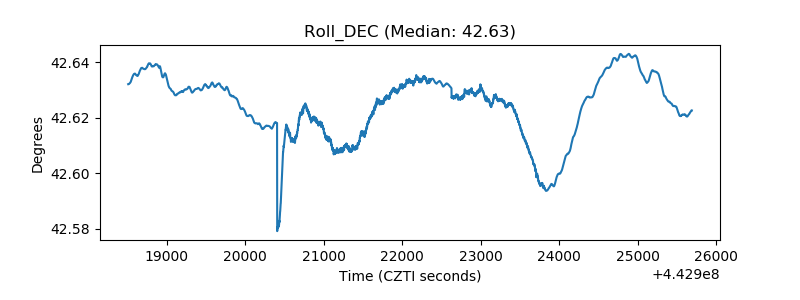 |
| _Roll_RA | 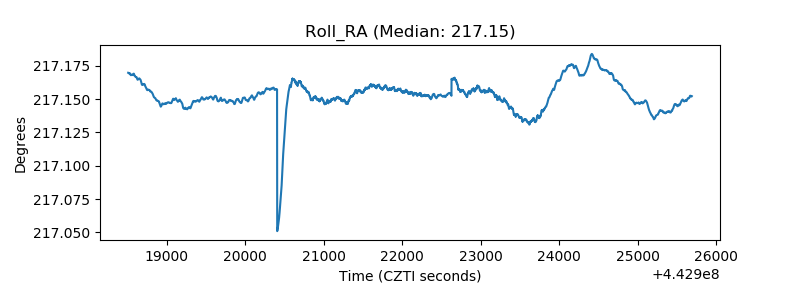 |
| Veto Counter | 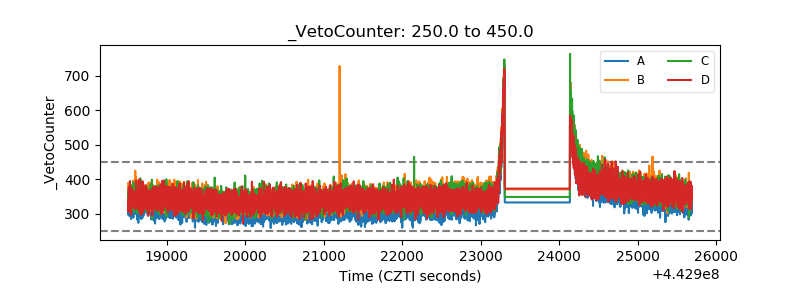 |