| Param | Original file | Final file |
|---|---|---|
| Filename | modeM0/AS1A13_017T01_9000006028_44861cztM0_level2.fits | modeM0/AS1A13_017T01_9000006028_44861cztM0_level2_quad_clean.evt |
| Size (bytes) | 1,584,794,880 | 337,711,680 |
| Size | 1.5 GB | 322.1 MB |
| Events in quadrant A | 15,633,179 | 2,297,678 |
| Events in quadrant B | 10,207,090 | 2,377,867 |
| Events in quadrant C | 10,517,125 | 2,238,113 |
| Events in quadrant D | 20,644,304 | 1,830,416 |
| Mode M0 | |||
|---|---|---|---|
| Quadrant | BADHDUFLAG | Total packets | Discarded packets |
| A | 0 | 64897 | 5 |
| B | 0 | 45890 | 1 |
| C | 0 | 47336 | 1 |
| D | 0 | 76726 | 1 |
| Mode SS | |||
|---|---|---|---|
| Quadrant | BADHDUFLAG | Total packets | Discarded packets |
| A | 0 | 430 | 0 |
| B | 0 | 430 | 0 |
| C | 0 | 430 | 0 |
| D | 0 | 430 | 0 |
| Mode M9 | |||
|---|---|---|---|
| Quadrant | BADHDUFLAG | Total packets | Discarded packets |
| A | 0 | 10 | 0 |
| B | 0 | 10 | 0 |
| C | 0 | 10 | 0 |
| D | 0 | 10 | 0 |
| Quadrant | Total seconds | Saturated seconds | Saturation percentage |
|---|---|---|---|
| A | 21511 | 301 | 1.399284% |
| B | 21513 | 194 | 0.901780% |
| C | 21513 | 284 | 1.320132% |
| D | 21514 | 2872 | 13.349447% |
Noise dominated data is calculated using 1-second bins in cleaned event files. If a bin has >2000 counts, and if more than 50% of those come from <1% of pixels, then it is considered to be noise-dominated and hence unusable.
| Quadrant | # 1 sec bins | Bins with >0 counts | Bins with >2000 counts | High rate bins dominated by noise | Noise dominated (total time) | Noise dominated (detector-on time) | Marked lightcurve |
|---|---|---|---|---|---|---|---|
| A | 44364 | 21513 | 50 | 50 | 0.11% | 0.23% | 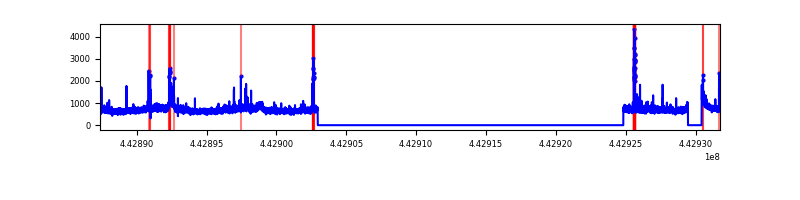 |
| B | 44364 | 21515 | 58 | 58 | 0.13% | 0.27% | 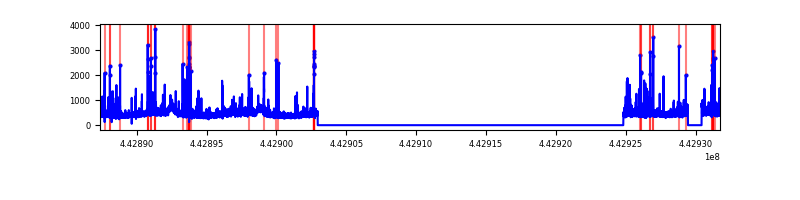 |
| C | 44364 | 21515 | 200 | 200 | 0.45% | 0.93% | 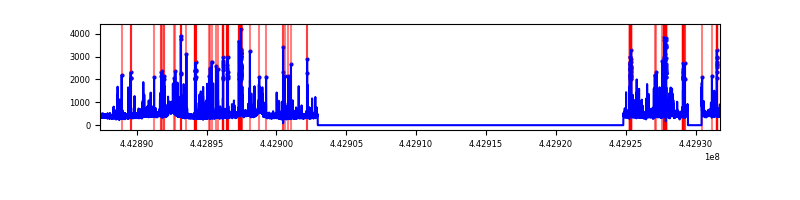 |
| D | 44365 | 21516 | 2350 | 2350 | 5.30% | 10.92% | 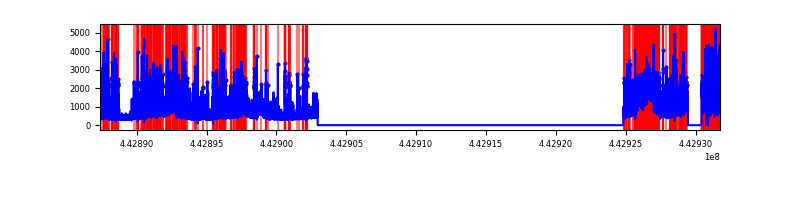 |
Top three noisy pixels from each quadrant. If the there are fewer than three noisy pixels in the level2.evt file, extra rows are filled as -1
| Pixel properties | Quadrant properties | ||||||
|---|---|---|---|---|---|---|---|
| Quadrant | DetID | PixID | Counts | Sigma | Mean | Median | Sigma |
| A | 10 | 83 | 6157191 | 12547.9 | 2372 | 2323 | 490.5 |
| A | 13 | 248 | 273481 | 552.81 | 2372 | 2323 | 490.5 |
| A | 3 | 137 | 27690 | 51.72 | 2372 | 2323 | 490.5 |
| B | 5 | 255 | 278409 | 596.04 | 2365 | 2290 | 463.3 |
| B | 0 | 155 | 115069 | 243.45 | 2365 | 2290 | 463.3 |
| B | 0 | 183 | 95962 | 202.2 | 2365 | 2290 | 463.3 |
| C | 1 | 3 | 663010 | 1208.22 | 2317 | 2322 | 546.8 |
| C | 12 | 250 | 388875 | 706.9 | 2317 | 2322 | 546.8 |
| C | 14 | 254 | 179176 | 323.42 | 2317 | 2322 | 546.8 |
| D | 13 | 174 | 3625938 | 6584.49 | 2193 | 2124 | 550.4 |
| D | 5 | 235 | 2757312 | 5006.2 | 2193 | 2124 | 550.4 |
| D | 1 | 52 | 1696403 | 3078.52 | 2193 | 2124 | 550.4 |
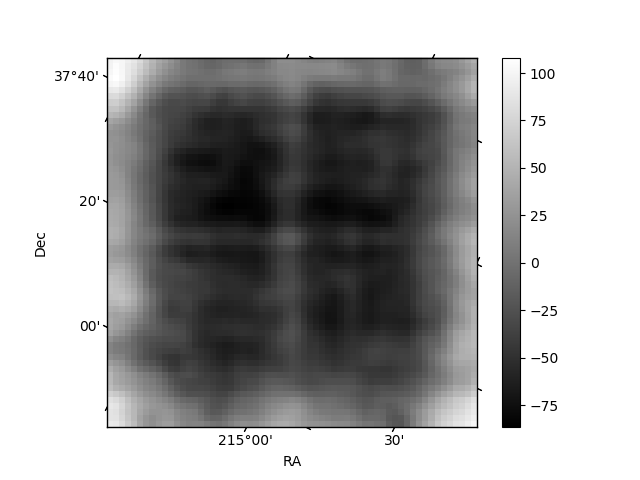
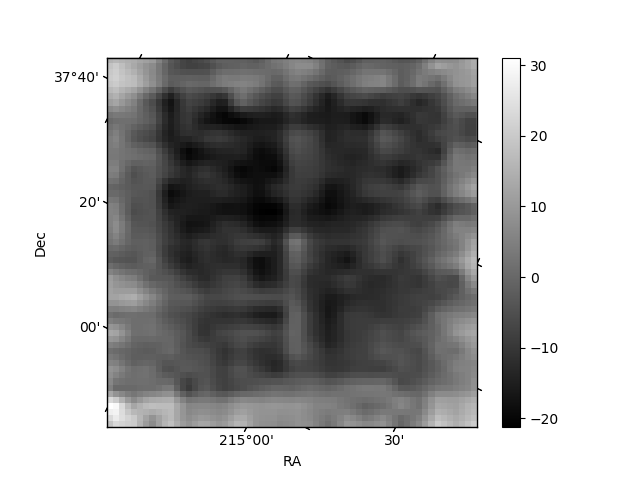
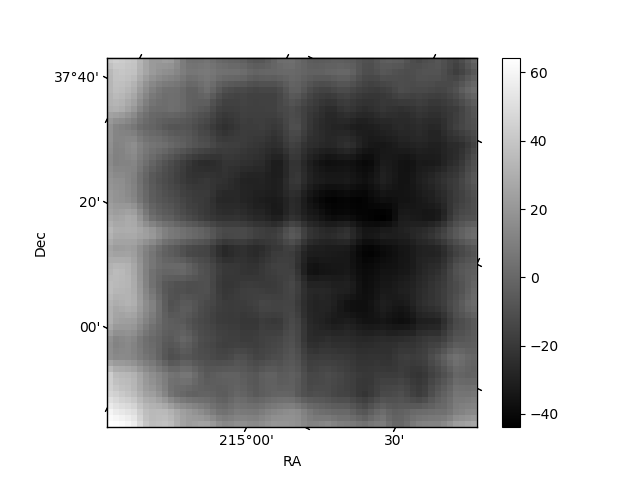
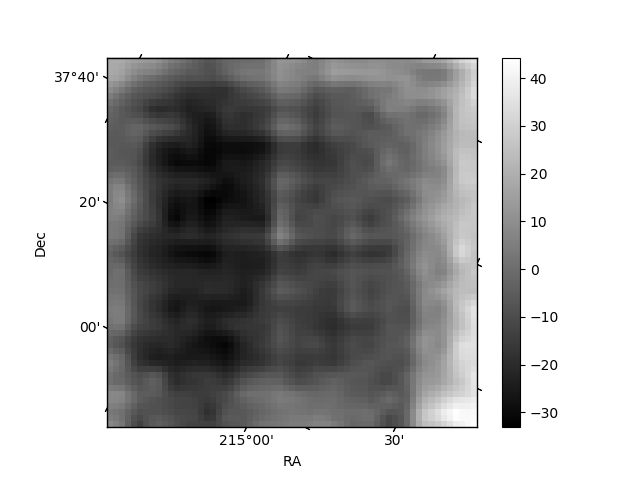
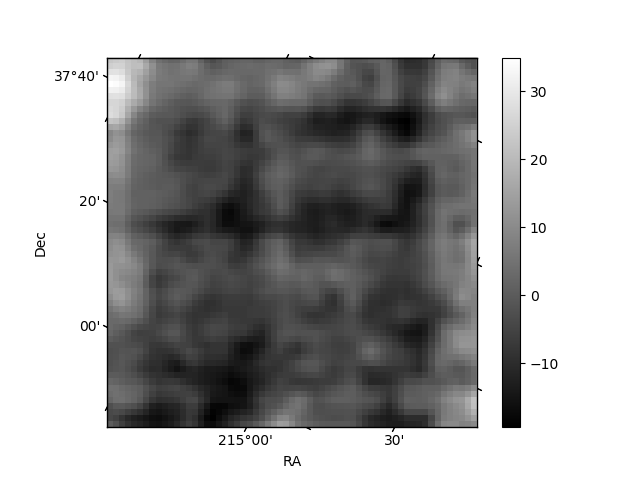
Histogram calculated using DETX and DETY for each event in the final _common_clean file
| Quadrant A | 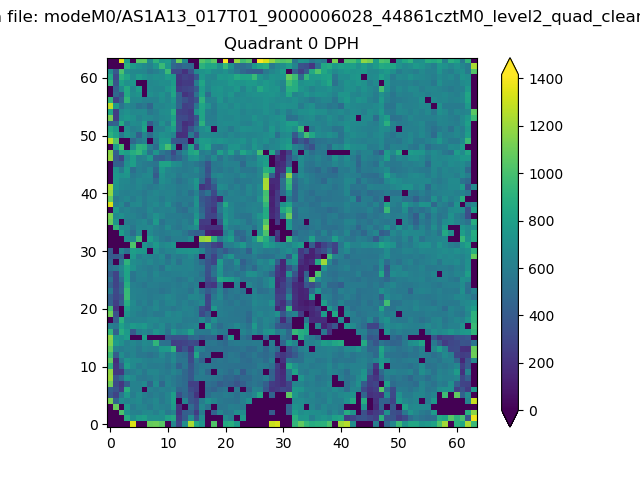 |
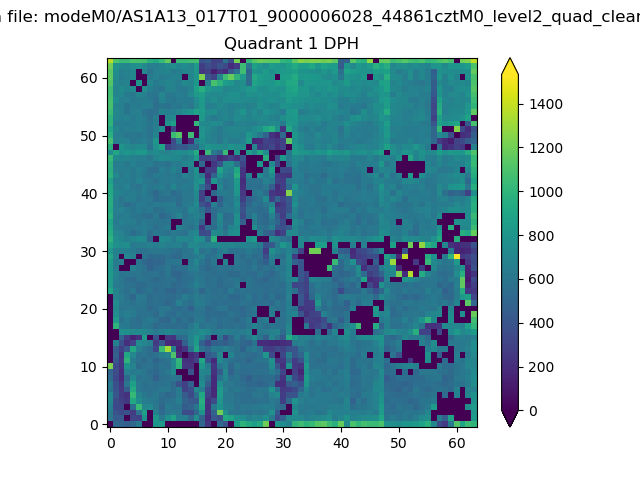 |
Quadrant B |
|---|---|---|---|
| Quadrant D | 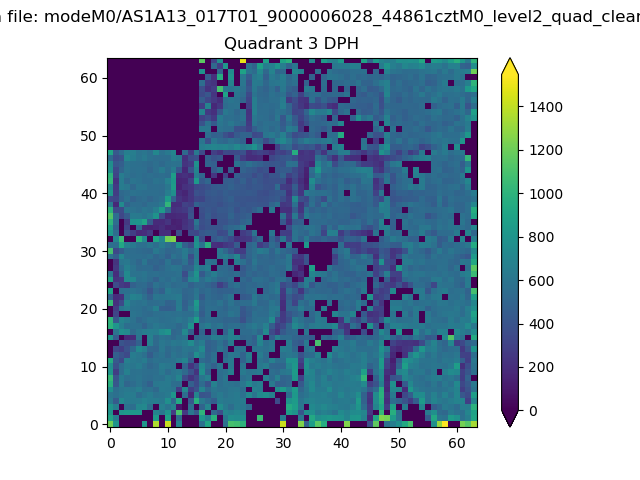 |
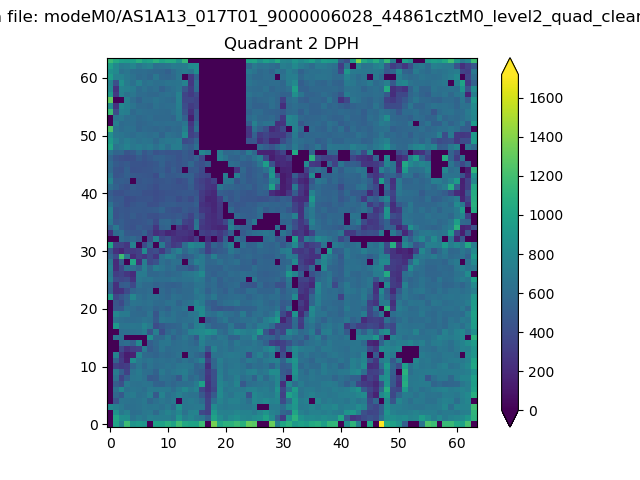 |
Quadrant C |
| Plot type | Count rate plots | Images |
|---|---|---|
| Comparison with Poisson distribution Blue bars denote a histogram of data divided into 1 sec bins. Red curve is a Poisson curve with rate = median count rate of data. |
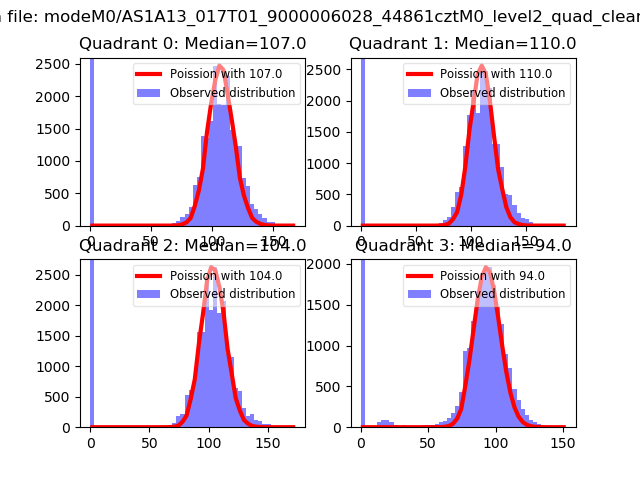 |
 |
| Quadrant-wise count rates Data is divided into 100 sec bins |
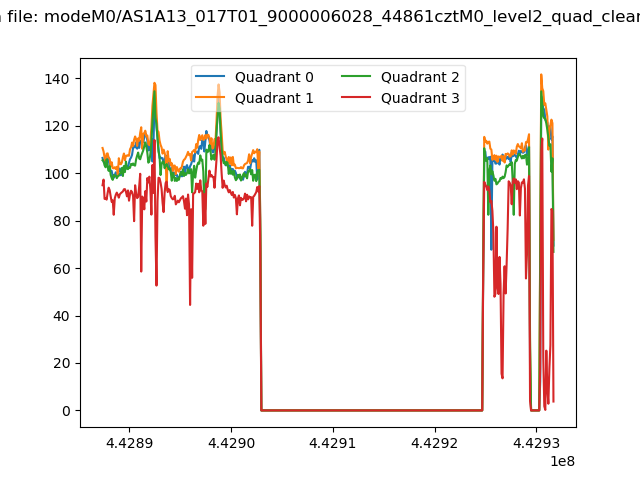 |
|
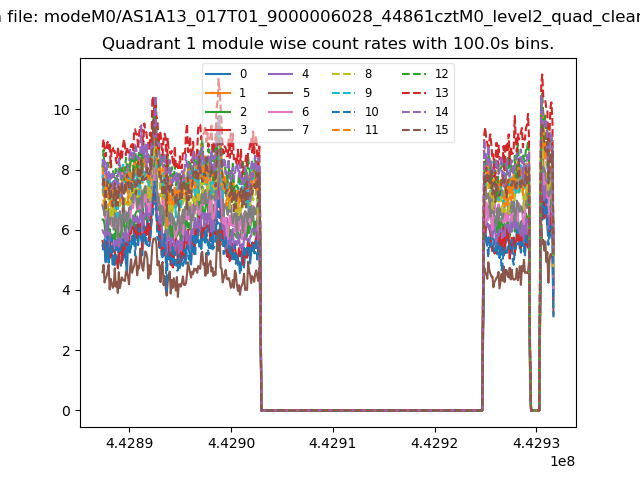
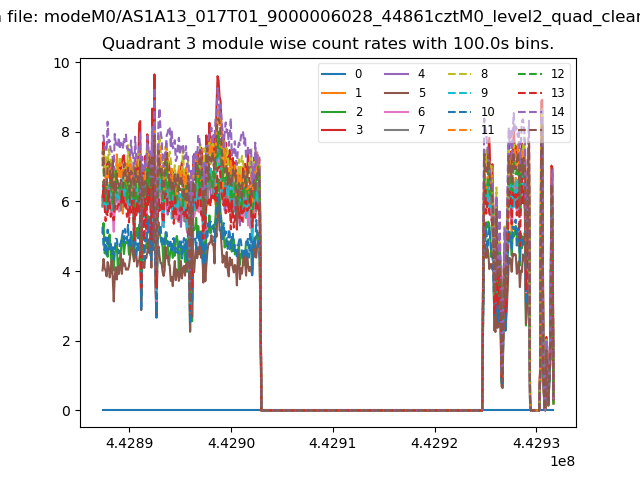
| Module-wise count rates for Quadrant A Data is divided into 100 sec bins |
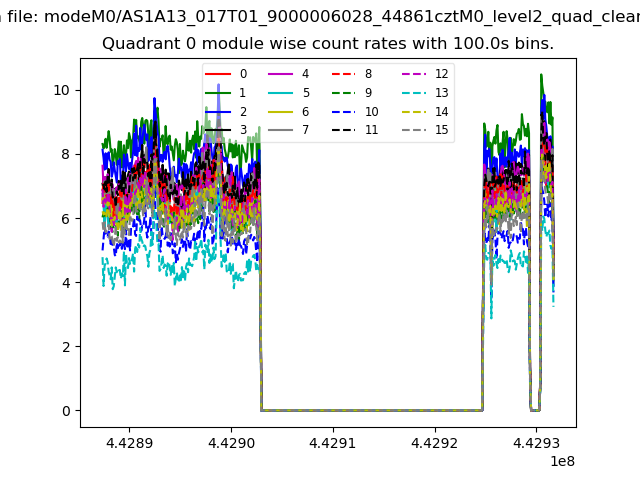 |
 |
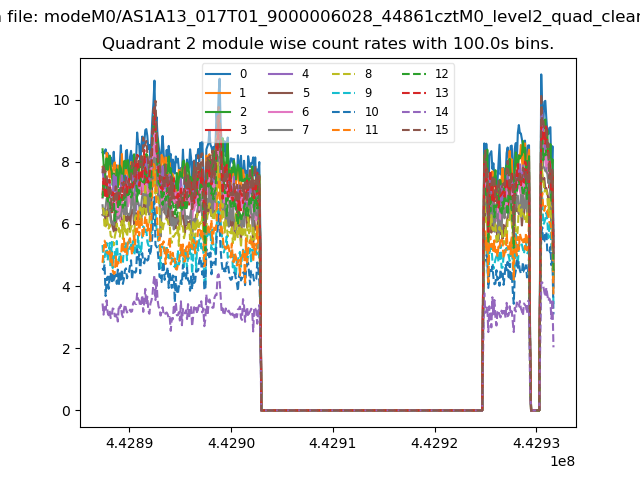
| Module-wise count rates for Quadrant B Data is divided into 100 sec bins |
 |
 |
| Module-wise count rates for Quadrant C Data is divided into 100 sec bins |
 |
 |
| Module-wise count rates for Quadrant D Data is divided into 100 sec bins |
 |
 |
| Parameter | Plot |
|---|---|
| CZT HV Monitor | 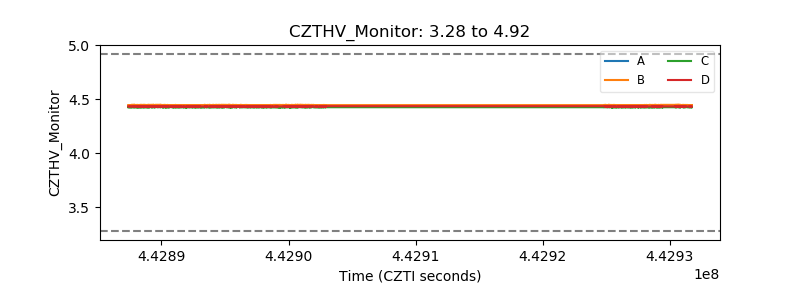 |
| D_VDD | 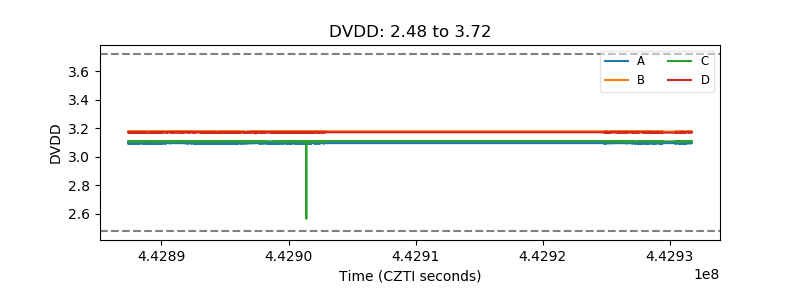 |
| Temperature 1 | 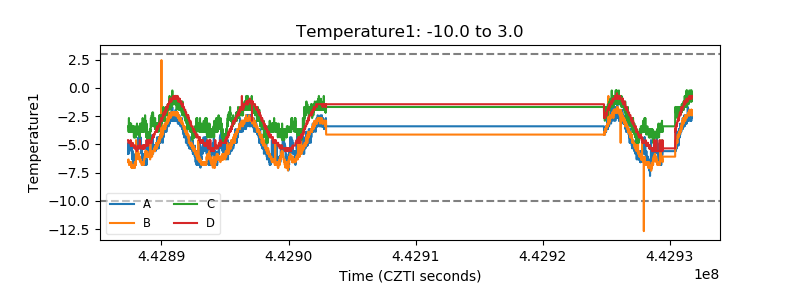 |
| Veto HV Monitor |  |
| Veto LLD | 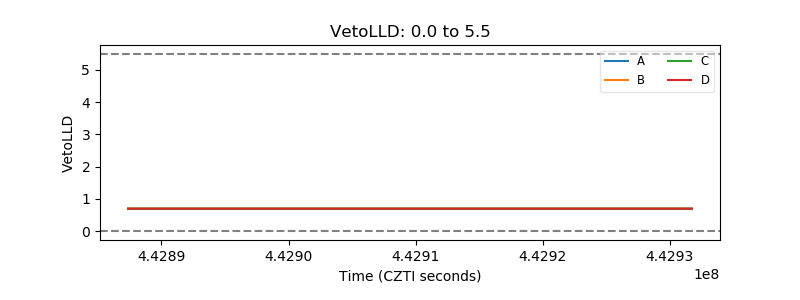 |
| Alpha Counter | 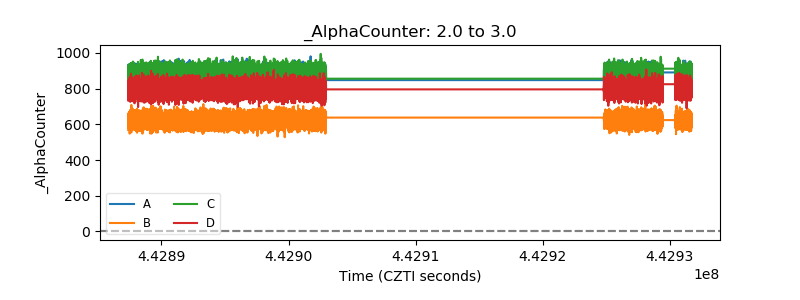 |
| _CPM_Rate | 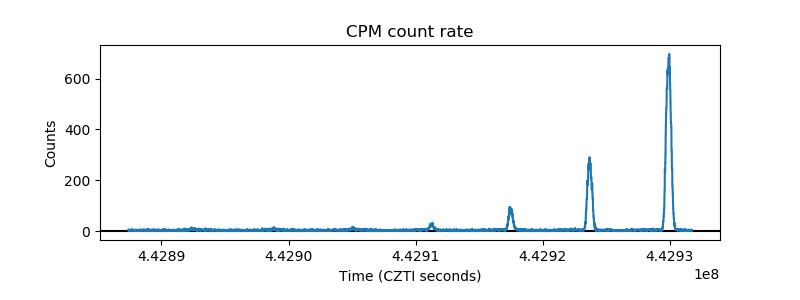 |
| CZT Counter | 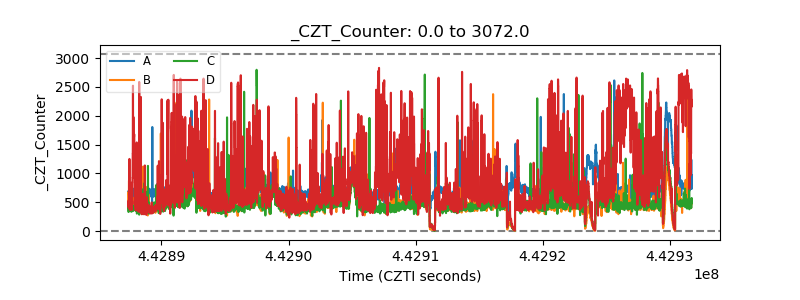 |
| +2.5 Volts monitor | 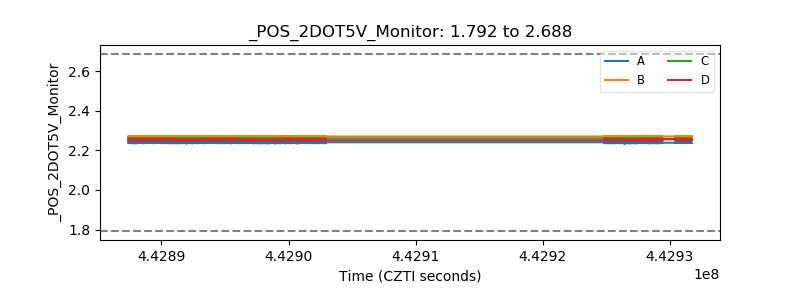 |
| +5 Volts monitor | 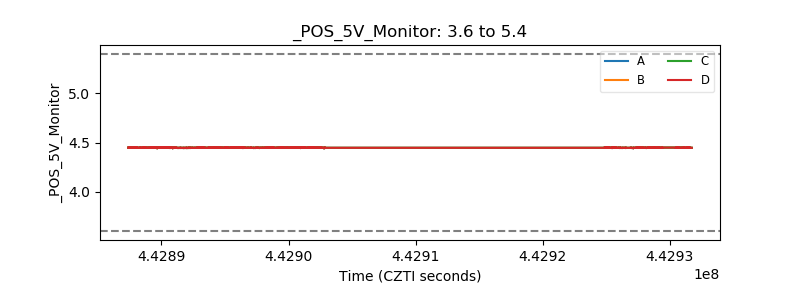 |
| _ROLL_ROT |  |
| _Roll_DEC | 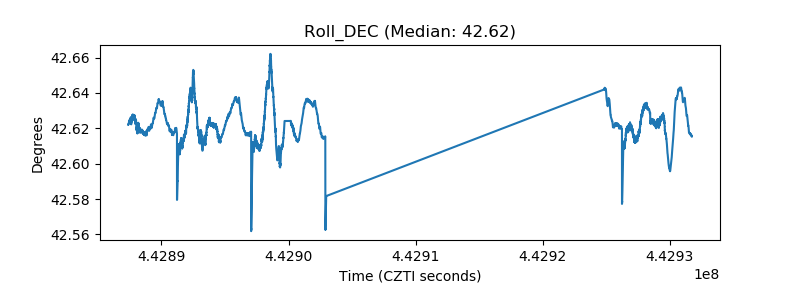 |
| _Roll_RA | 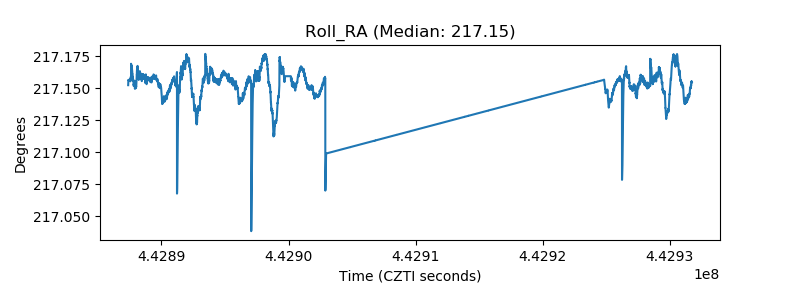 |
| Veto Counter |  |