| Param | Original file | Final file |
|---|---|---|
| Filename | modeM0/AS1A13_017T01_9000006028_44864cztM0_level2.fits | modeM0/AS1A13_017T01_9000006028_44864cztM0_level2_quad_clean.evt |
| Size (bytes) | 490,224,960 | 110,033,280 |
| Size | 467.5 MB | 104.9 MB |
| Events in quadrant A | 5,000,685 | 748,772 |
| Events in quadrant B | 3,290,742 | 775,182 |
| Events in quadrant C | 3,316,360 | 732,568 |
| Events in quadrant D | 6,058,386 | 642,950 |
| Mode M0 | |||
|---|---|---|---|
| Quadrant | BADHDUFLAG | Total packets | Discarded packets |
| A | 0 | 19687 | 1 |
| B | 0 | 13867 | 1 |
| C | 0 | 13918 | 1 |
| D | 0 | 22363 | 1 |
| Mode SS | |||
|---|---|---|---|
| Quadrant | BADHDUFLAG | Total packets | Discarded packets |
| A | 0 | 124 | 0 |
| B | 0 | 124 | 0 |
| C | 0 | 124 | 0 |
| D | 0 | 124 | 0 |
| Mode M9 | |||
|---|---|---|---|
| Quadrant | BADHDUFLAG | Total packets | Discarded packets |
| A | 0 | 11 | 0 |
| B | 0 | 11 | 0 |
| C | 0 | 11 | 0 |
| D | 0 | 11 | 0 |
| Quadrant | Total seconds | Saturated seconds | Saturation percentage |
|---|---|---|---|
| A | 6195 | 186 | 3.002421% |
| B | 6195 | 121 | 1.953188% |
| C | 6196 | 122 | 1.969012% |
| D | 6195 | 469 | 7.570621% |
Noise dominated data is calculated using 1-second bins in cleaned event files. If a bin has >2000 counts, and if more than 50% of those come from <1% of pixels, then it is considered to be noise-dominated and hence unusable.
| Quadrant | # 1 sec bins | Bins with >0 counts | Bins with >2000 counts | High rate bins dominated by noise | Noise dominated (total time) | Noise dominated (detector-on time) | Marked lightcurve |
|---|---|---|---|---|---|---|---|
| A | 7370 | 6196 | 20 | 20 | 0.27% | 0.32% | 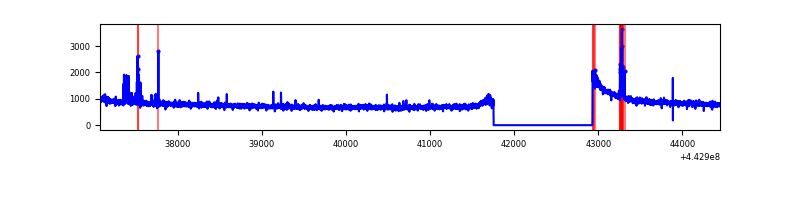 |
| B | 7370 | 6196 | 18 | 18 | 0.24% | 0.29% | 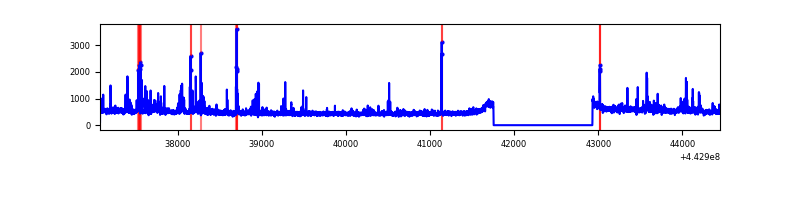 |
| C | 7371 | 6197 | 38 | 38 | 0.52% | 0.61% | 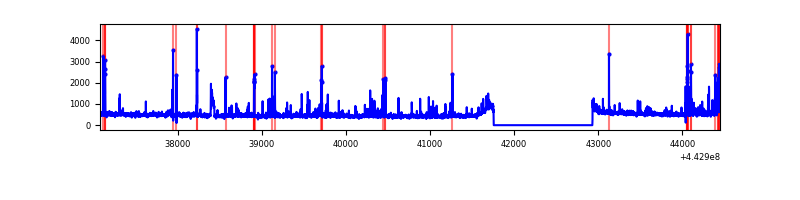 |
| D | 7370 | 6196 | 313 | 313 | 4.25% | 5.05% | 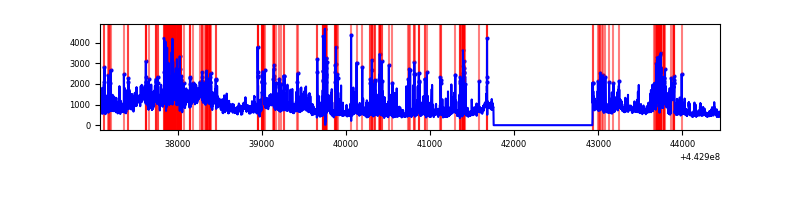 |
Top three noisy pixels from each quadrant. If the there are fewer than three noisy pixels in the level2.evt file, extra rows are filled as -1
| Pixel properties | Quadrant properties | ||||||
|---|---|---|---|---|---|---|---|
| Quadrant | DetID | PixID | Counts | Sigma | Mean | Median | Sigma |
| A | 10 | 83 | 2013157 | 13044.17 | 746 | 731 | 154.3 |
| A | 13 | 248 | 72993 | 468.39 | 746 | 731 | 154.3 |
| A | 10 | 248 | 17374 | 107.88 | 746 | 731 | 154.3 |
| B | 5 | 255 | 181743 | 1235.05 | 745 | 724 | 146.6 |
| B | 0 | 183 | 58051 | 391.13 | 745 | 724 | 146.6 |
| B | 0 | 168 | 44147 | 296.26 | 745 | 724 | 146.6 |
| C | 14 | 254 | 167389 | 970.51 | 739 | 744 | 171.7 |
| C | 0 | 64 | 89329 | 515.9 | 739 | 744 | 171.7 |
| C | 12 | 2 | 73077 | 421.26 | 739 | 744 | 171.7 |
| D | 13 | 187 | 1220036 | 6734.6 | 723 | 701 | 181.1 |
| D | 2 | 249 | 500999 | 2763.23 | 723 | 701 | 181.1 |
| D | 13 | 174 | 454174 | 2504.61 | 723 | 701 | 181.1 |
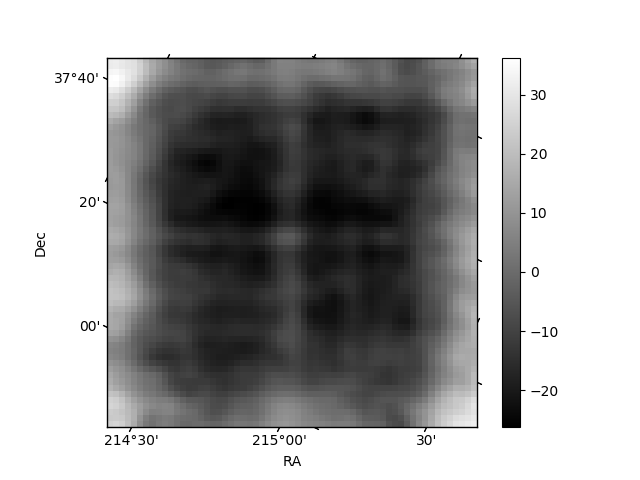
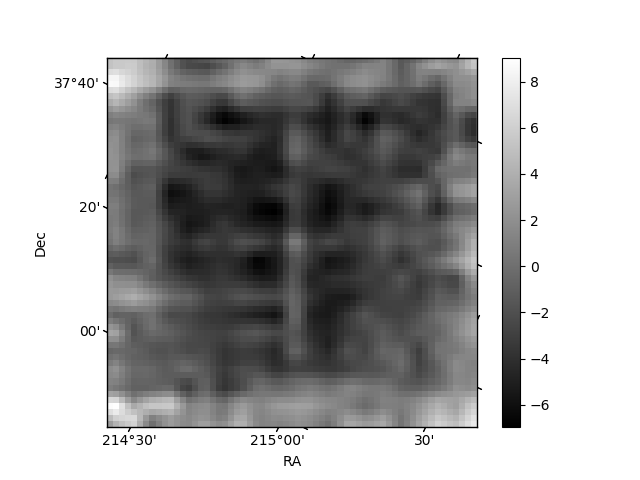
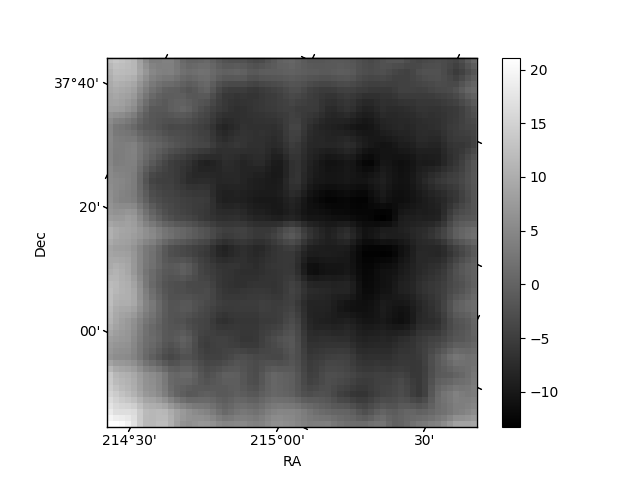
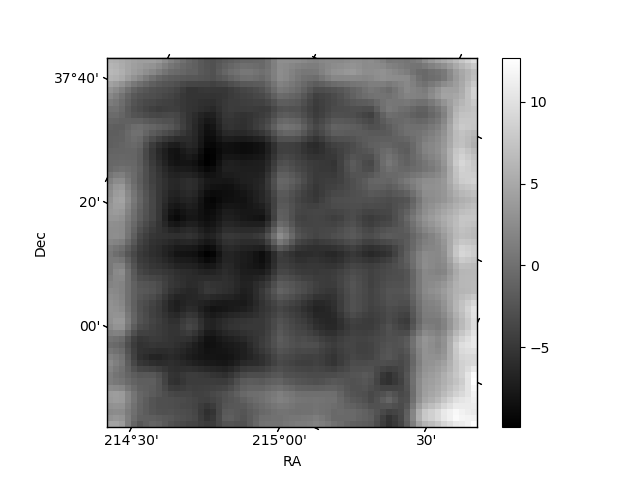
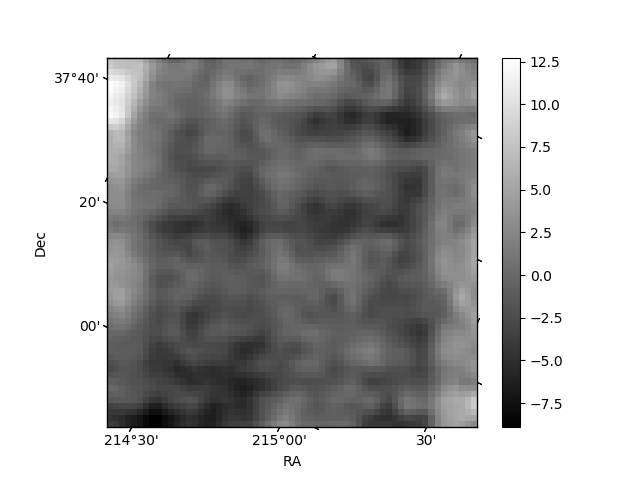
Histogram calculated using DETX and DETY for each event in the final _common_clean file
| Quadrant A | 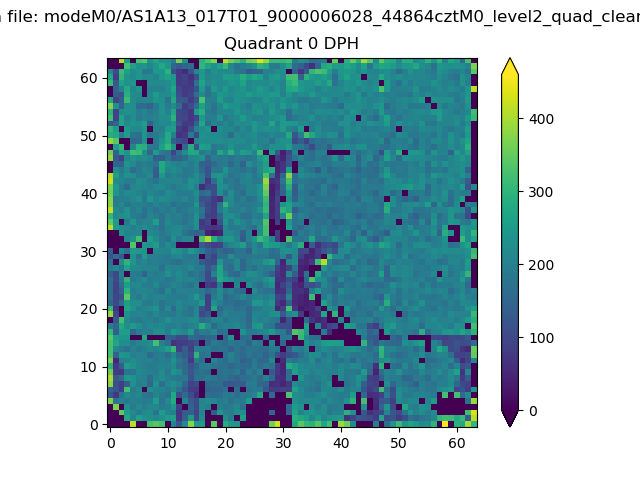 |
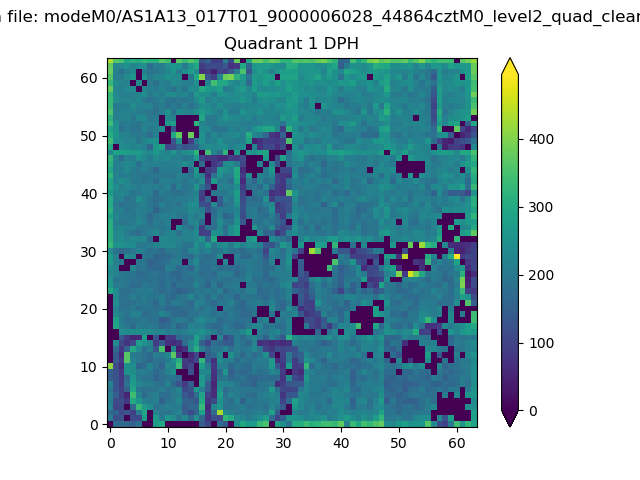 |
Quadrant B |
|---|---|---|---|
| Quadrant D | 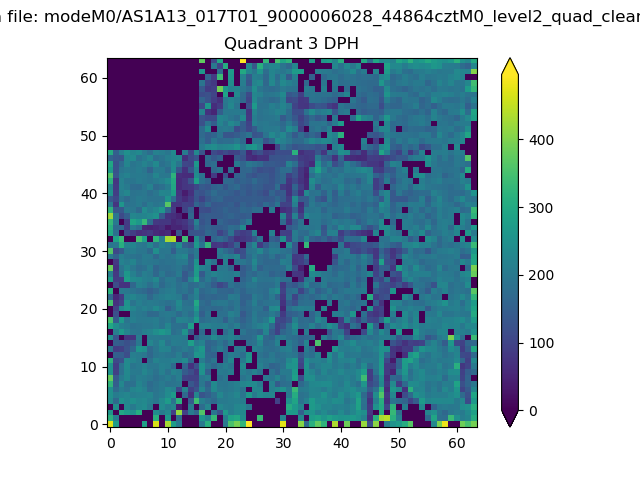 |
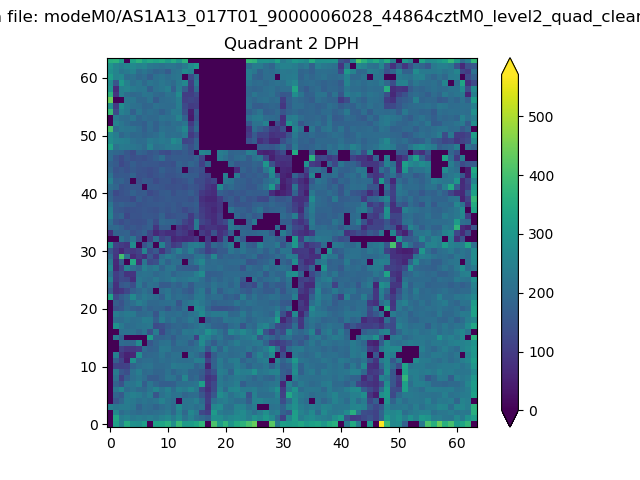 |
Quadrant C |
| Plot type | Count rate plots | Images |
|---|---|---|
| Comparison with Poisson distribution Blue bars denote a histogram of data divided into 1 sec bins. Red curve is a Poisson curve with rate = median count rate of data. |
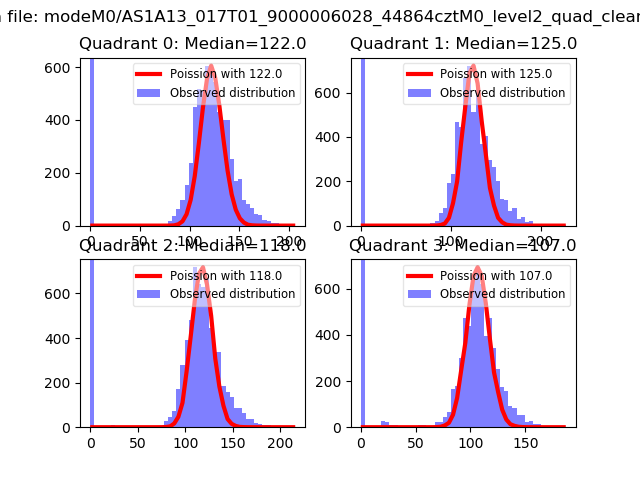 |
 |
| Quadrant-wise count rates Data is divided into 100 sec bins |
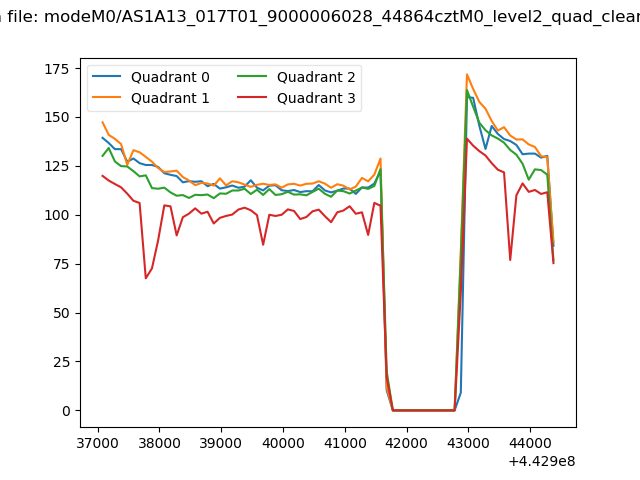 |
|
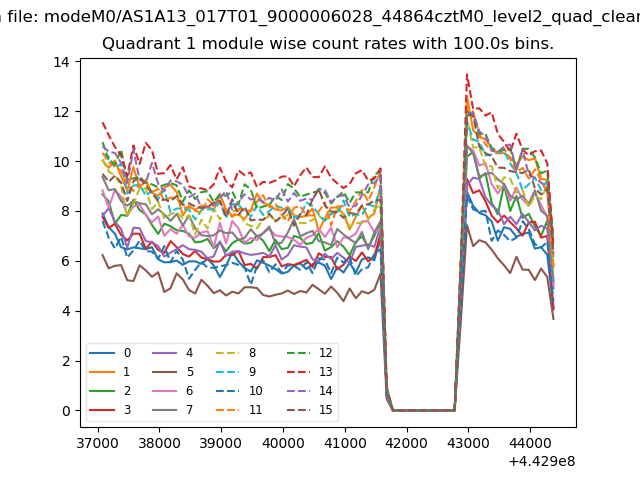
| Module-wise count rates for Quadrant A Data is divided into 100 sec bins |
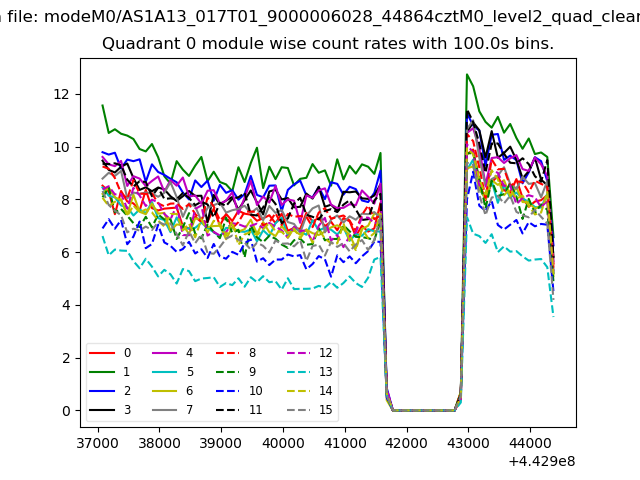 |
 |
| Module-wise count rates for Quadrant B Data is divided into 100 sec bins |
 |
 |
| Module-wise count rates for Quadrant C Data is divided into 100 sec bins |
 |
 |
| Module-wise count rates for Quadrant D Data is divided into 100 sec bins |
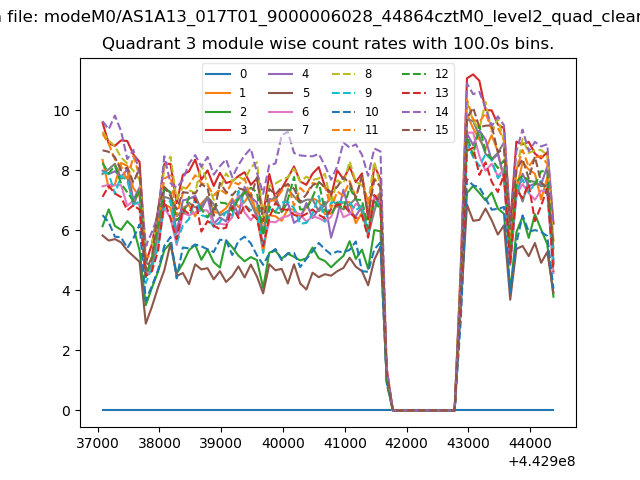 |
 |
| Parameter | Plot |
|---|---|
| CZT HV Monitor | 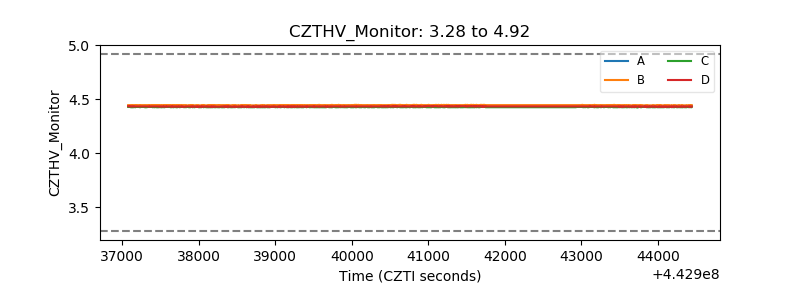 |
| D_VDD | 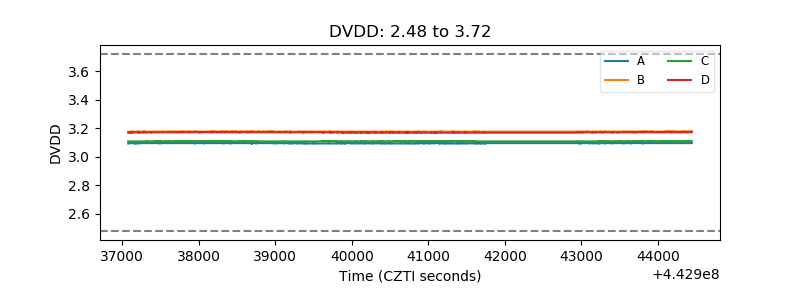 |
| Temperature 1 | 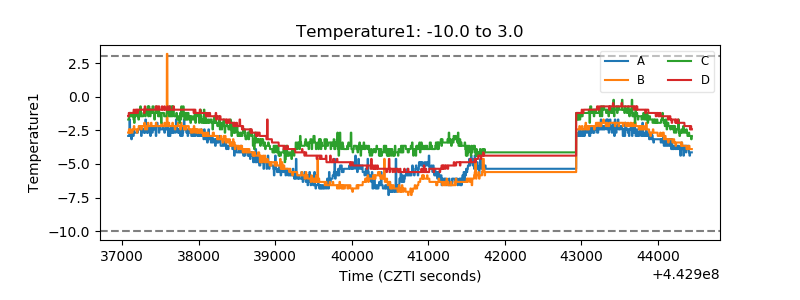 |
| Veto HV Monitor | 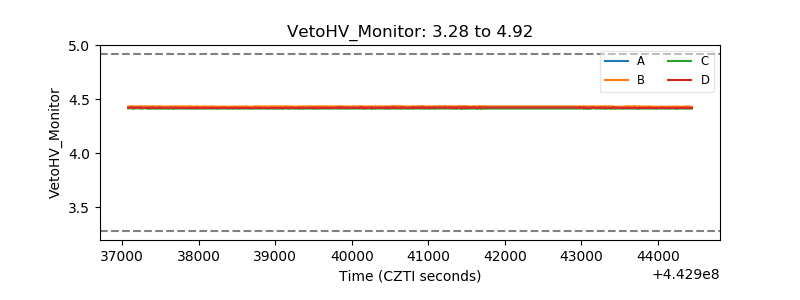 |
| Veto LLD | 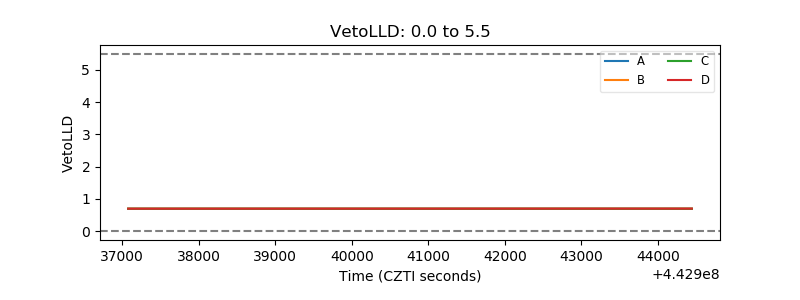 |
| Alpha Counter | 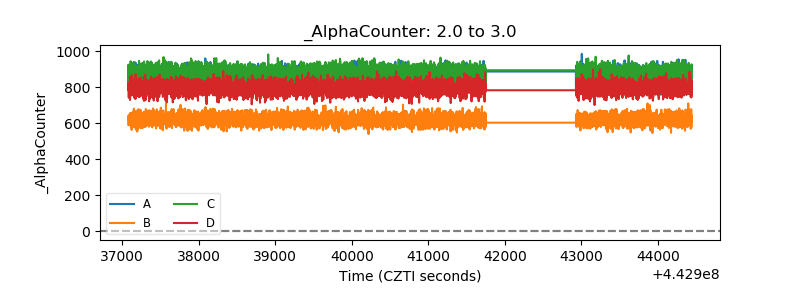 |
| _CPM_Rate | 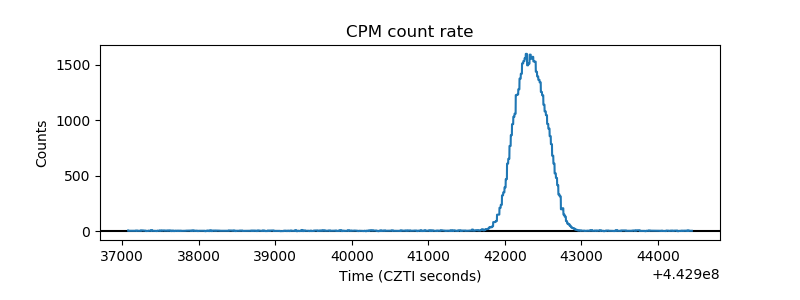 |
| CZT Counter | 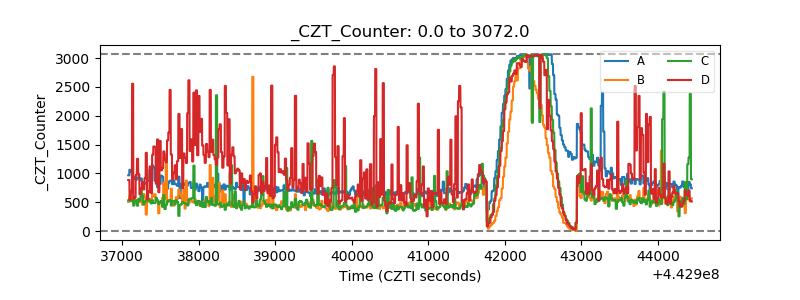 |
| +2.5 Volts monitor | 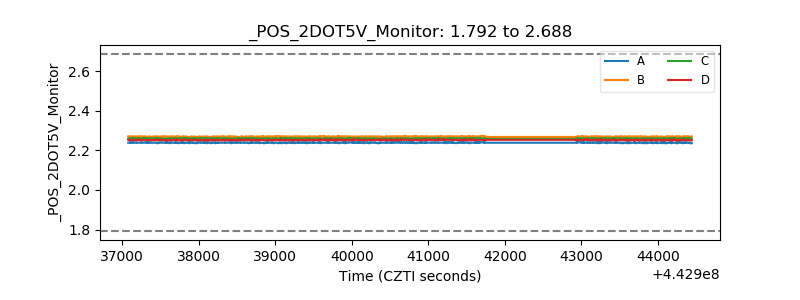 |
| +5 Volts monitor | 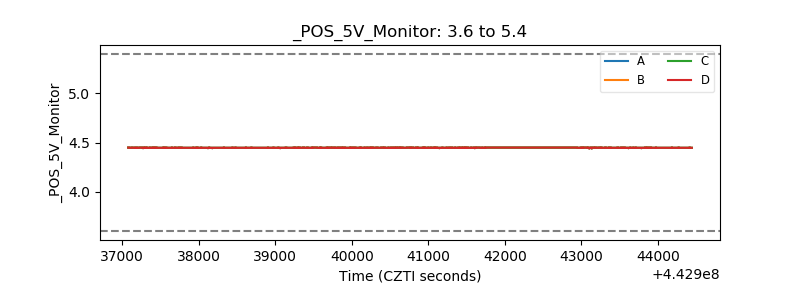 |
| _ROLL_ROT | 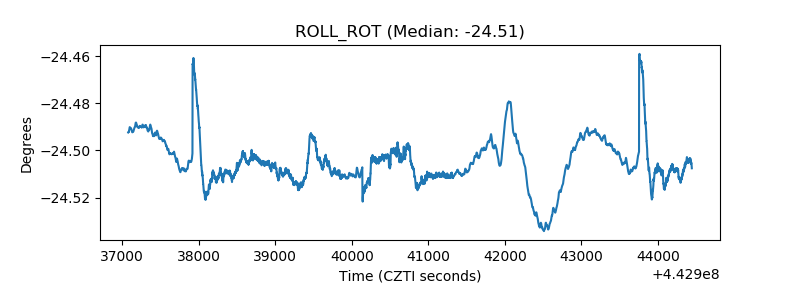 |
| _Roll_DEC | 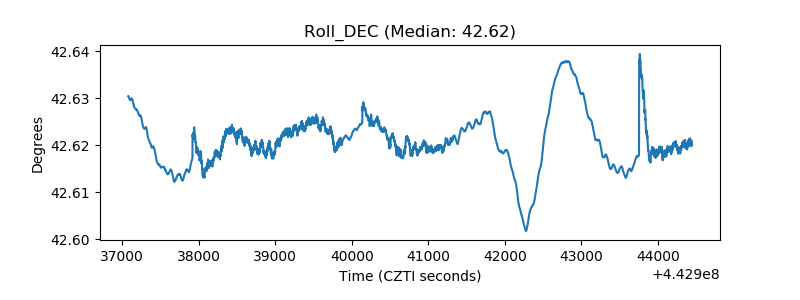 |
| _Roll_RA | 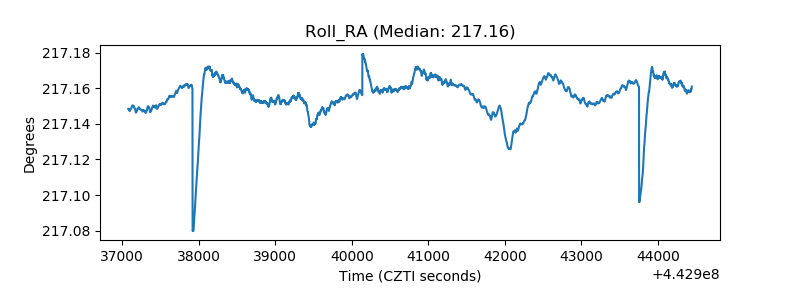 |
| Veto Counter | 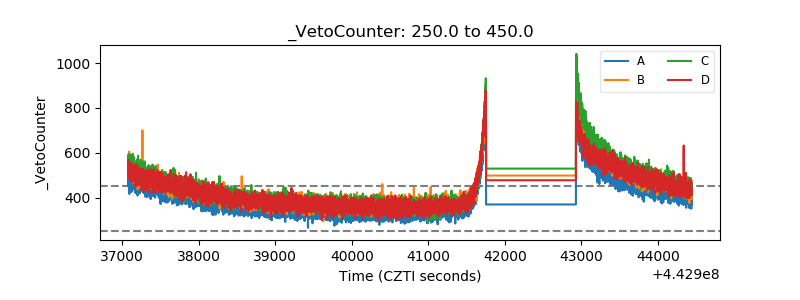 |