| Param | Original file | Final file |
|---|---|---|
| Filename | modeM0/AS1A13_017T01_9000006028_44865cztM0_level2.fits | modeM0/AS1A13_017T01_9000006028_44865cztM0_level2_quad_clean.evt |
| Size (bytes) | 502,104,960 | 115,557,120 |
| Size | 478.8 MB | 110.2 MB |
| Events in quadrant A | 5,388,021 | 787,617 |
| Events in quadrant B | 3,414,856 | 827,783 |
| Events in quadrant C | 3,537,781 | 780,146 |
| Events in quadrant D | 5,749,158 | 656,918 |
| Mode M0 | |||
|---|---|---|---|
| Quadrant | BADHDUFLAG | Total packets | Discarded packets |
| A | 0 | 20957 | 2 |
| B | 0 | 14385 | 2 |
| C | 0 | 14709 | 2 |
| D | 0 | 21527 | 2 |
| Mode SS | |||
|---|---|---|---|
| Quadrant | BADHDUFLAG | Total packets | Discarded packets |
| A | 0 | 132 | 0 |
| B | 0 | 132 | 0 |
| C | 0 | 132 | 0 |
| D | 0 | 132 | 0 |
| Mode M9 | |||
|---|---|---|---|
| Quadrant | BADHDUFLAG | Total packets | Discarded packets |
| A | 0 | 14 | 0 |
| B | 0 | 14 | 0 |
| C | 0 | 15 | 0 |
| D | 0 | 15 | 0 |
| Quadrant | Total seconds | Saturated seconds | Saturation percentage |
|---|---|---|---|
| A | 6398 | 284 | 4.438887% |
| B | 6398 | 161 | 2.516411% |
| C | 6398 | 200 | 3.125977% |
| D | 6397 | 712 | 11.130217% |
Noise dominated data is calculated using 1-second bins in cleaned event files. If a bin has >2000 counts, and if more than 50% of those come from <1% of pixels, then it is considered to be noise-dominated and hence unusable.
| Quadrant | # 1 sec bins | Bins with >0 counts | Bins with >2000 counts | High rate bins dominated by noise | Noise dominated (total time) | Noise dominated (detector-on time) | Marked lightcurve |
|---|---|---|---|---|---|---|---|
| A | 7588 | 6399 | 20 | 20 | 0.26% | 0.31% | 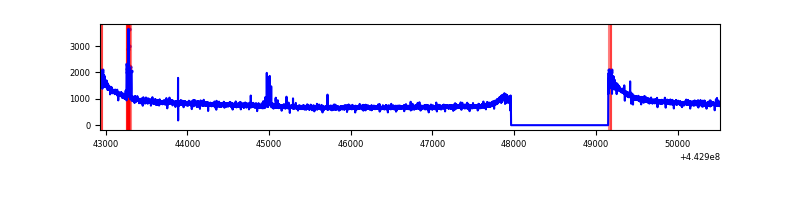 |
| B | 7588 | 6399 | 11 | 11 | 0.14% | 0.17% | 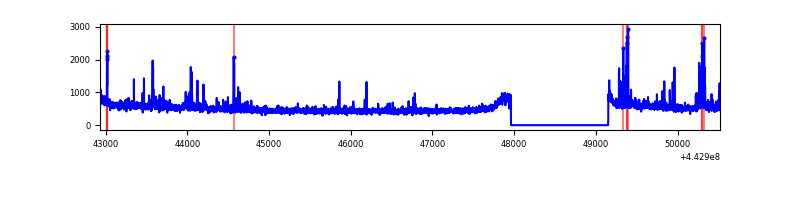 |
| C | 7588 | 6399 | 72 | 72 | 0.95% | 1.13% | 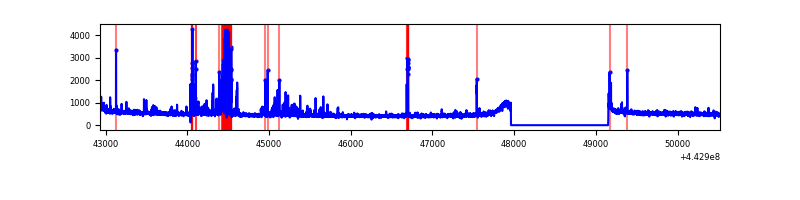 |
| D | 7587 | 6398 | 448 | 448 | 5.90% | 7.00% | 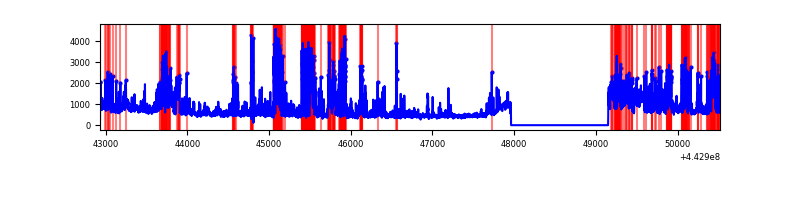 |
Top three noisy pixels from each quadrant. If the there are fewer than three noisy pixels in the level2.evt file, extra rows are filled as -1
| Pixel properties | Quadrant properties | ||||||
|---|---|---|---|---|---|---|---|
| Quadrant | DetID | PixID | Counts | Sigma | Mean | Median | Sigma |
| A | 10 | 83 | 2230150 | 13671.94 | 796 | 782 | 163.1 |
| A | 13 | 248 | 68051 | 412.54 | 796 | 782 | 163.1 |
| A | 13 | 254 | 9170 | 51.44 | 796 | 782 | 163.1 |
| B | 0 | 186 | 94973 | 607.31 | 797 | 772 | 155.1 |
| B | 0 | 168 | 53044 | 336.99 | 797 | 772 | 155.1 |
| B | 0 | 183 | 46294 | 293.48 | 797 | 772 | 155.1 |
| C | 14 | 254 | 309367 | 1679.05 | 791 | 797 | 183.8 |
| C | 12 | 250 | 48592 | 260.07 | 791 | 797 | 183.8 |
| C | 12 | 2 | 40007 | 213.36 | 791 | 797 | 183.8 |
| D | 2 | 249 | 1010158 | 5363.8 | 764 | 743 | 188.2 |
| D | 1 | 52 | 629698 | 3342.13 | 764 | 743 | 188.2 |
| D | 13 | 174 | 387213 | 2053.61 | 764 | 743 | 188.2 |
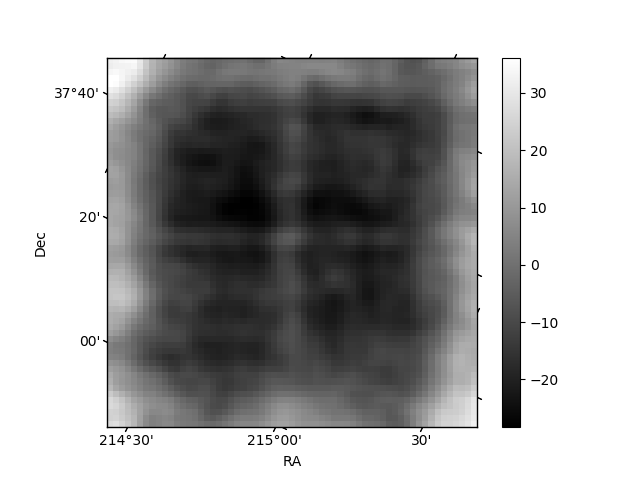
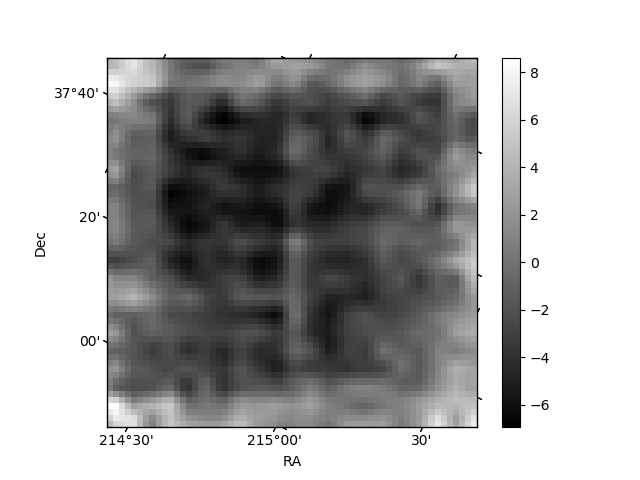
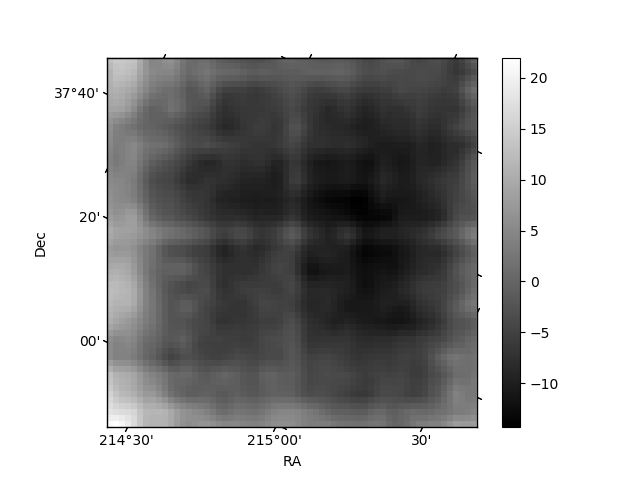
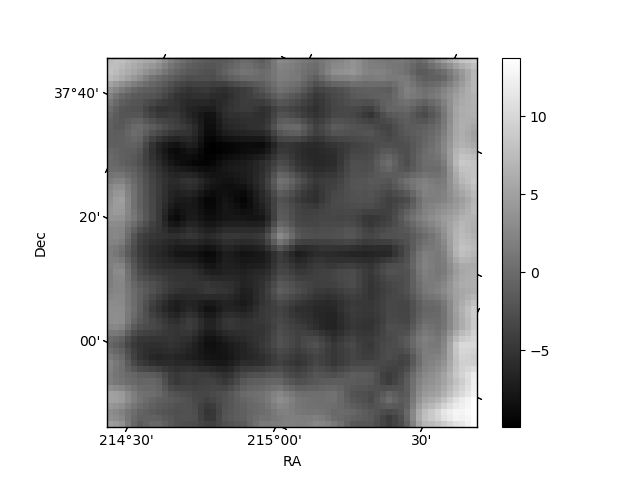
Histogram calculated using DETX and DETY for each event in the final _common_clean file
| Quadrant A | 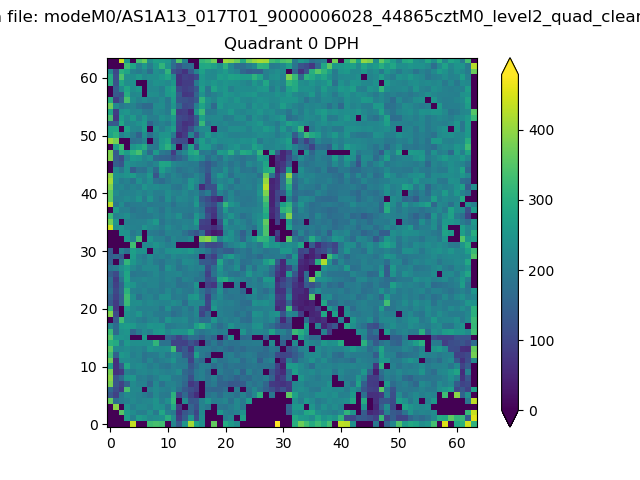 |
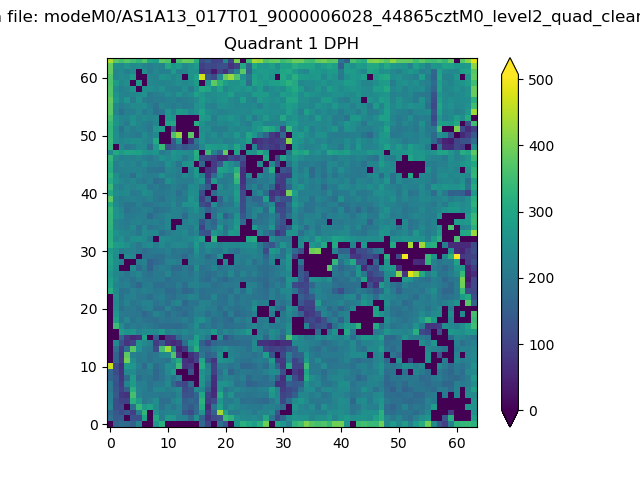 |
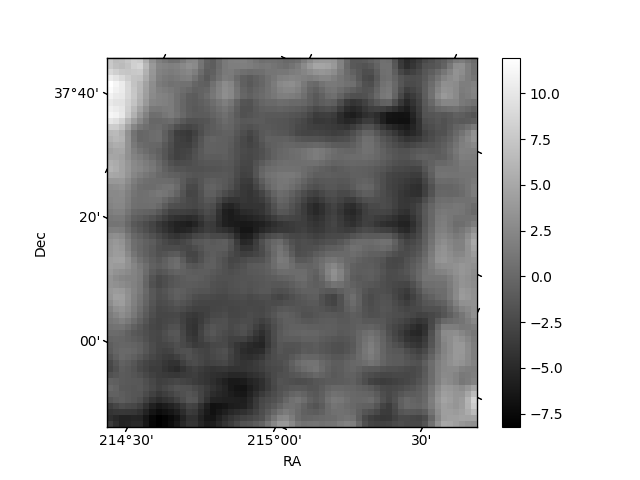
Quadrant B |
|---|---|---|---|
| Quadrant D | 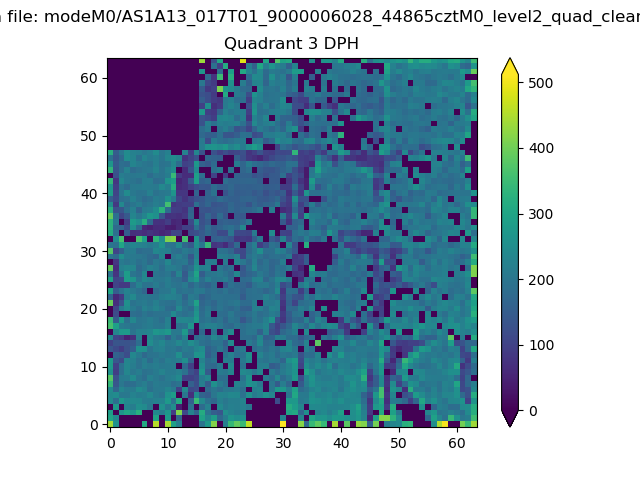 |
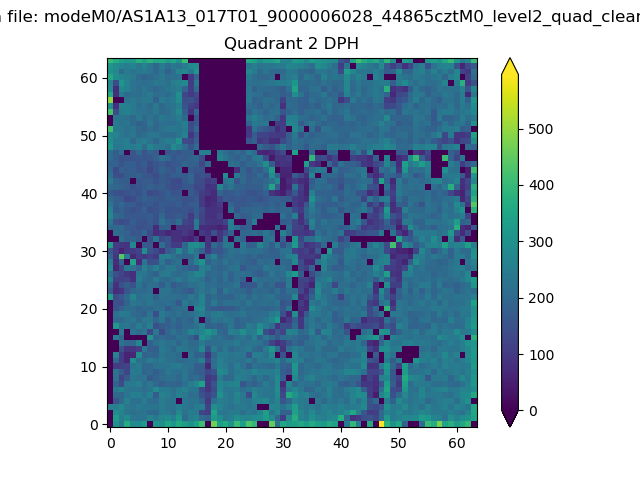 |
Quadrant C |
| Plot type | Count rate plots | Images |
|---|---|---|
| Comparison with Poisson distribution Blue bars denote a histogram of data divided into 1 sec bins. Red curve is a Poisson curve with rate = median count rate of data. |
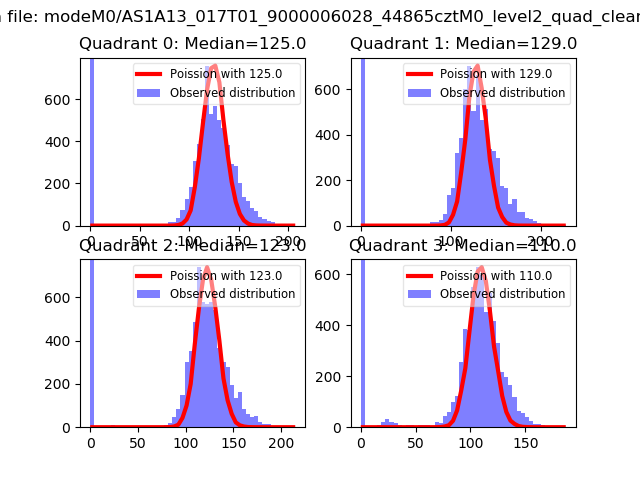 |
 |
| Quadrant-wise count rates Data is divided into 100 sec bins |
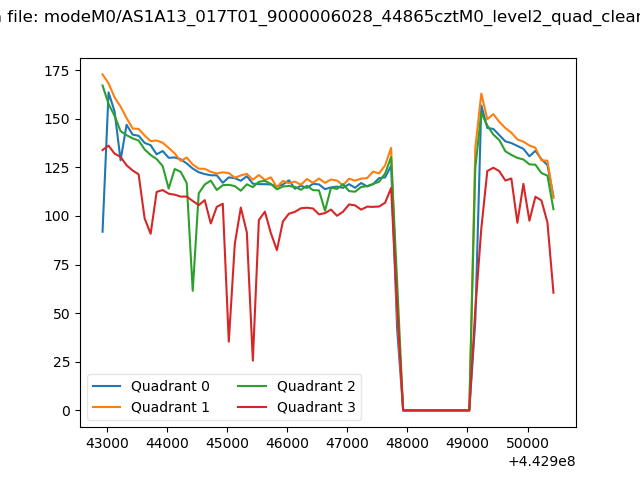 |
|
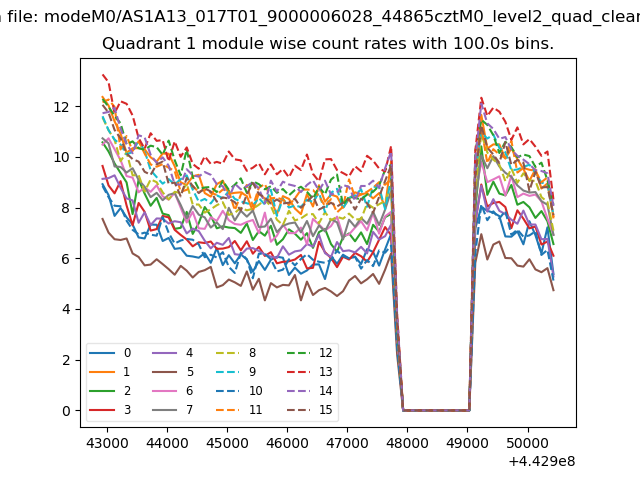
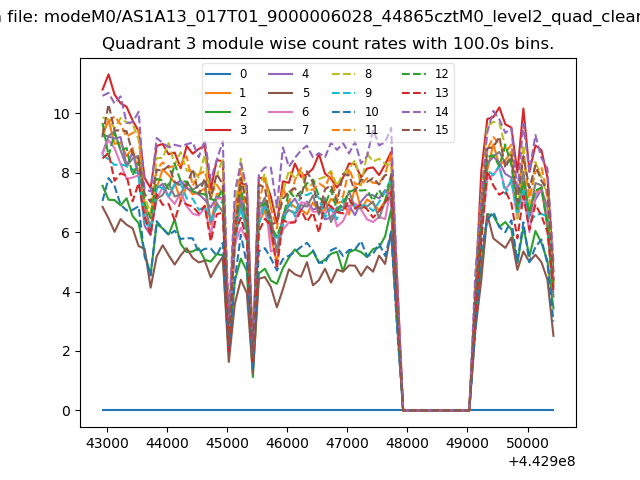
| Module-wise count rates for Quadrant A Data is divided into 100 sec bins |
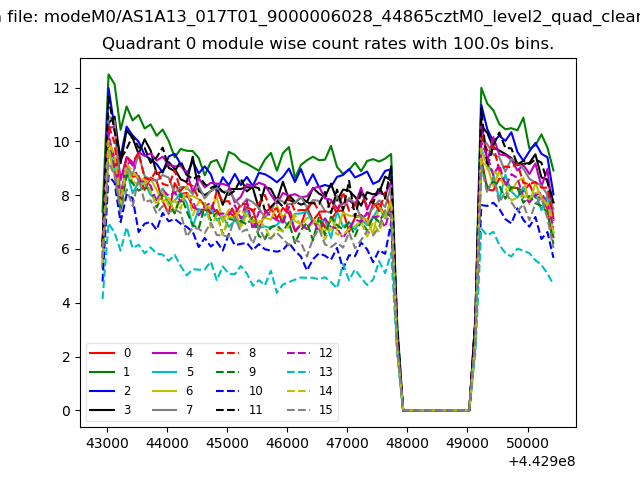 |
 |
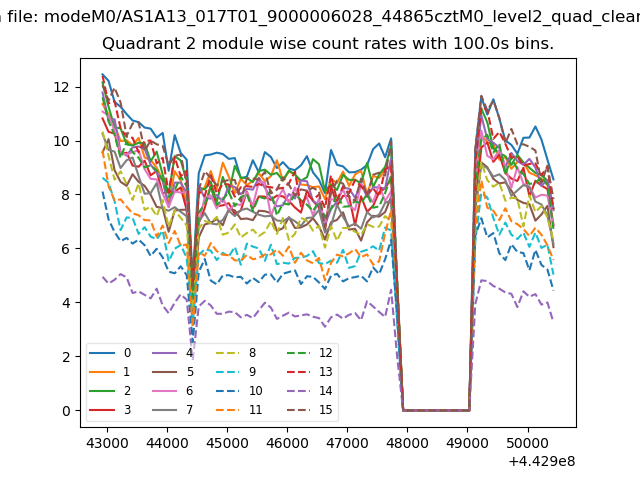
| Module-wise count rates for Quadrant B Data is divided into 100 sec bins |
 |
 |
| Module-wise count rates for Quadrant C Data is divided into 100 sec bins |
 |
 |
| Module-wise count rates for Quadrant D Data is divided into 100 sec bins |
 |
 |
| Parameter | Plot |
|---|---|
| CZT HV Monitor | 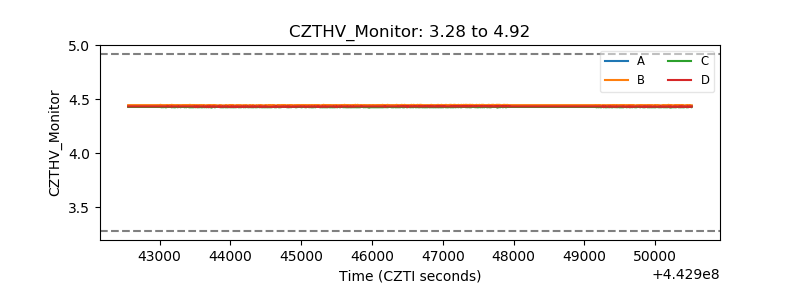 |
| D_VDD |  |
| Temperature 1 | 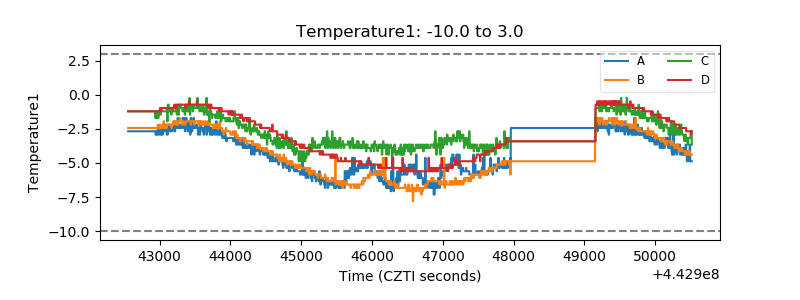 |
| Veto HV Monitor | 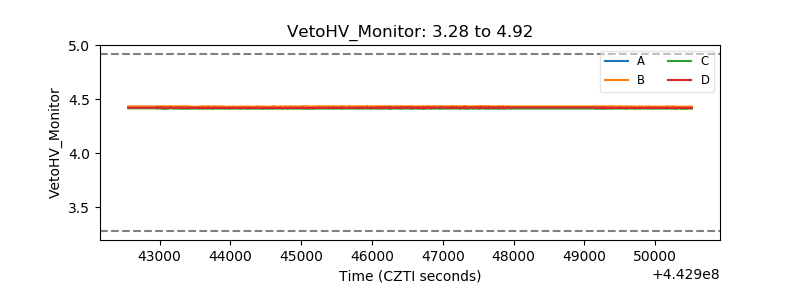 |
| Veto LLD | 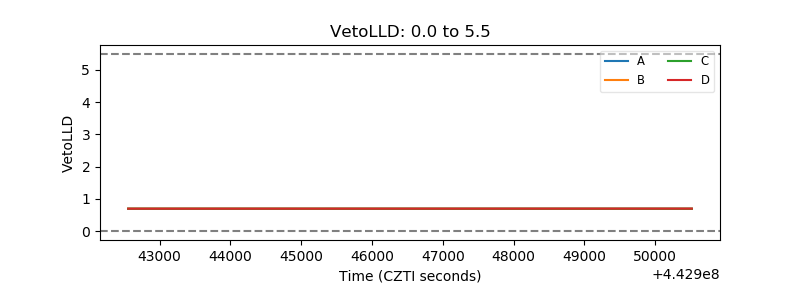 |
| Alpha Counter | 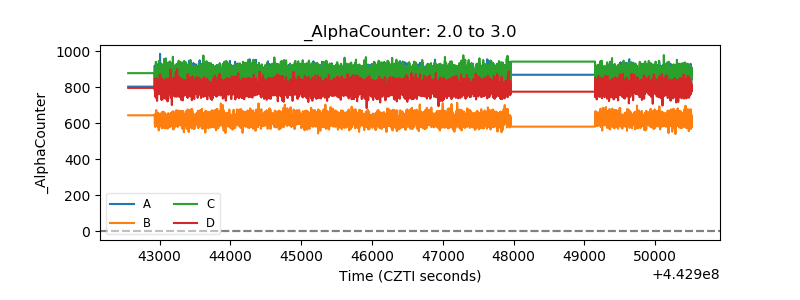 |
| _CPM_Rate | 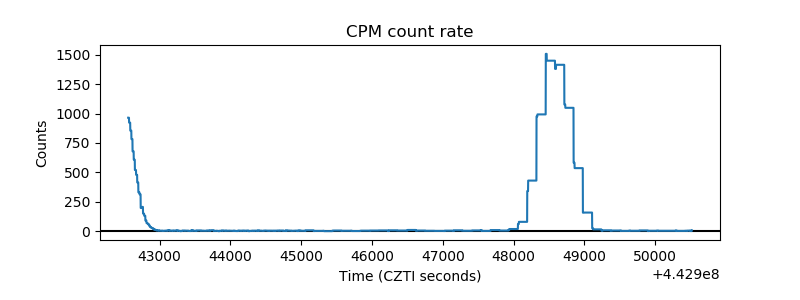 |
| CZT Counter | 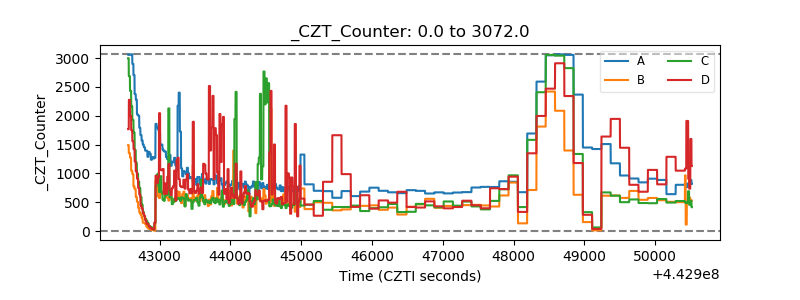 |
| +2.5 Volts monitor | 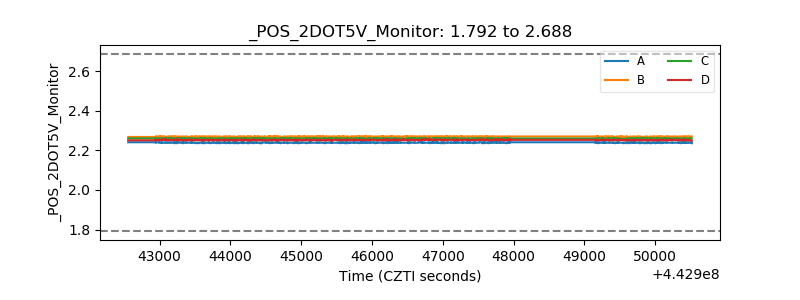 |
| +5 Volts monitor | 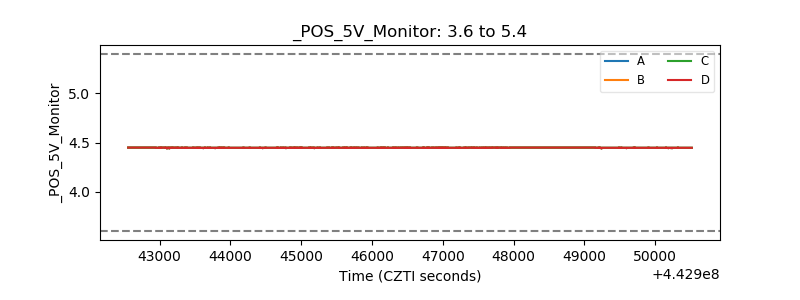 |
| _ROLL_ROT | 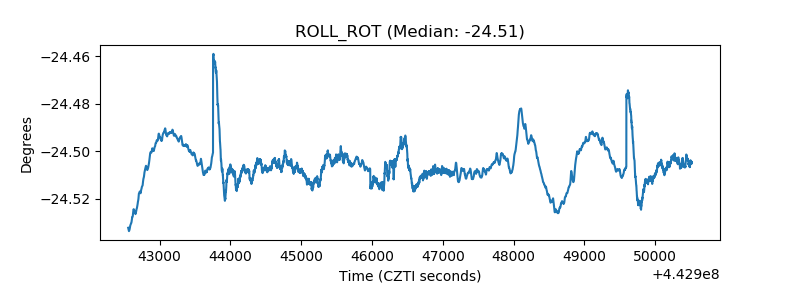 |
| _Roll_DEC | 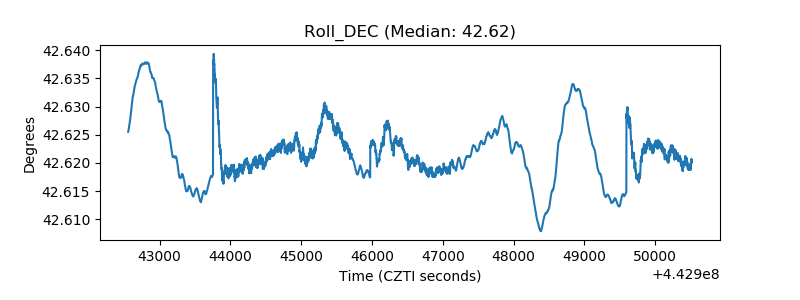 |
| _Roll_RA | 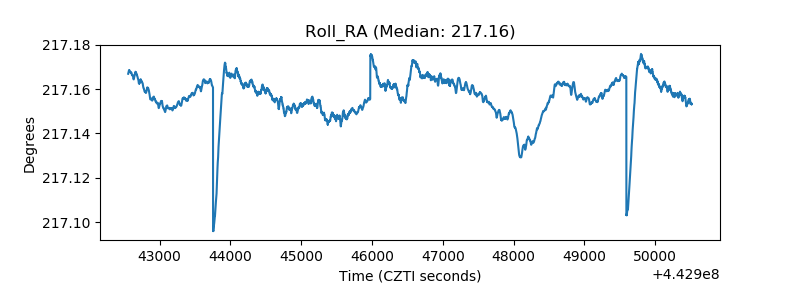 |
| Veto Counter | 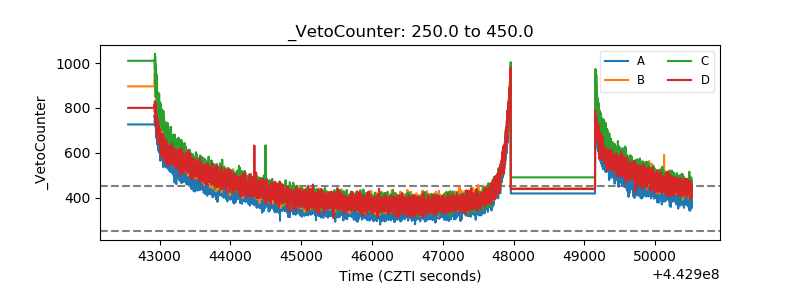 |