| Param | Original file | Final file |
|---|---|---|
| Filename | modeM0/AS1A13_017T01_9000006028_44866cztM0_level2.fits | modeM0/AS1A13_017T01_9000006028_44866cztM0_level2_quad_clean.evt |
| Size (bytes) | 513,881,280 | 112,389,120 |
| Size | 490.1 MB | 107.2 MB |
| Events in quadrant A | 5,226,626 | 759,698 |
| Events in quadrant B | 3,462,020 | 798,658 |
| Events in quadrant C | 3,496,970 | 759,137 |
| Events in quadrant D | 6,343,678 | 642,180 |
| Mode M0 | |||
|---|---|---|---|
| Quadrant | BADHDUFLAG | Total packets | Discarded packets |
| A | 0 | 20576 | 2 |
| B | 0 | 14543 | 2 |
| C | 0 | 14631 | 2 |
| D | 0 | 23290 | 2 |
| Mode SS | |||
|---|---|---|---|
| Quadrant | BADHDUFLAG | Total packets | Discarded packets |
| A | 0 | 130 | 0 |
| B | 0 | 130 | 0 |
| C | 0 | 130 | 0 |
| D | 0 | 130 | 0 |
| Mode M9 | |||
|---|---|---|---|
| Quadrant | BADHDUFLAG | Total packets | Discarded packets |
| A | 0 | 13 | 0 |
| B | 0 | 14 | 0 |
| C | 0 | 14 | 0 |
| D | 0 | 14 | 0 |
| Quadrant | Total seconds | Saturated seconds | Saturation percentage |
|---|---|---|---|
| A | 6355 | 270 | 4.248623% |
| B | 6355 | 176 | 2.769473% |
| C | 6355 | 162 | 2.549174% |
| D | 6355 | 744 | 11.707317% |
Noise dominated data is calculated using 1-second bins in cleaned event files. If a bin has >2000 counts, and if more than 50% of those come from <1% of pixels, then it is considered to be noise-dominated and hence unusable.
| Quadrant | # 1 sec bins | Bins with >0 counts | Bins with >2000 counts | High rate bins dominated by noise | Noise dominated (total time) | Noise dominated (detector-on time) | Marked lightcurve |
|---|---|---|---|---|---|---|---|
| A | 7535 | 6356 | 12 | 12 | 0.16% | 0.19% | 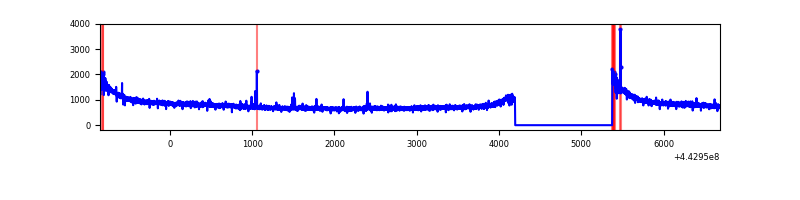 |
| B | 7535 | 6356 | 25 | 25 | 0.33% | 0.39% | 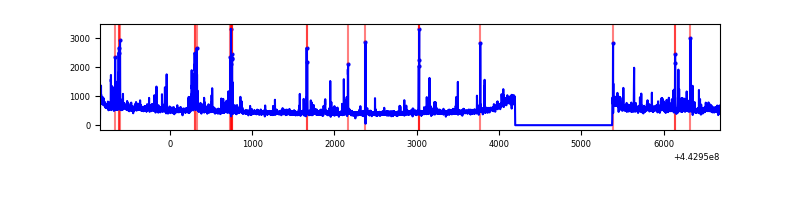 |
| C | 7535 | 6356 | 55 | 55 | 0.73% | 0.87% | 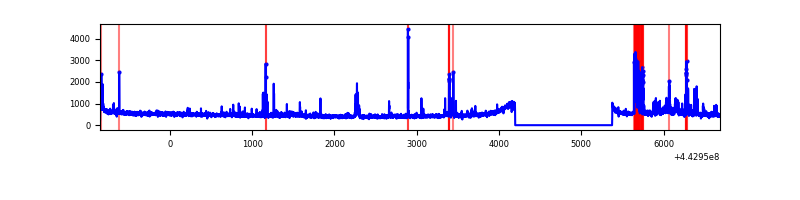 |
| D | 7535 | 6356 | 502 | 502 | 6.66% | 7.90% | 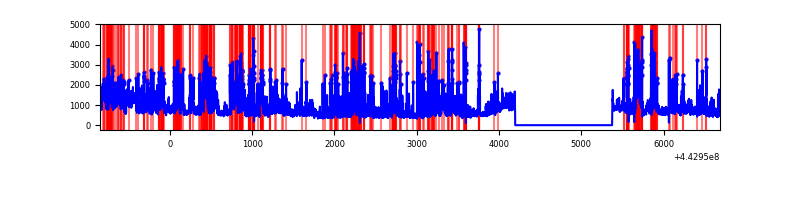 |
Top three noisy pixels from each quadrant. If the there are fewer than three noisy pixels in the level2.evt file, extra rows are filled as -1
| Pixel properties | Quadrant properties | ||||||
|---|---|---|---|---|---|---|---|
| Quadrant | DetID | PixID | Counts | Sigma | Mean | Median | Sigma |
| A | 10 | 83 | 2211389 | 13866.85 | 773 | 758 | 159.4 |
| A | 7 | 3 | 12189 | 71.7 | 773 | 758 | 159.4 |
| A | 13 | 248 | 9357 | 53.94 | 773 | 758 | 159.4 |
| B | 5 | 255 | 90716 | 590.17 | 778 | 757 | 152.4 |
| B | 0 | 186 | 88971 | 578.72 | 778 | 757 | 152.4 |
| B | 4 | 222 | 49135 | 317.38 | 778 | 757 | 152.4 |
| C | 12 | 2 | 195556 | 1088.45 | 771 | 776 | 179.0 |
| C | 14 | 254 | 159491 | 886.91 | 771 | 776 | 179.0 |
| C | 1 | 3 | 76080 | 420.81 | 771 | 776 | 179.0 |
| D | 1 | 52 | 1379706 | 7573.28 | 739 | 717 | 182.1 |
| D | 13 | 174 | 698849 | 3834.08 | 739 | 717 | 182.1 |
| D | 5 | 235 | 593874 | 3257.56 | 739 | 717 | 182.1 |
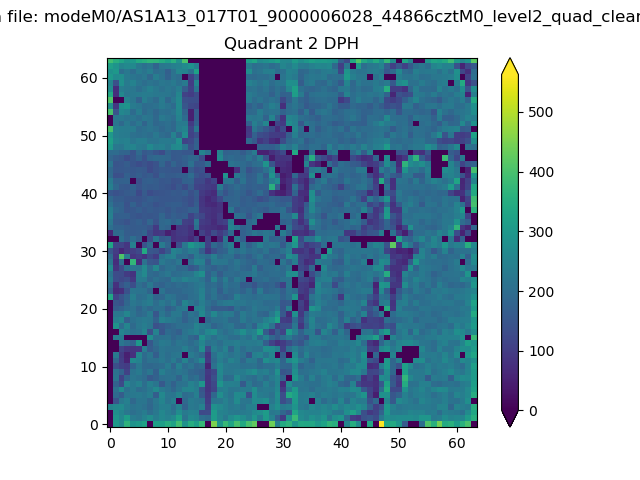
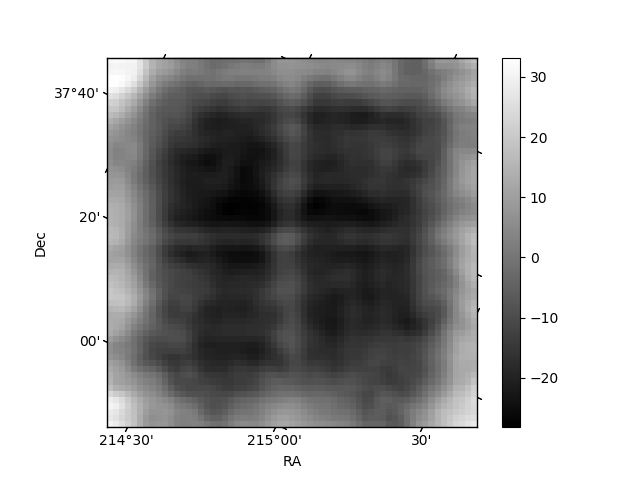
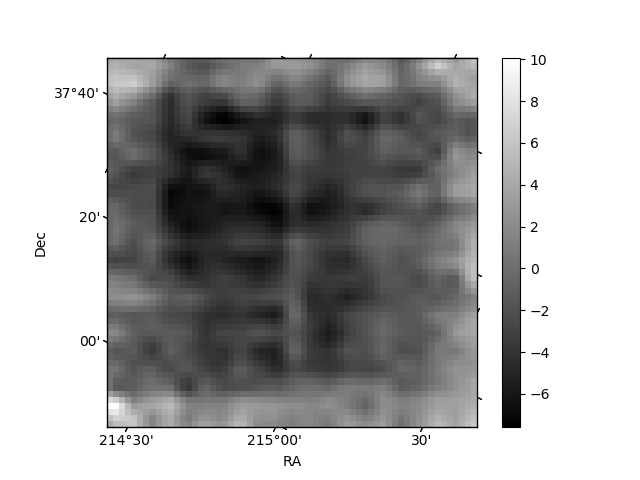
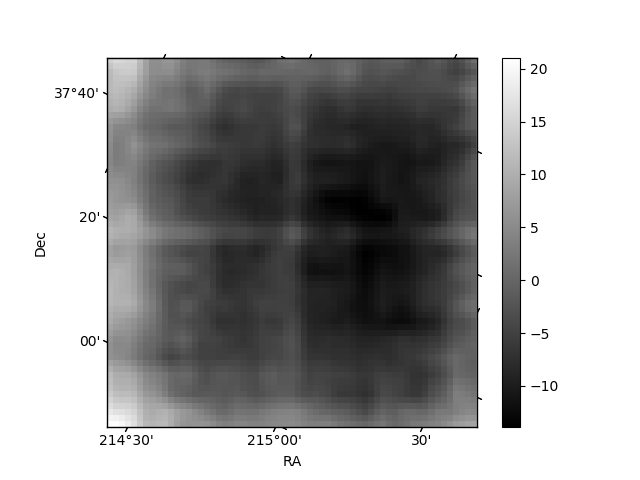
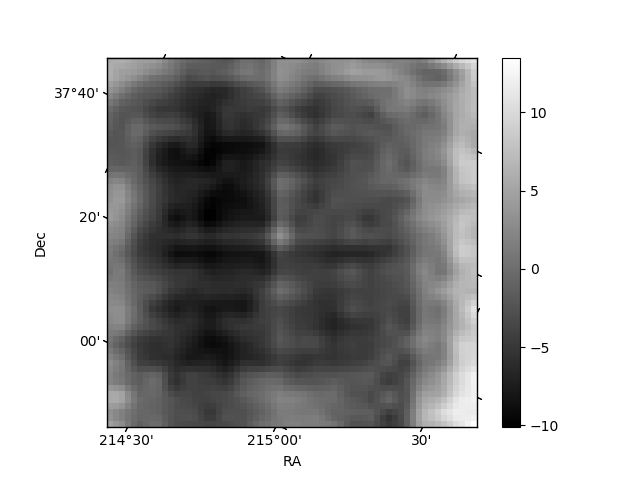
Histogram calculated using DETX and DETY for each event in the final _common_clean file
| Quadrant A | 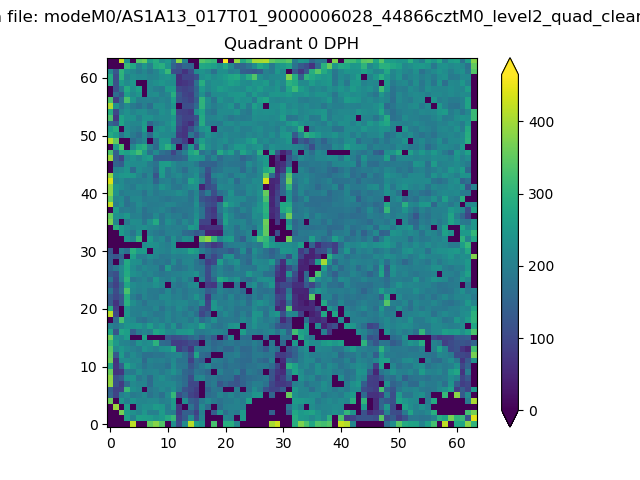 |
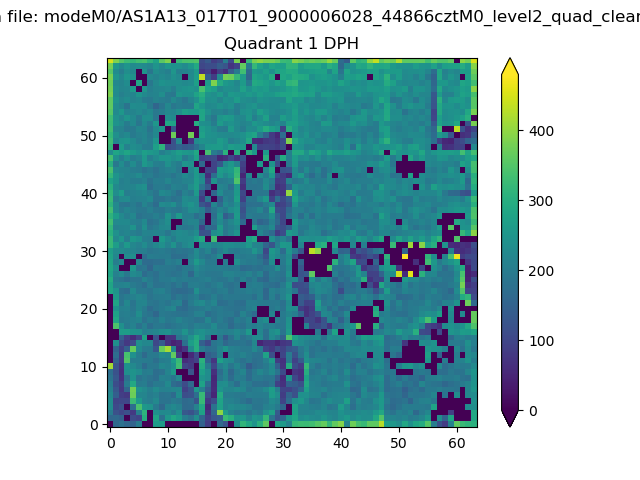 |
Quadrant B |
|---|---|---|---|
| Quadrant D | 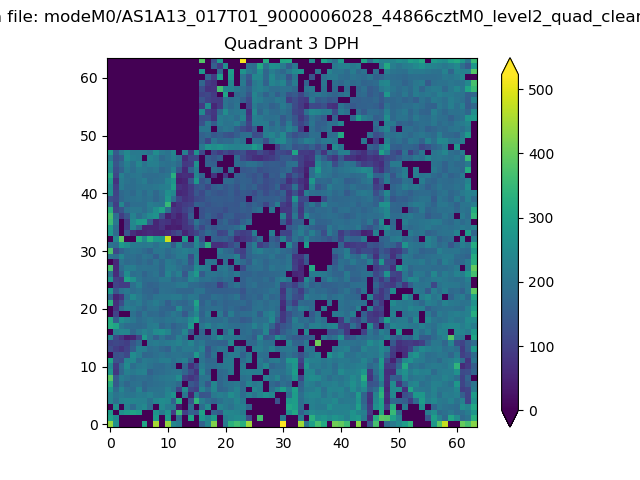 |
 |
Quadrant C |
| Plot type | Count rate plots | Images |
|---|---|---|
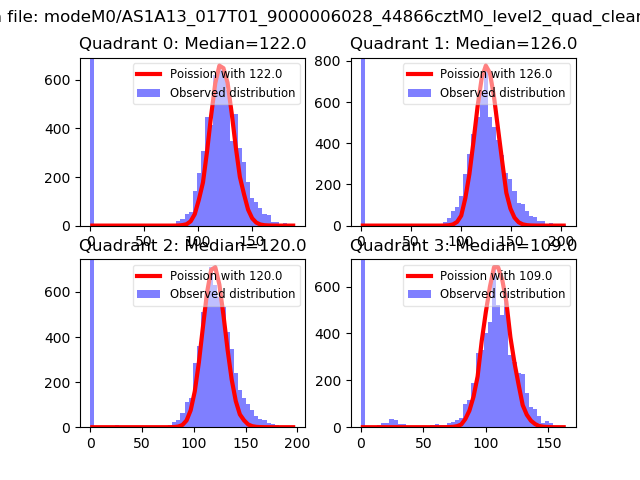
| Comparison with Poisson distribution Blue bars denote a histogram of data divided into 1 sec bins. Red curve is a Poisson curve with rate = median count rate of data. |
 |
 |
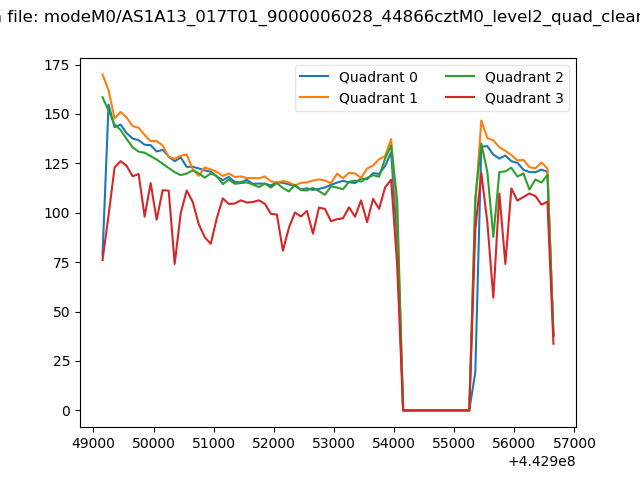
| Quadrant-wise count rates Data is divided into 100 sec bins |
 |
|
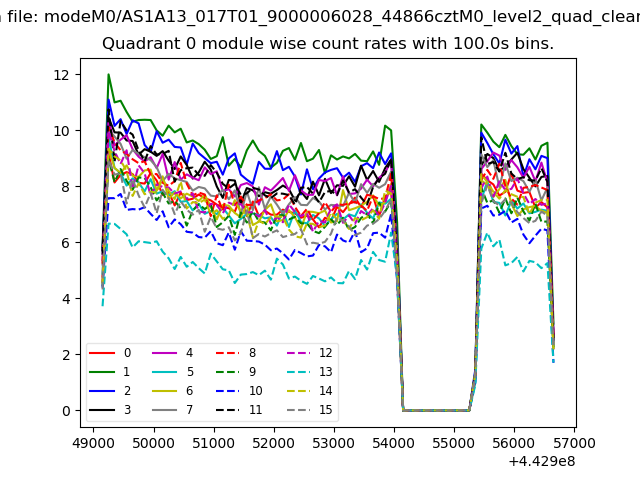
| Module-wise count rates for Quadrant A Data is divided into 100 sec bins |
 |
 |
| Module-wise count rates for Quadrant B Data is divided into 100 sec bins |
 |
 |
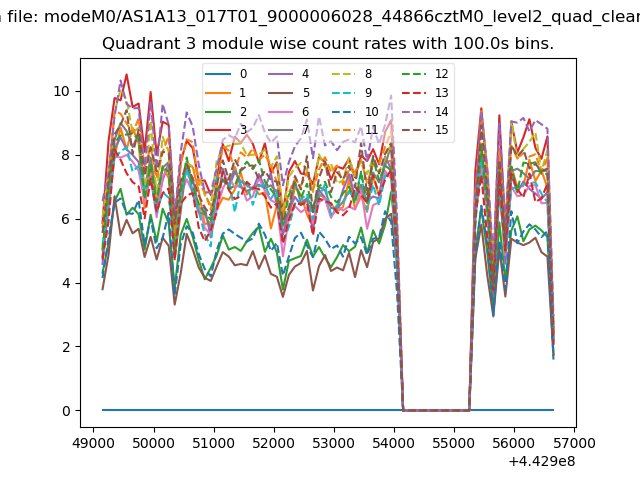
| Module-wise count rates for Quadrant C Data is divided into 100 sec bins |
 |
 |
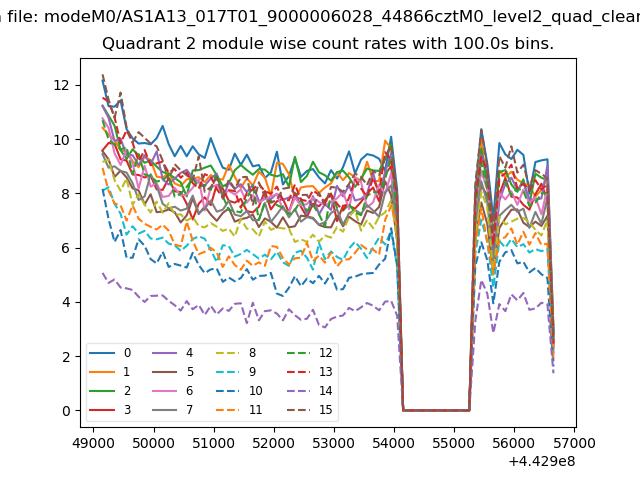
| Module-wise count rates for Quadrant D Data is divided into 100 sec bins |
 |
 |
| Parameter | Plot |
|---|---|
| CZT HV Monitor |  |
| D_VDD | 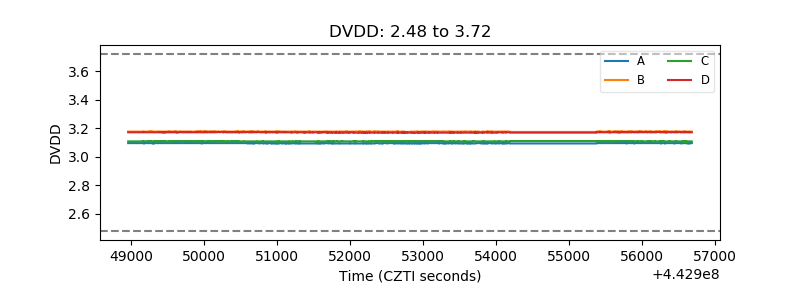 |
| Temperature 1 | 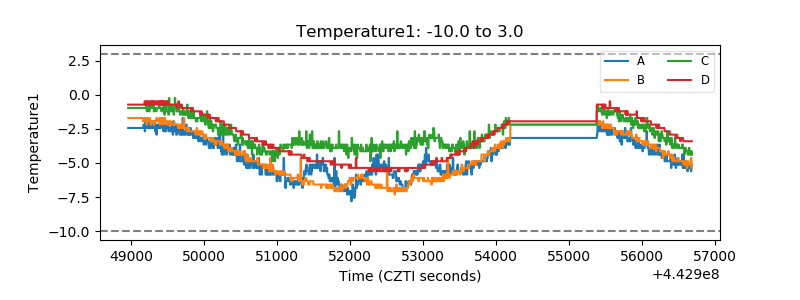 |
| Veto HV Monitor | 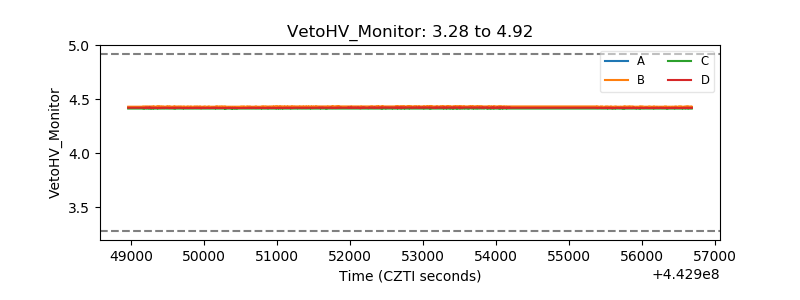 |
| Veto LLD | 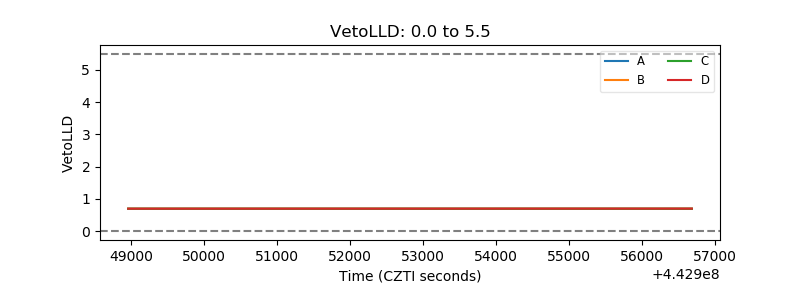 |
| Alpha Counter | 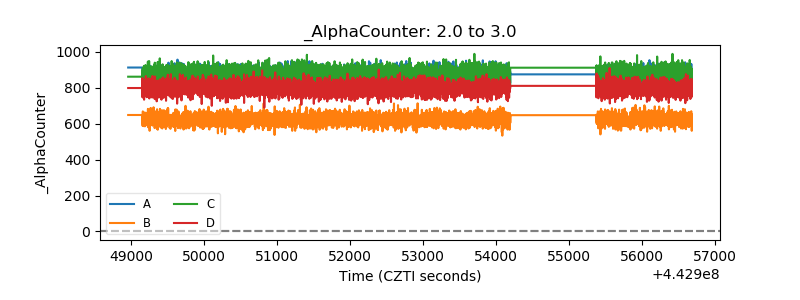 |
| _CPM_Rate | 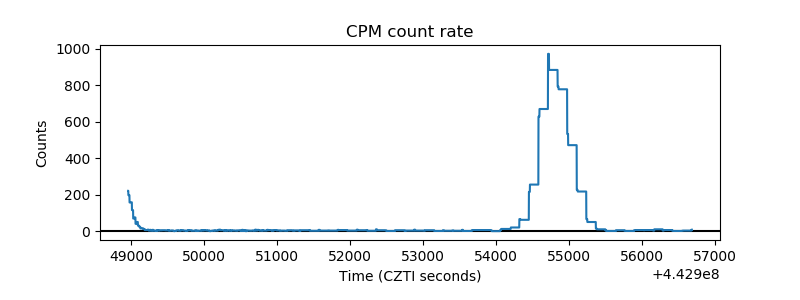 |
| CZT Counter | 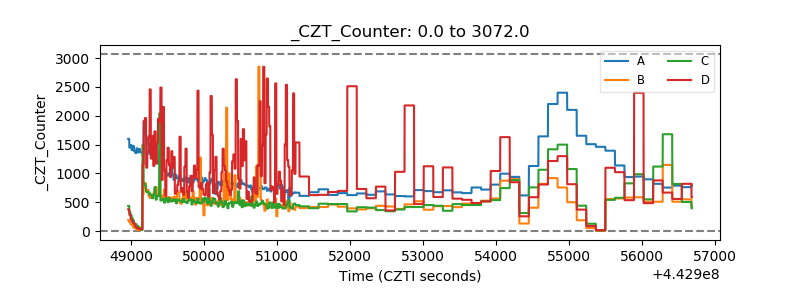 |
| +2.5 Volts monitor | 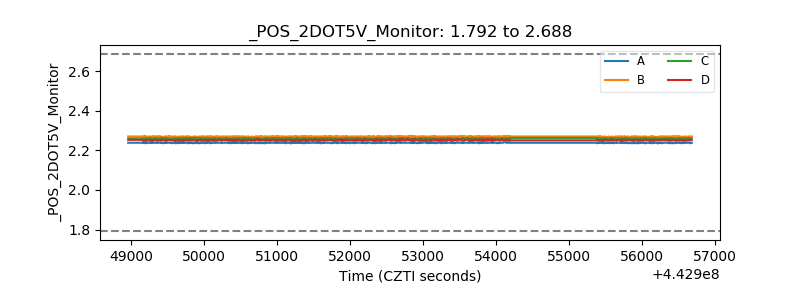 |
| +5 Volts monitor | 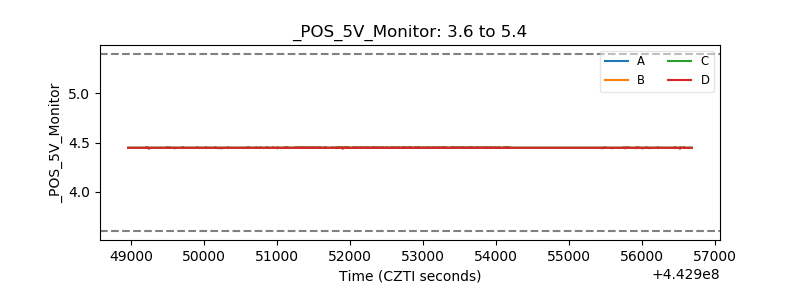 |
| _ROLL_ROT | 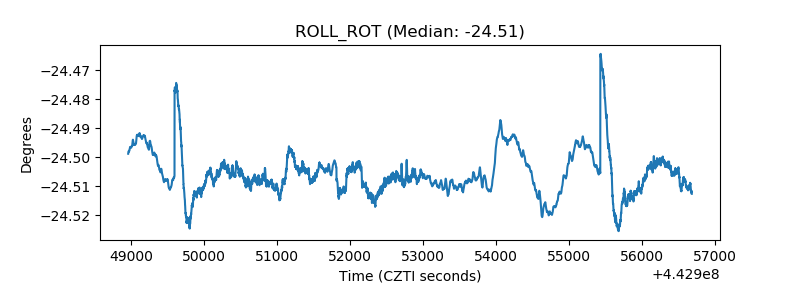 |
| _Roll_DEC | 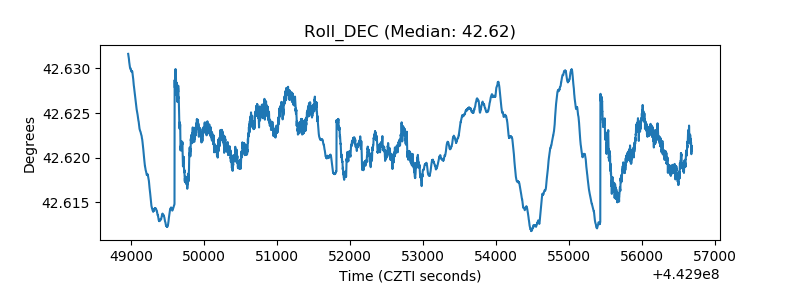 |
| _Roll_RA | 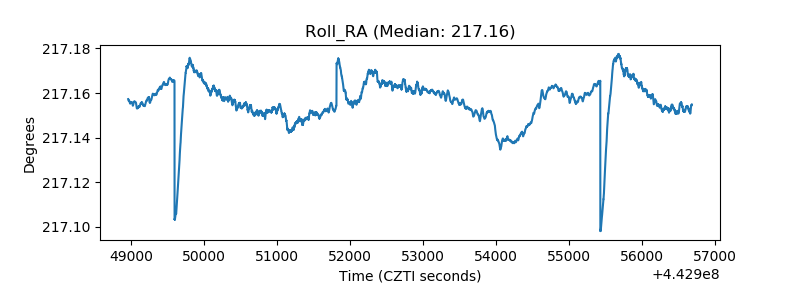 |
| Veto Counter | 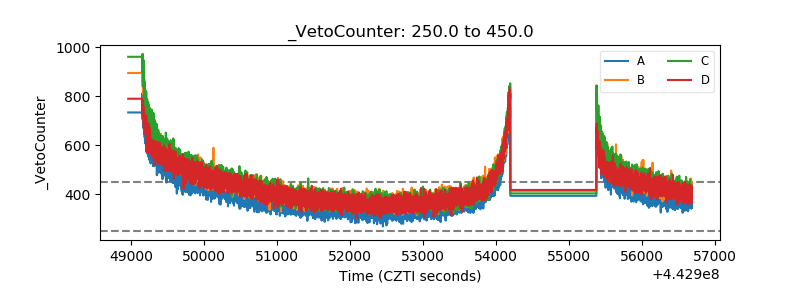 |