| Param | Original file | Final file |
|---|---|---|
| Filename | modeM0/AS1A13_017T01_9000006028_44868cztM0_level2.fits | modeM0/AS1A13_017T01_9000006028_44868cztM0_level2_quad_clean.evt |
| Size (bytes) | 554,996,160 | 107,395,200 |
| Size | 529.3 MB | 102.4 MB |
| Events in quadrant A | 5,061,603 | 732,847 |
| Events in quadrant B | 3,569,327 | 757,144 |
| Events in quadrant C | 3,392,566 | 725,781 |
| Events in quadrant D | 8,000,770 | 568,729 |
| Mode M0 | |||
|---|---|---|---|
| Quadrant | BADHDUFLAG | Total packets | Discarded packets |
| A | 0 | 20475 | 1 |
| B | 0 | 15376 | 1 |
| C | 0 | 14919 | 1 |
| D | 0 | 28534 | 4 |
| Mode SS | |||
|---|---|---|---|
| Quadrant | BADHDUFLAG | Total packets | Discarded packets |
| A | 0 | 134 | 0 |
| B | 0 | 134 | 0 |
| C | 0 | 134 | 0 |
| D | 0 | 134 | 0 |
| Mode M9 | |||
|---|---|---|---|
| Quadrant | BADHDUFLAG | Total packets | Discarded packets |
| A | 0 | 7 | 0 |
| B | 0 | 7 | 0 |
| C | 0 | 7 | 0 |
| D | 0 | 7 | 0 |
| Quadrant | Total seconds | Saturated seconds | Saturation percentage |
|---|---|---|---|
| A | 6702 | 153 | 2.282901% |
| B | 6702 | 126 | 1.880036% |
| C | 6702 | 115 | 1.715906% |
| D | 6701 | 1295 | 19.325474% |
Noise dominated data is calculated using 1-second bins in cleaned event files. If a bin has >2000 counts, and if more than 50% of those come from <1% of pixels, then it is considered to be noise-dominated and hence unusable.
| Quadrant | # 1 sec bins | Bins with >0 counts | Bins with >2000 counts | High rate bins dominated by noise | Noise dominated (total time) | Noise dominated (detector-on time) | Marked lightcurve |
|---|---|---|---|---|---|---|---|
| A | 7412 | 6703 | 1 | 1 | 0.01% | 0.01% | 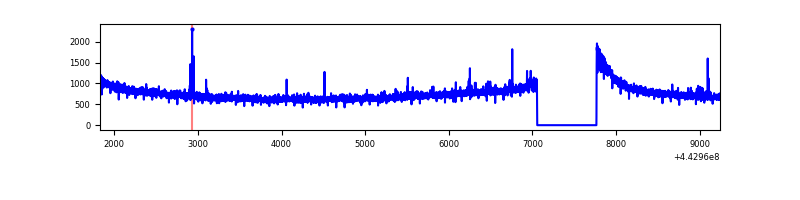 |
| B | 7412 | 6703 | 36 | 36 | 0.49% | 0.54% | 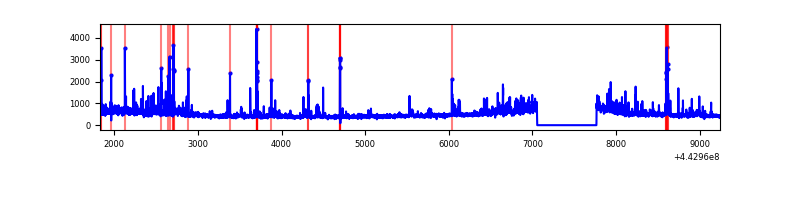 |
| C | 7412 | 6703 | 76 | 76 | 1.03% | 1.13% | 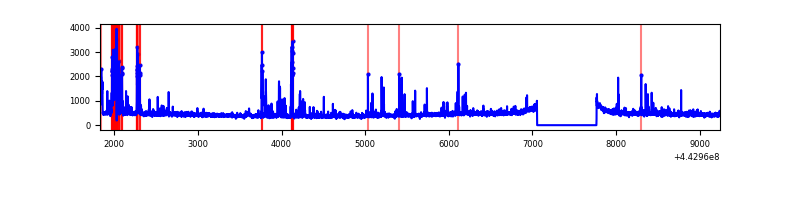 |
| D | 7411 | 6701 | 979 | 979 | 13.21% | 14.61% | 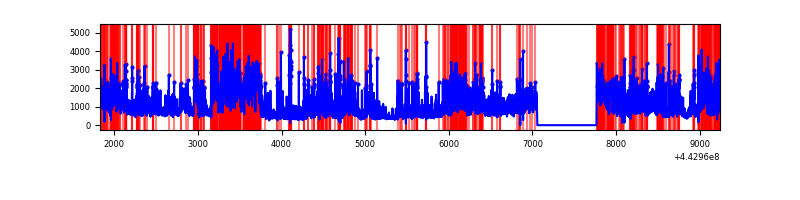 |
Top three noisy pixels from each quadrant. If the there are fewer than three noisy pixels in the level2.evt file, extra rows are filled as -1
| Pixel properties | Quadrant properties | ||||||
|---|---|---|---|---|---|---|---|
| Quadrant | DetID | PixID | Counts | Sigma | Mean | Median | Sigma |
| A | 10 | 83 | 2119014 | 13588.68 | 750 | 733 | 155.9 |
| A | 13 | 248 | 22221 | 137.84 | 750 | 733 | 155.9 |
| A | 7 | 3 | 16002 | 97.95 | 750 | 733 | 155.9 |
| B | 0 | 155 | 182275 | 1227.66 | 750 | 728 | 147.9 |
| B | 5 | 255 | 174553 | 1175.44 | 750 | 728 | 147.9 |
| B | 0 | 219 | 51491 | 343.27 | 750 | 728 | 147.9 |
| C | 12 | 2 | 223427 | 1283.7 | 740 | 744 | 173.5 |
| C | 14 | 254 | 117100 | 670.76 | 740 | 744 | 173.5 |
| C | 1 | 3 | 94371 | 539.73 | 740 | 744 | 173.5 |
| D | 1 | 52 | 2315558 | 13309.38 | 688 | 666 | 173.9 |
| D | 5 | 235 | 1329778 | 7641.68 | 688 | 666 | 173.9 |
| D | 2 | 249 | 456199 | 2619.07 | 688 | 666 | 173.9 |
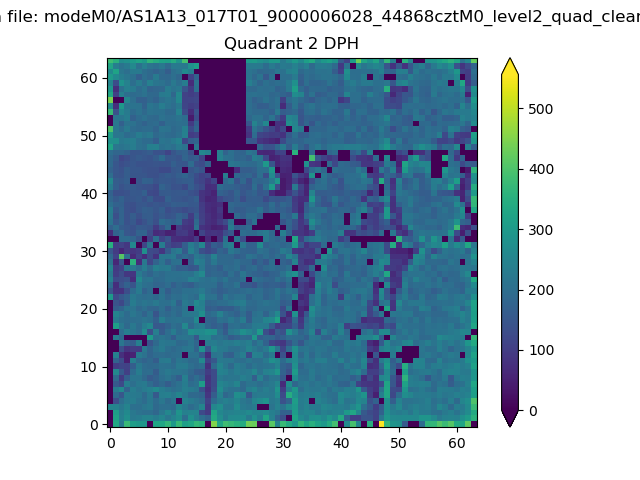
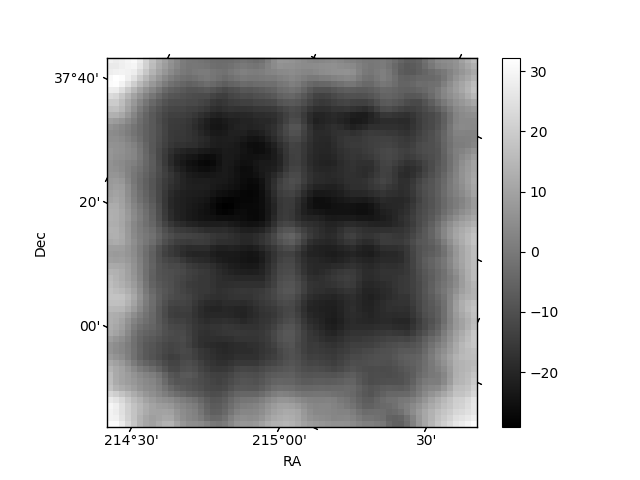
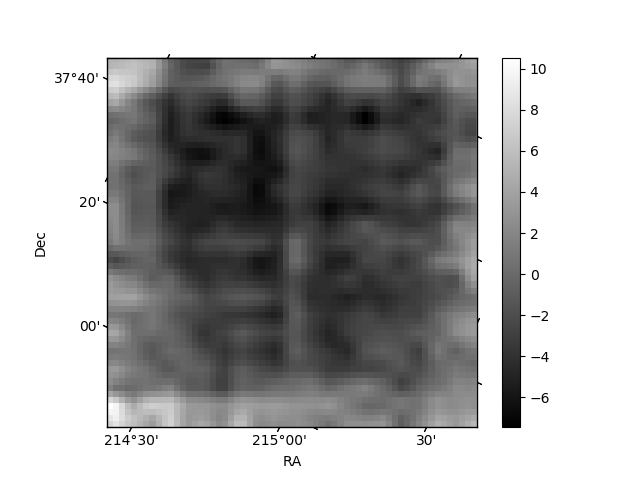
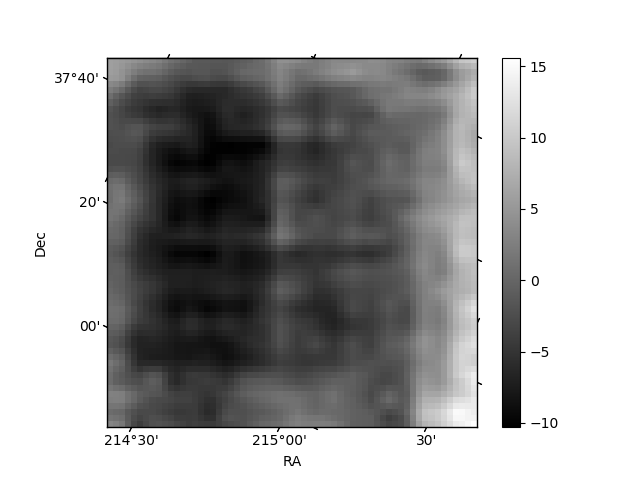
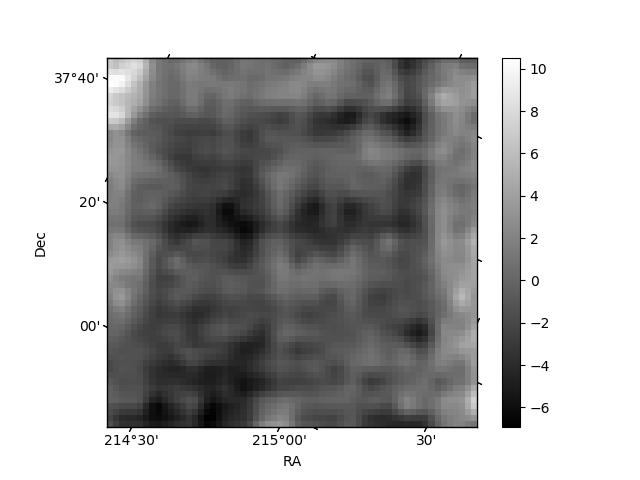
Histogram calculated using DETX and DETY for each event in the final _common_clean file
| Quadrant A | 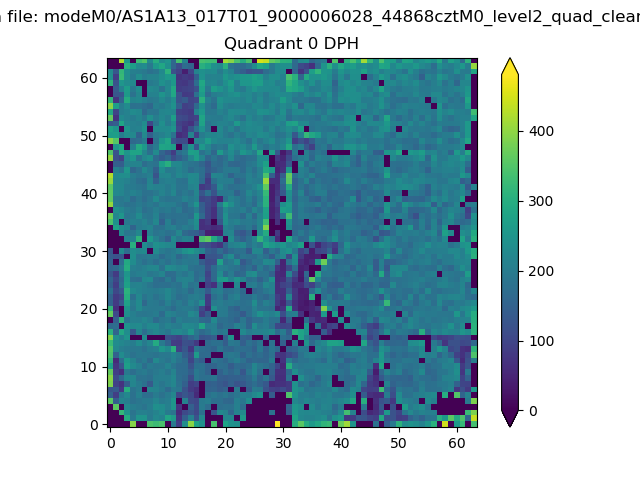 |
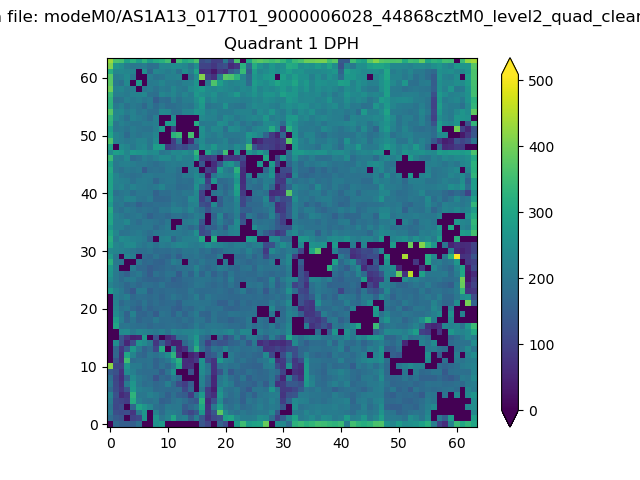 |
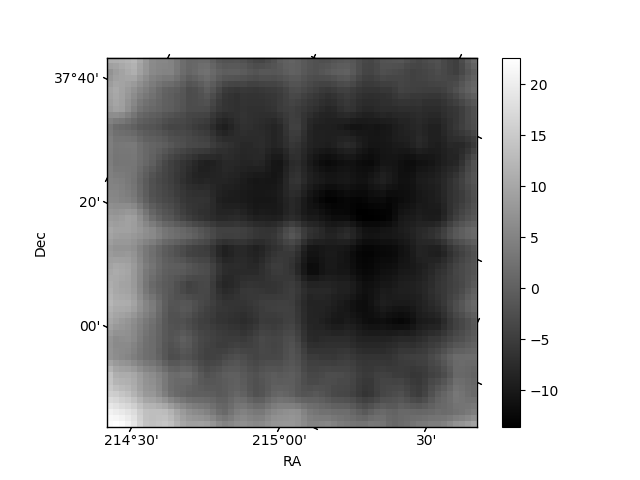
Quadrant B |
|---|---|---|---|
| Quadrant D | 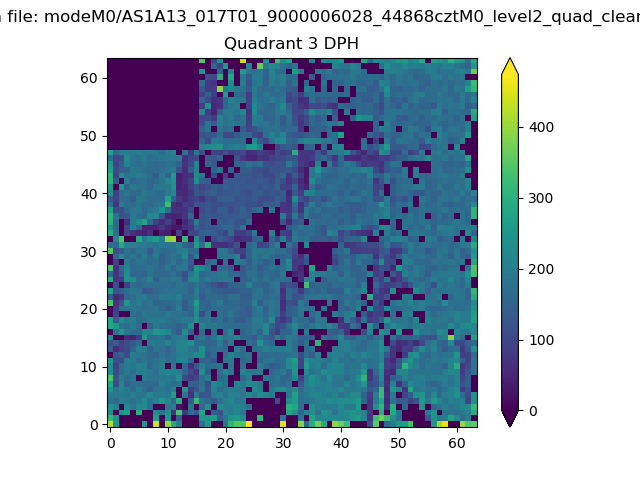 |
 |
Quadrant C |
| Plot type | Count rate plots | Images |
|---|---|---|
| Comparison with Poisson distribution Blue bars denote a histogram of data divided into 1 sec bins. Red curve is a Poisson curve with rate = median count rate of data. |
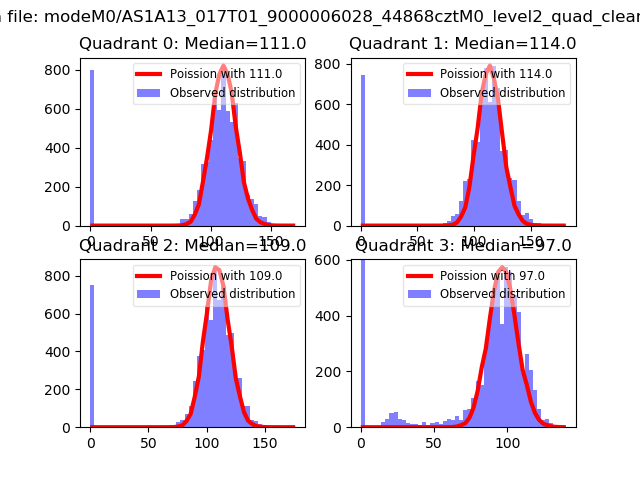 |
 |
| Quadrant-wise count rates Data is divided into 100 sec bins |
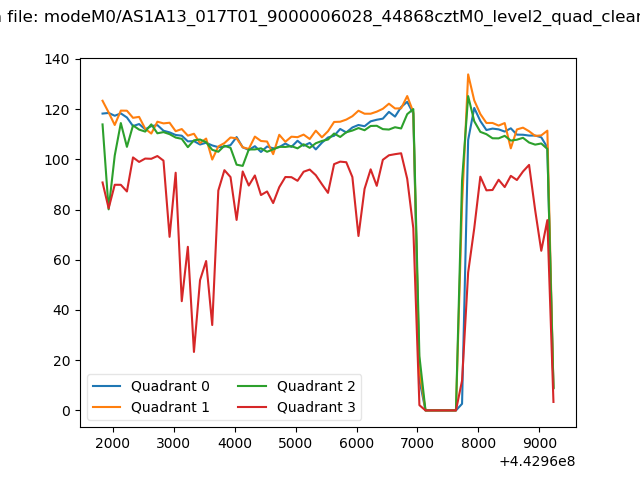 |
|
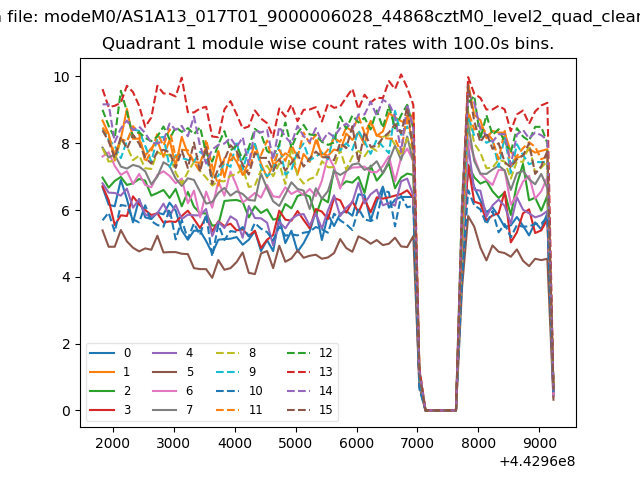
| Module-wise count rates for Quadrant A Data is divided into 100 sec bins |
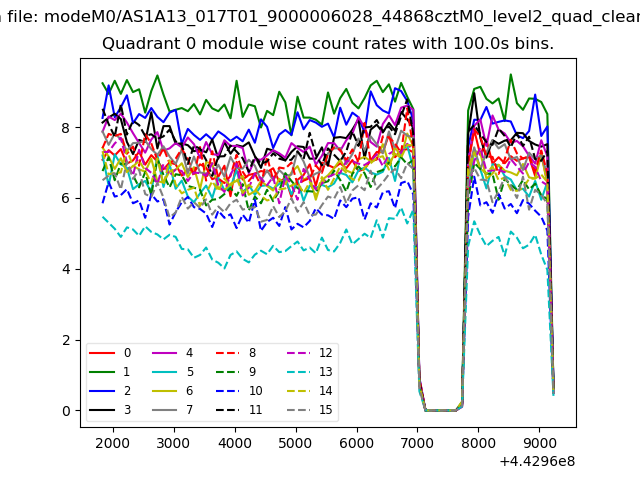 |
 |
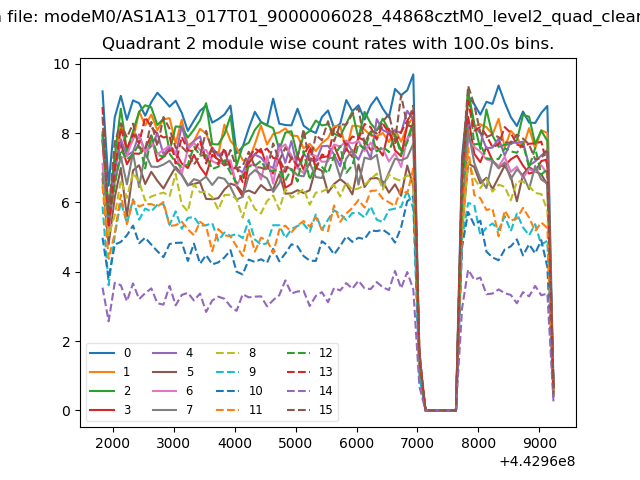
| Module-wise count rates for Quadrant B Data is divided into 100 sec bins |
 |
 |
| Module-wise count rates for Quadrant C Data is divided into 100 sec bins |
 |
 |
| Module-wise count rates for Quadrant D Data is divided into 100 sec bins |
 |
 |
| Parameter | Plot |
|---|---|
| CZT HV Monitor | 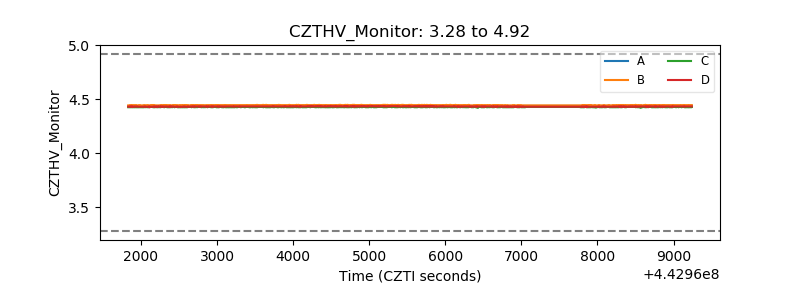 |
| D_VDD | 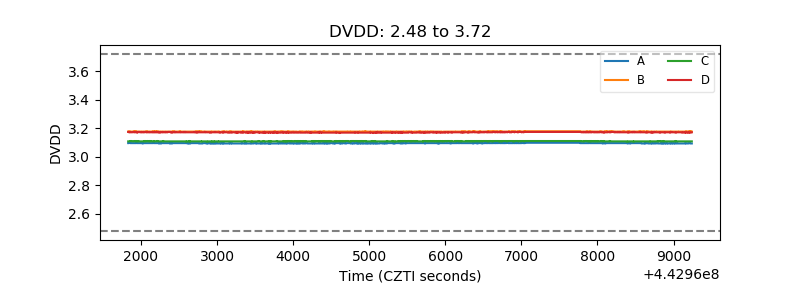 |
| Temperature 1 | 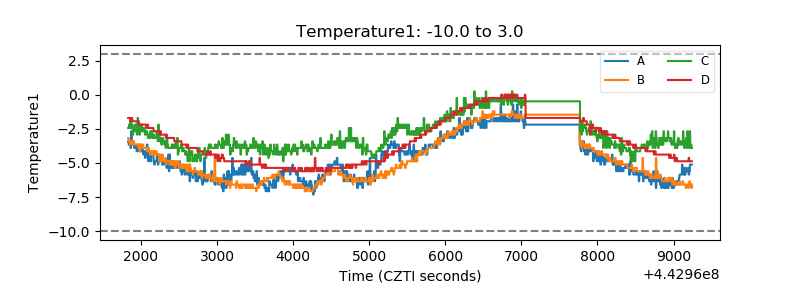 |
| Veto HV Monitor | 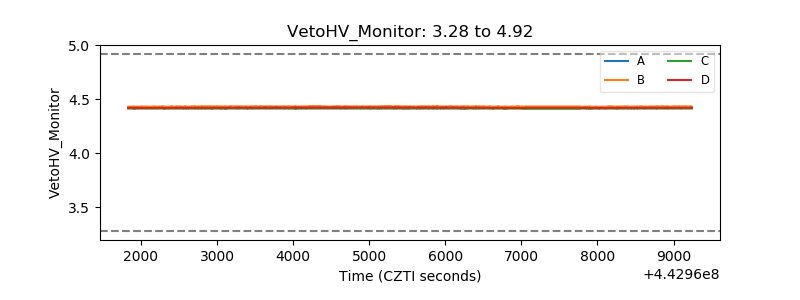 |
| Veto LLD | 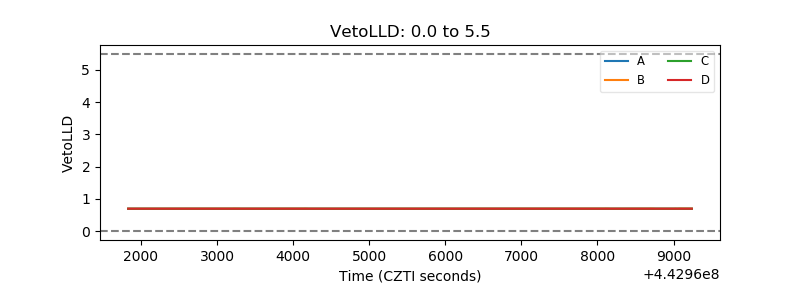 |
| Alpha Counter |  |
| _CPM_Rate | 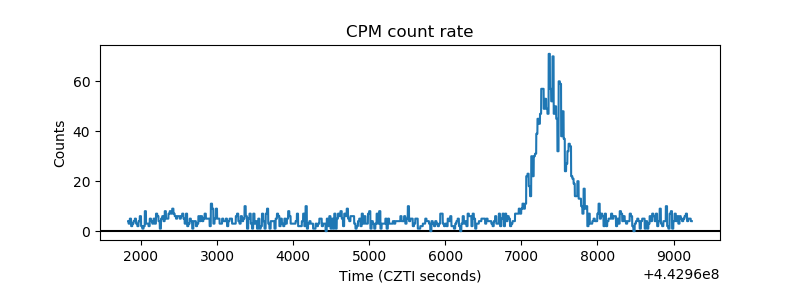 |
| CZT Counter | 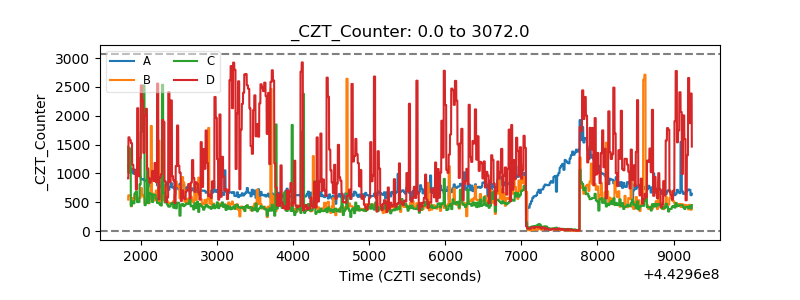 |
| +2.5 Volts monitor | 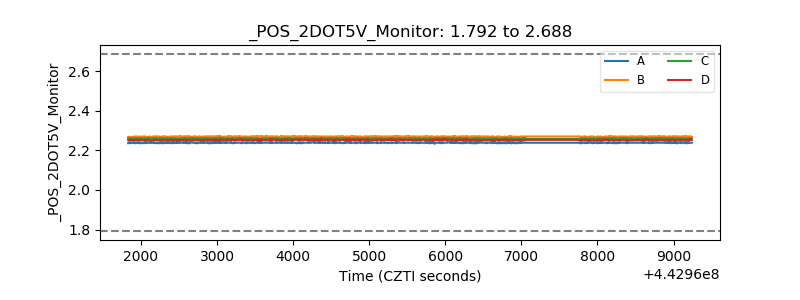 |
| +5 Volts monitor | 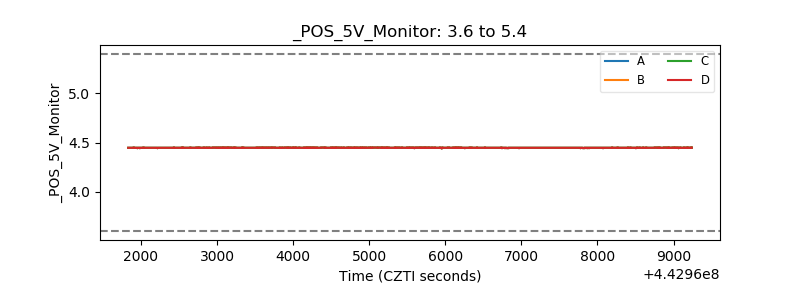 |
| _ROLL_ROT |  |
| _Roll_DEC | 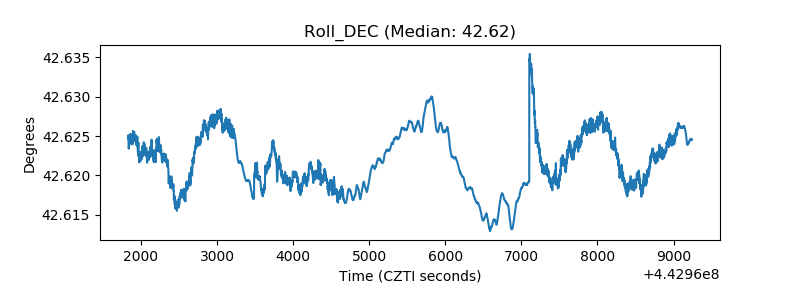 |
| _Roll_RA | 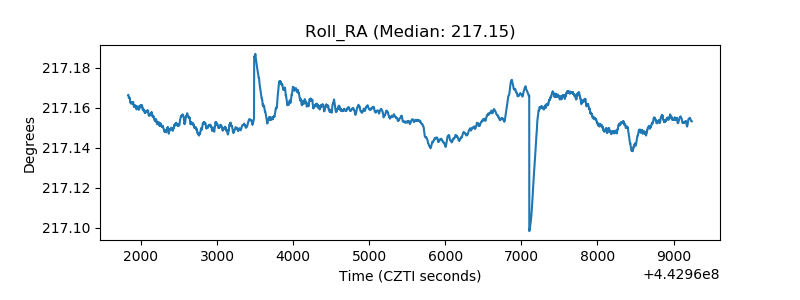 |
| Veto Counter |  |