| Param | Original file | Final file |
|---|---|---|
| Filename | modeM0/AS1A13_017T01_9000006028_44871cztM0_level2.fits | modeM0/AS1A13_017T01_9000006028_44871cztM0_level2_quad_clean.evt |
| Size (bytes) | 611,383,680 | 133,223,040 |
| Size | 583.1 MB | 127.1 MB |
| Events in quadrant A | 5,966,163 | 896,183 |
| Events in quadrant B | 4,062,437 | 923,569 |
| Events in quadrant C | 3,932,939 | 880,487 |
| Events in quadrant D | 8,025,411 | 755,542 |
| Mode M0 | |||
|---|---|---|---|
| Quadrant | BADHDUFLAG | Total packets | Discarded packets |
| A | 0 | 24945 | 0 |
| B | 0 | 18107 | 0 |
| C | 0 | 18046 | 1 |
| D | 0 | 29625 | 0 |
| Mode SS | |||
|---|---|---|---|
| Quadrant | BADHDUFLAG | Total packets | Discarded packets |
| A | 0 | 166 | 0 |
| B | 0 | 166 | 0 |
| C | 0 | 166 | 0 |
| D | 0 | 166 | 0 |
| Quadrant | Total seconds | Saturated seconds | Saturation percentage |
|---|---|---|---|
| A | 8318 | 70 | 0.841548% |
| B | 8319 | 76 | 0.913571% |
| C | 8318 | 39 | 0.468863% |
| D | 8318 | 748 | 8.992546% |
Noise dominated data is calculated using 1-second bins in cleaned event files. If a bin has >2000 counts, and if more than 50% of those come from <1% of pixels, then it is considered to be noise-dominated and hence unusable.
| Quadrant | # 1 sec bins | Bins with >0 counts | Bins with >2000 counts | High rate bins dominated by noise | Noise dominated (total time) | Noise dominated (detector-on time) | Marked lightcurve |
|---|---|---|---|---|---|---|---|
| A | 8318 | 8318 | 3 | 3 | 0.04% | 0.04% | 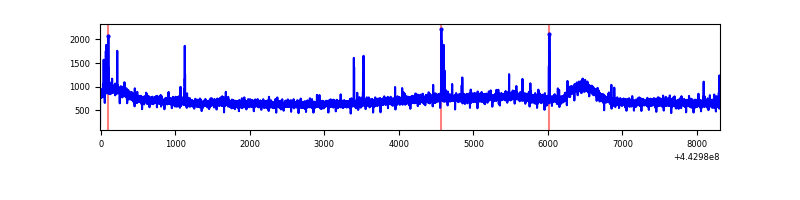 |
| B | 8319 | 8319 | 19 | 19 | 0.23% | 0.23% | 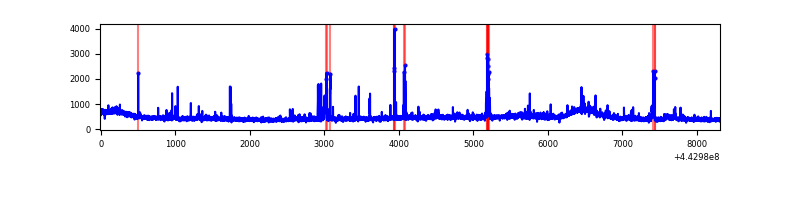 |
| C | 8318 | 8318 | 19 | 19 | 0.23% | 0.23% | 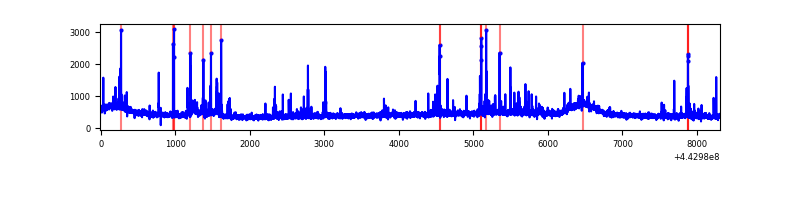 |
| D | 8318 | 8318 | 482 | 482 | 5.79% | 5.79% | 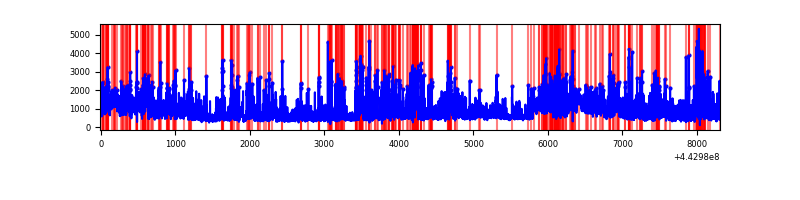 |
Top three noisy pixels from each quadrant. If the there are fewer than three noisy pixels in the level2.evt file, extra rows are filled as -1
| Pixel properties | Quadrant properties | ||||||
|---|---|---|---|---|---|---|---|
| Quadrant | DetID | PixID | Counts | Sigma | Mean | Median | Sigma |
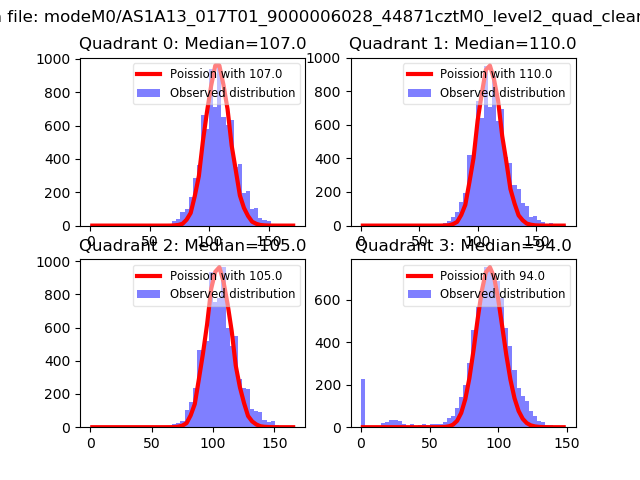
| A | 10 | 83 | 2269518 | 11468.03 | 940 | 920 | 197.8 |
| A | 7 | 3 | 27659 | 135.17 | 940 | 920 | 197.8 |
| A | 13 | 248 | 20244 | 97.69 | 940 | 920 | 197.8 |
| B | 0 | 219 | 122188 | 648.37 | 941 | 909 | 187.1 |
| B | 5 | 255 | 114994 | 609.91 | 941 | 909 | 187.1 |
| B | 0 | 155 | 61890 | 326.01 | 941 | 909 | 187.1 |
| C | 1 | 3 | 206173 | 939.67 | 923 | 924 | 218.4 |
| C | 12 | 2 | 64731 | 292.12 | 923 | 924 | 218.4 |
| C | 12 | 250 | 21553 | 94.44 | 923 | 924 | 218.4 |
| D | 1 | 52 | 1938372 | 8650.34 | 887 | 860 | 224.0 |
| D | 13 | 174 | 844374 | 3766.01 | 887 | 860 | 224.0 |
| D | 2 | 249 | 751020 | 3349.21 | 887 | 860 | 224.0 |
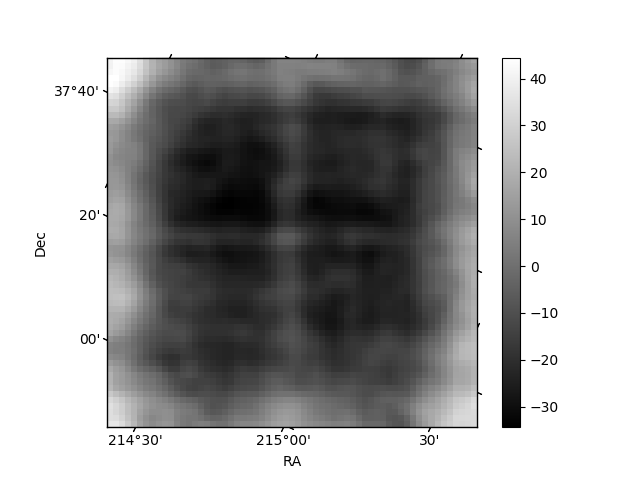
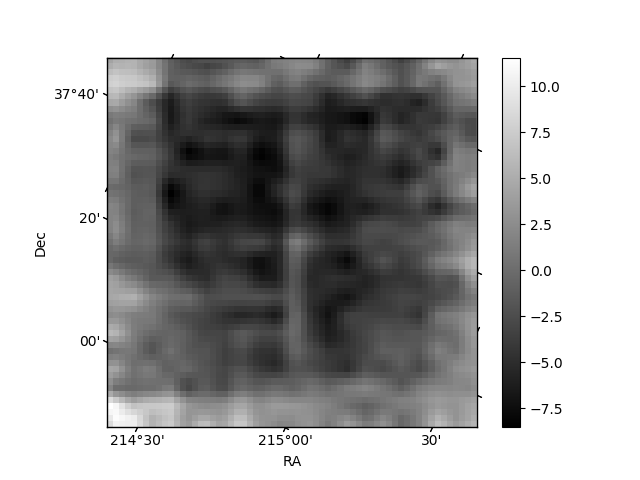
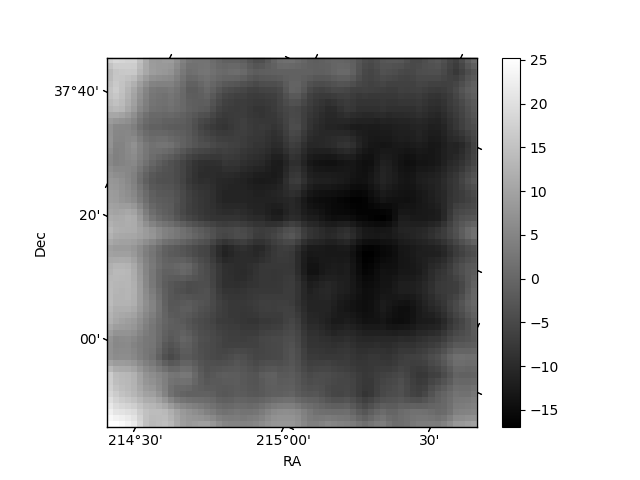
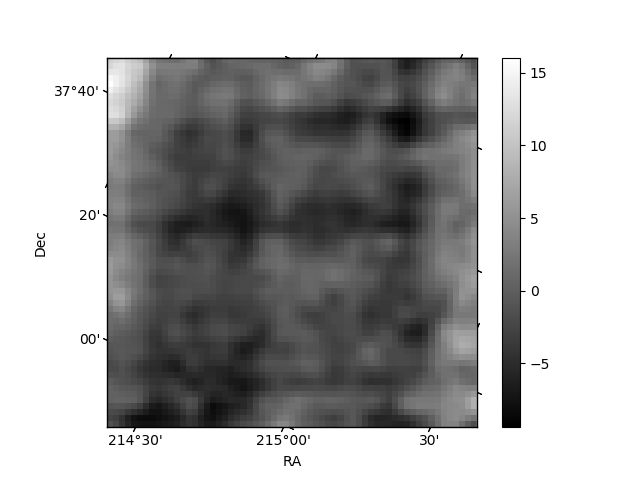
Histogram calculated using DETX and DETY for each event in the final _common_clean file
| Quadrant A | 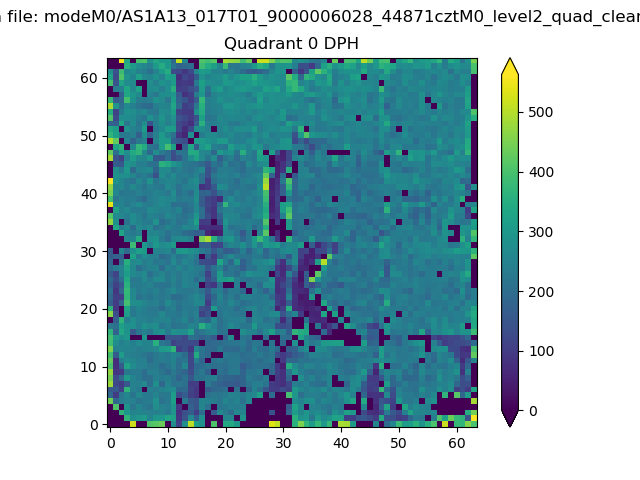 |
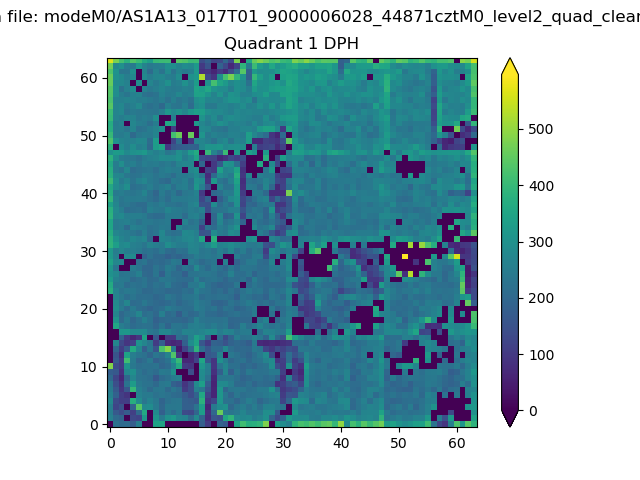 |
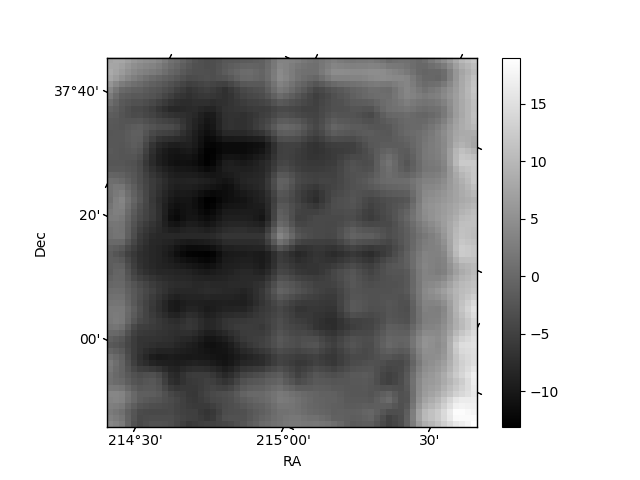
Quadrant B |
|---|---|---|---|
| Quadrant D | 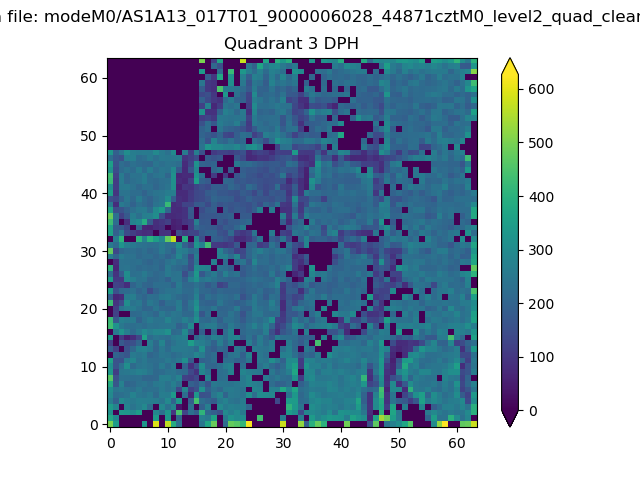 |
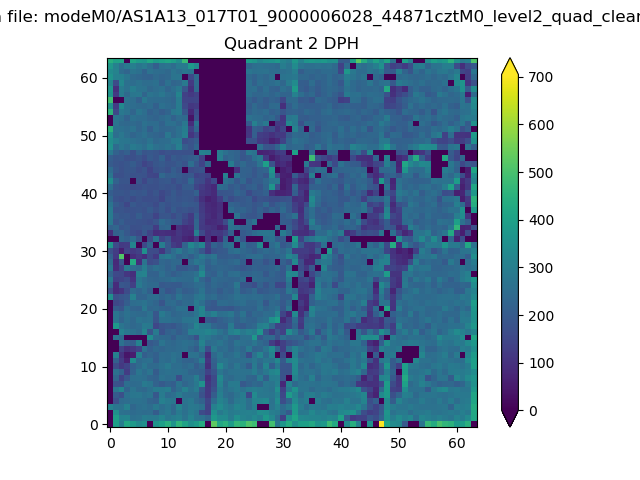 |
Quadrant C |
| Plot type | Count rate plots | Images |
|---|---|---|
| Comparison with Poisson distribution Blue bars denote a histogram of data divided into 1 sec bins. Red curve is a Poisson curve with rate = median count rate of data. |
 |
 |
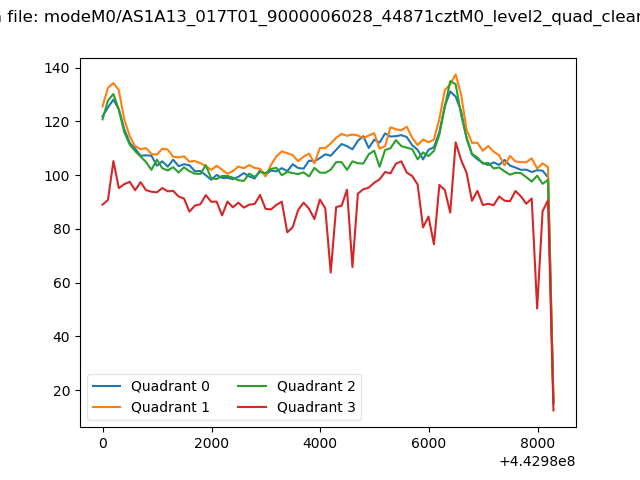
| Quadrant-wise count rates Data is divided into 100 sec bins |
 |
|
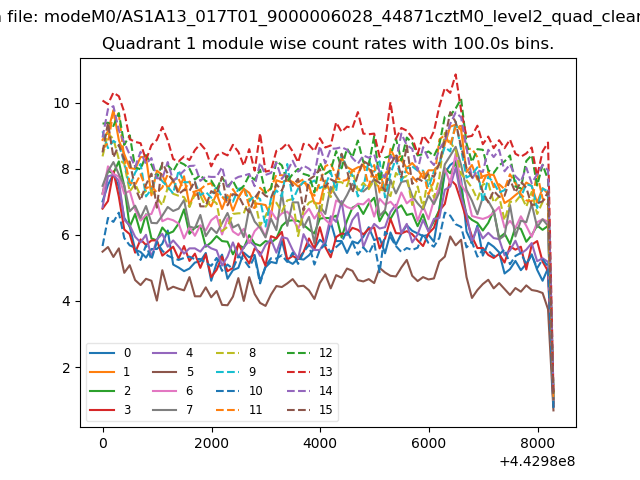
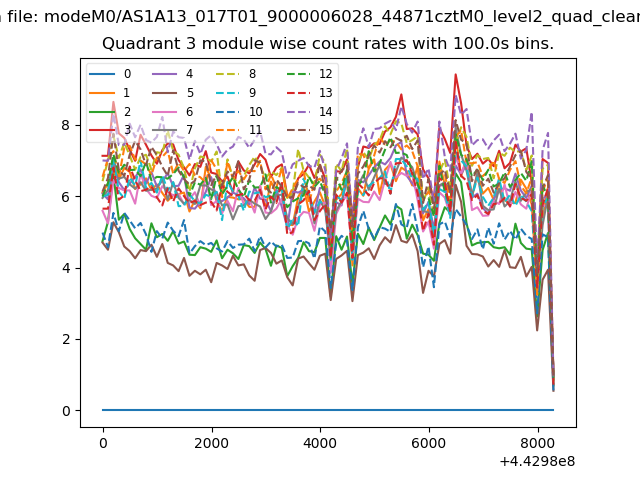
| Module-wise count rates for Quadrant A Data is divided into 100 sec bins |
 |
 |
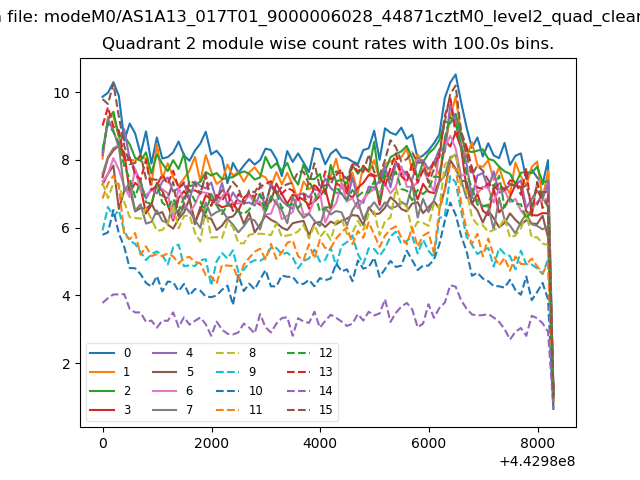
| Module-wise count rates for Quadrant B Data is divided into 100 sec bins |
 |
 |
| Module-wise count rates for Quadrant C Data is divided into 100 sec bins |
 |
 |
| Module-wise count rates for Quadrant D Data is divided into 100 sec bins |
 |
 |
| Parameter | Plot |
|---|---|
| CZT HV Monitor |  |
| D_VDD | 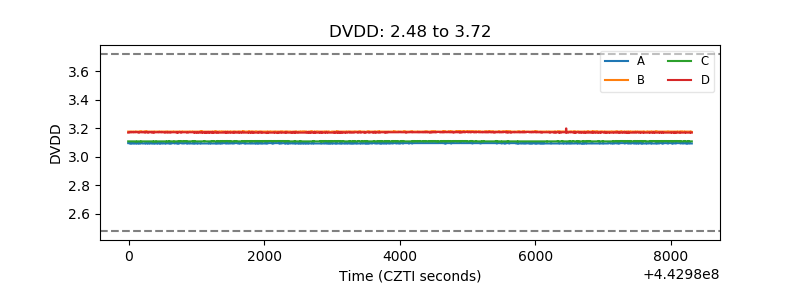 |
| Temperature 1 | 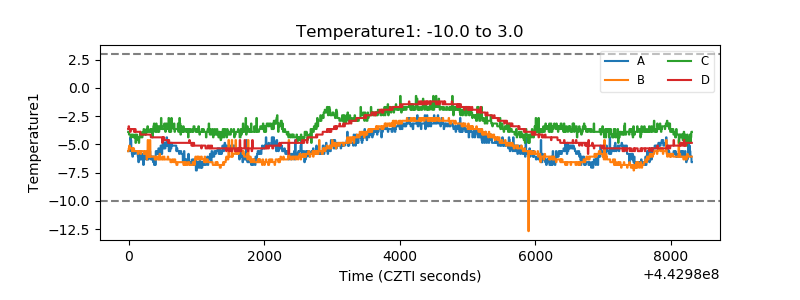 |
| Veto HV Monitor | 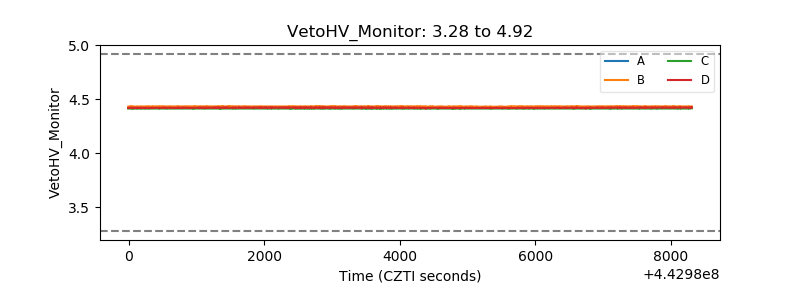 |
| Veto LLD | 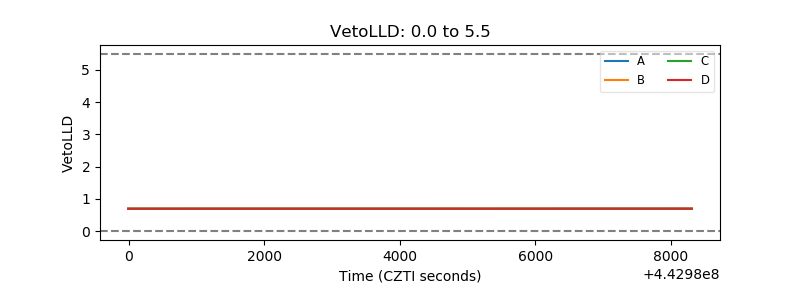 |
| Alpha Counter | 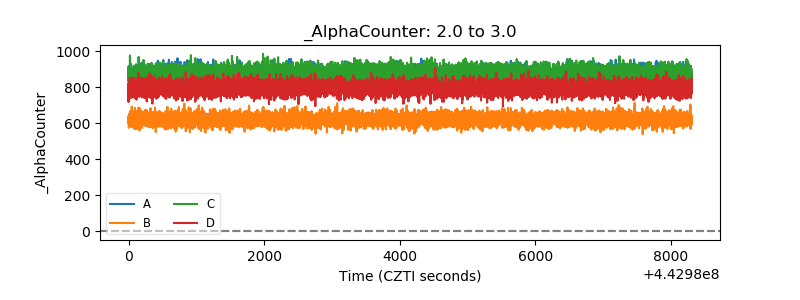 |
| _CPM_Rate | 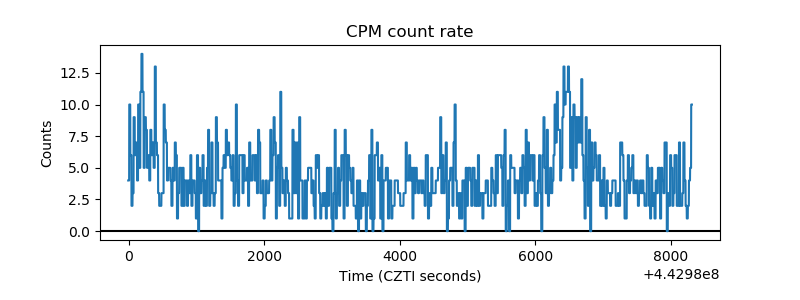 |
| CZT Counter | 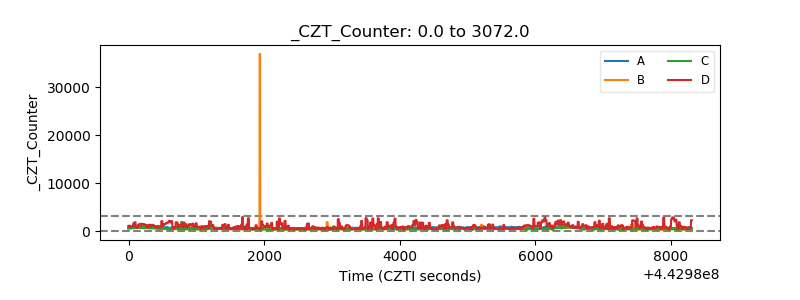 |
| +2.5 Volts monitor | 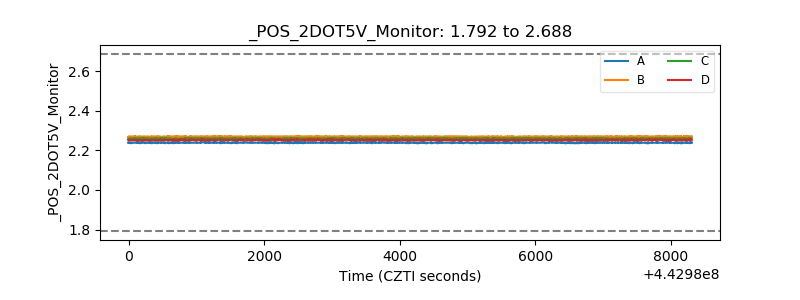 |
| +5 Volts monitor | 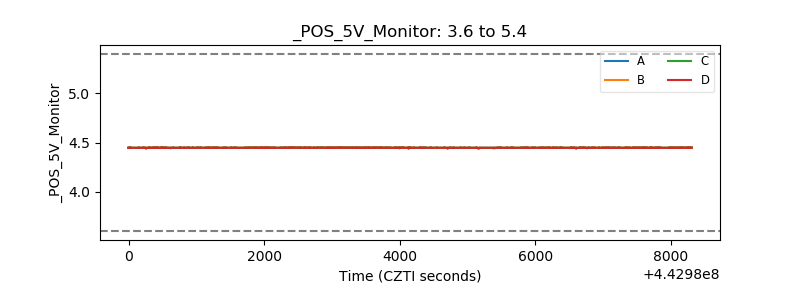 |
| _ROLL_ROT | 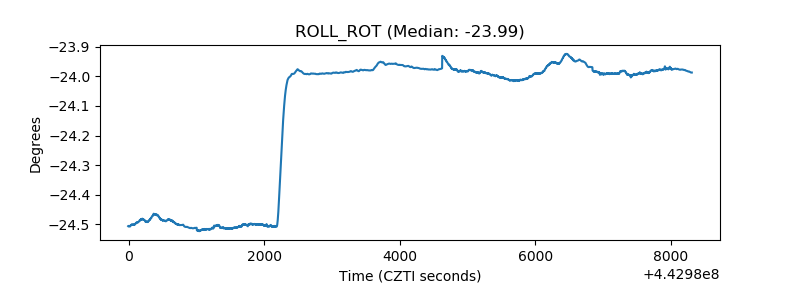 |
| _Roll_DEC | 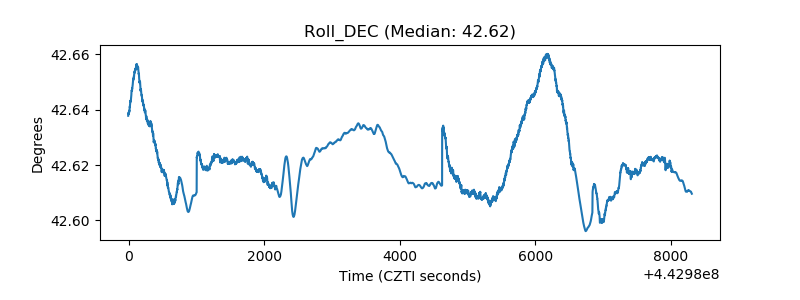 |
| _Roll_RA | 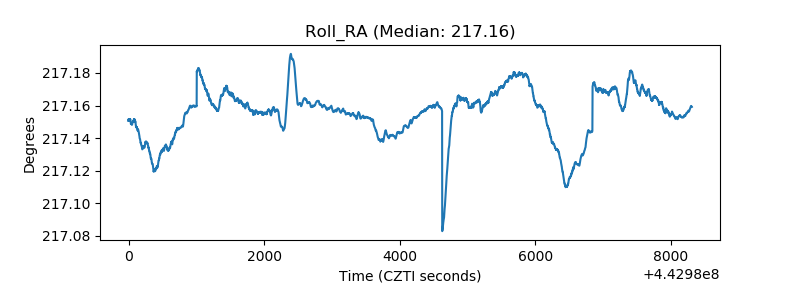 |
| Veto Counter | 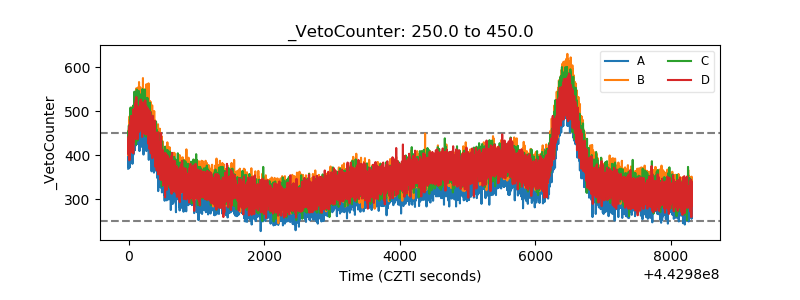 |