| Param | Original file | Final file |
|---|---|---|
| Filename | modeM0/AS1A13_017T01_9000006028_48650cztM0_level2.fits | modeM0/AS1A13_017T01_9000006028_48650cztM0_level2_quad_clean.evt |
| Size (bytes) | 463,835,520 | 107,487,360 |
| Size | 442.3 MB | 102.5 MB |
| Events in quadrant A | 7,040,724 | 698,142 |
| Events in quadrant B | 3,532,870 | 726,318 |
| Events in quadrant C | 2,866,293 | 731,426 |
| Events in quadrant D | 3,225,938 | 645,781 |
| Mode M0 | |||
|---|---|---|---|
| Quadrant | BADHDUFLAG | Total packets | Discarded packets |
| A | 0 | 25384 | 3 |
| B | 0 | 15171 | 3 |
| C | 0 | 13366 | 3 |
| D | 0 | 14491 | 3 |
| Mode SS | |||
|---|---|---|---|
| Quadrant | BADHDUFLAG | Total packets | Discarded packets |
| A | 0 | 134 | 0 |
| B | 0 | 134 | 0 |
| C | 0 | 134 | 0 |
| D | 0 | 134 | 0 |
| Mode M9 | |||
|---|---|---|---|
| Quadrant | BADHDUFLAG | Total packets | Discarded packets |
| A | 0 | 12 | 0 |
| B | 0 | 12 | 0 |
| C | 0 | 13 | 0 |
| D | 0 | 13 | 0 |
| Quadrant | Total seconds | Saturated seconds | Saturation percentage |
|---|---|---|---|
| A | 6488 | 351 | 5.409988% |
| B | 6488 | 314 | 4.839704% |
| C | 6488 | 22 | 0.339088% |
| D | 6488 | 133 | 2.049938% |
Noise dominated data is calculated using 1-second bins in cleaned event files. If a bin has >2000 counts, and if more than 50% of those come from <1% of pixels, then it is considered to be noise-dominated and hence unusable.
| Quadrant | # 1 sec bins | Bins with >0 counts | Bins with >2000 counts | High rate bins dominated by noise | Noise dominated (total time) | Noise dominated (detector-on time) | Marked lightcurve |
|---|---|---|---|---|---|---|---|
| A | 7673 | 6490 | 178 | 178 | 2.32% | 2.74% | 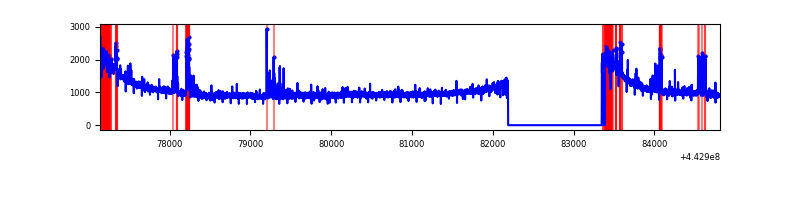 |
| B | 7673 | 6490 | 210 | 210 | 2.74% | 3.24% | 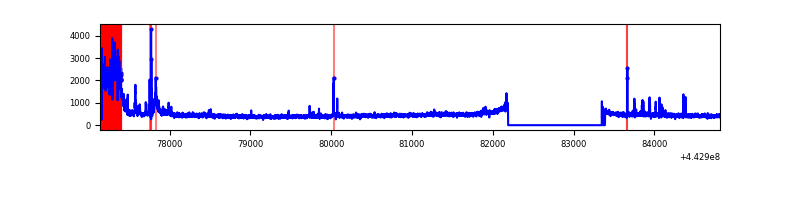 |
| C | 7673 | 6490 | 4 | 4 | 0.05% | 0.06% | 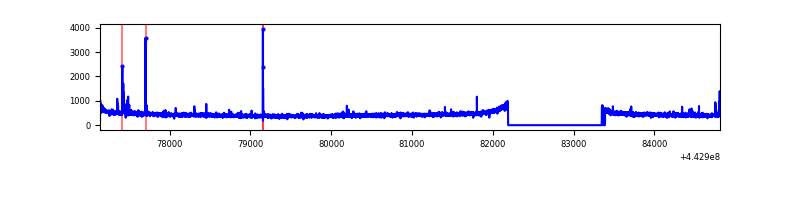 |
| D | 7673 | 6490 | 111 | 111 | 1.45% | 1.71% | 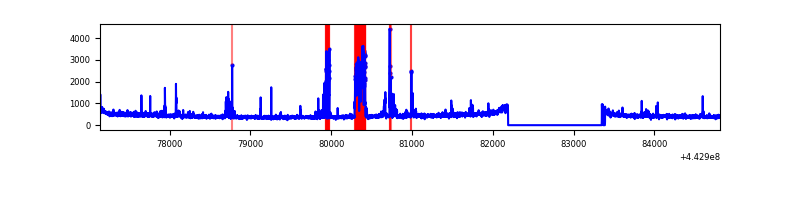 |
Top three noisy pixels from each quadrant. If the there are fewer than three noisy pixels in the level2.evt file, extra rows are filled as -1
| Pixel properties | Quadrant properties | ||||||
|---|---|---|---|---|---|---|---|
| Quadrant | DetID | PixID | Counts | Sigma | Mean | Median | Sigma |
| A | 10 | 83 | 4036247 | 27283.0 | 710 | 695 | 147.9 |
| A | 9 | 143 | 222342 | 1498.48 | 710 | 695 | 147.9 |
| A | 13 | 248 | 32051 | 211.99 | 710 | 695 | 147.9 |
| B | 12 | 16 | 652978 | 4763.01 | 705 | 682 | 137.0 |
| B | 8 | 234 | 32829 | 234.73 | 705 | 682 | 137.0 |
| B | 5 | 171 | 24148 | 171.35 | 705 | 682 | 137.0 |
| C | 14 | 254 | 47515 | 273.02 | 722 | 725 | 171.4 |
| C | 3 | 233 | 5541 | 28.1 | 722 | 725 | 171.4 |
| C | 13 | 61 | 4787 | 23.7 | 722 | 725 | 171.4 |
| D | 2 | 249 | 473256 | 2694.39 | 702 | 680 | 175.4 |
| D | 2 | 234 | 33671 | 188.1 | 702 | 680 | 175.4 |
| D | 2 | 233 | 24673 | 136.8 | 702 | 680 | 175.4 |
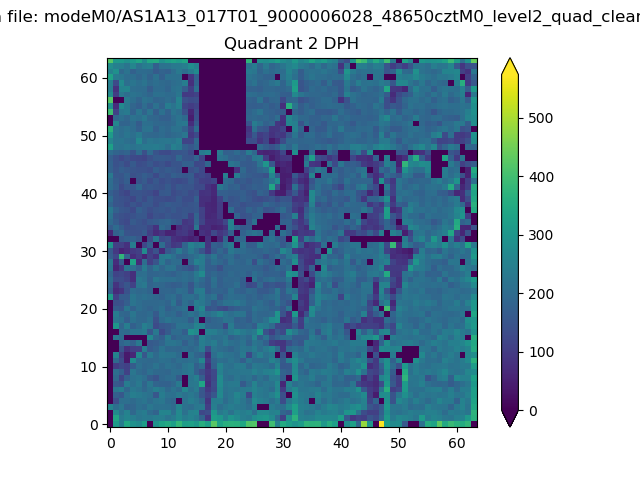
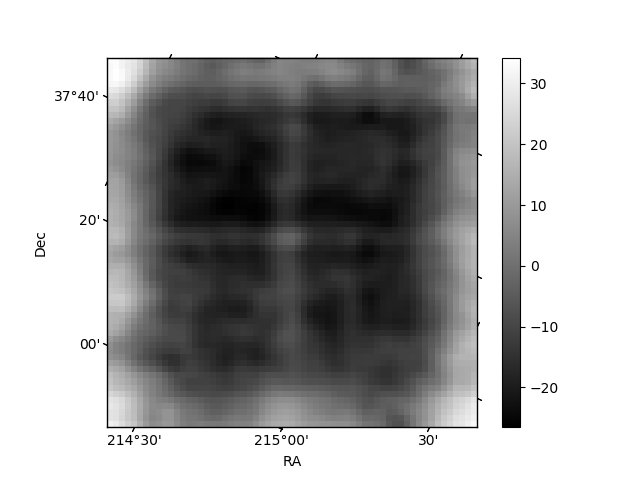
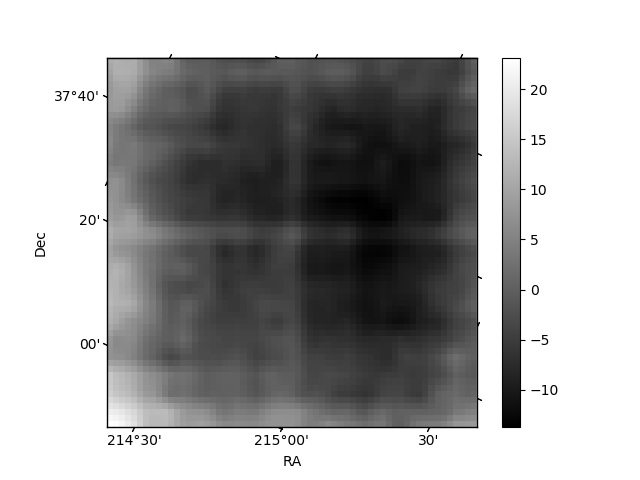
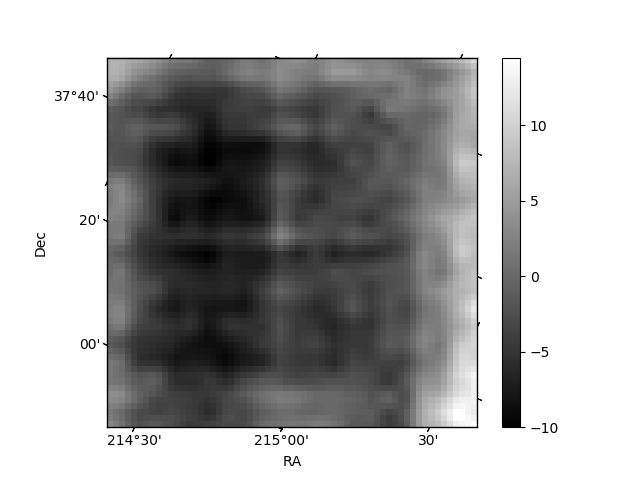
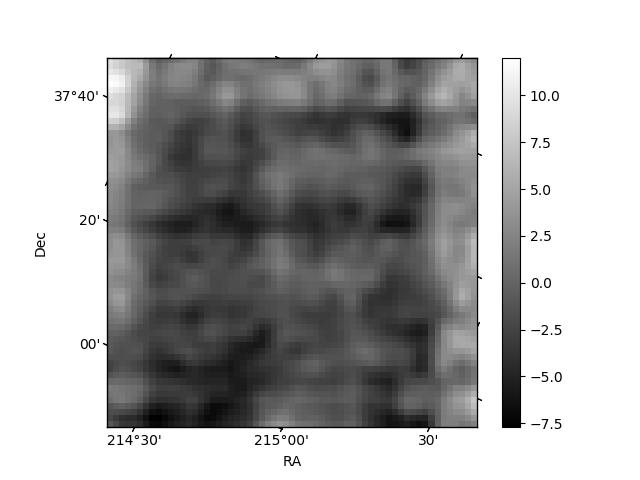
Histogram calculated using DETX and DETY for each event in the final _common_clean file
| Quadrant A | 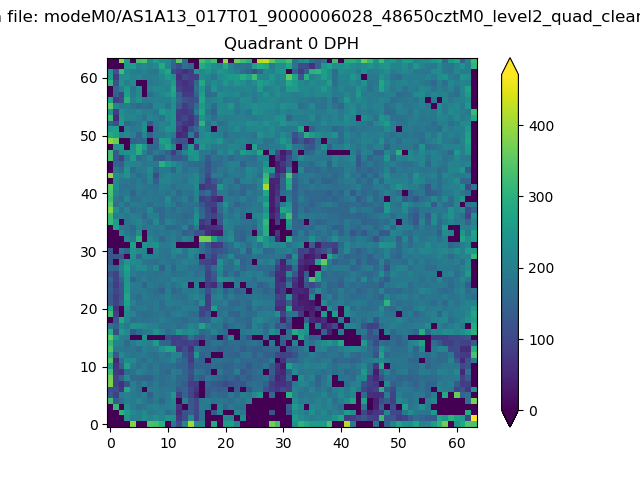 |
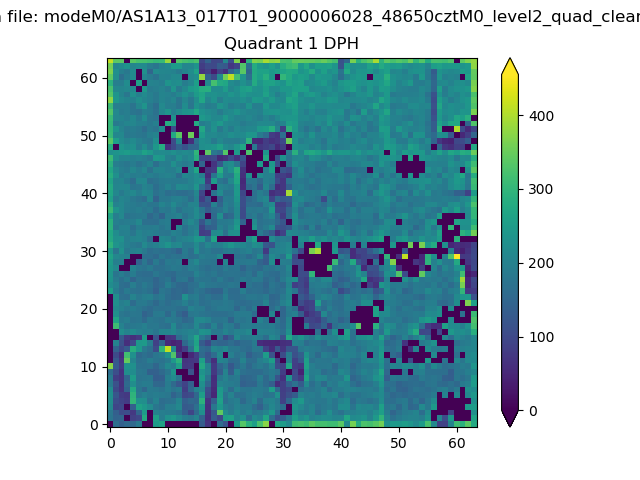 |
Quadrant B |
|---|---|---|---|
| Quadrant D | 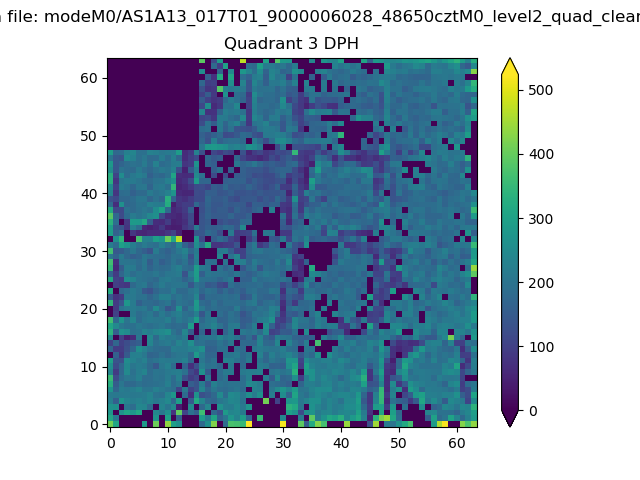 |
 |
Quadrant C |
| Plot type | Count rate plots | Images |
|---|---|---|
| Comparison with Poisson distribution Blue bars denote a histogram of data divided into 1 sec bins. Red curve is a Poisson curve with rate = median count rate of data. |
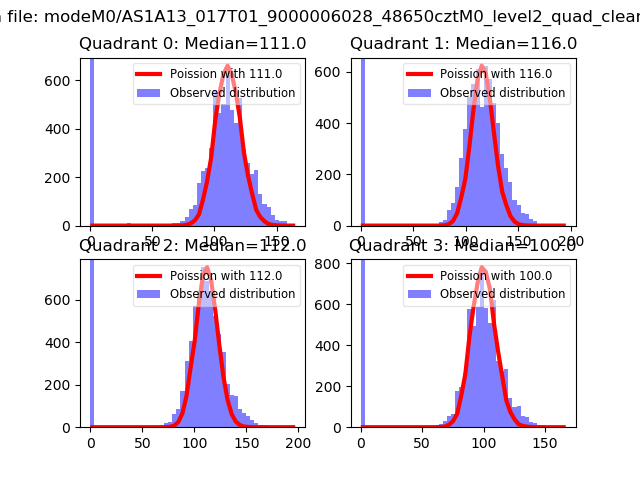 |
 |
| Quadrant-wise count rates Data is divided into 100 sec bins |
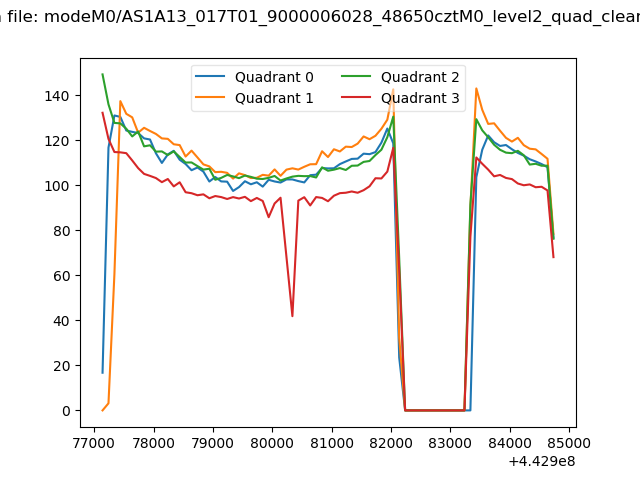 |
|
| Module-wise count rates for Quadrant A Data is divided into 100 sec bins |
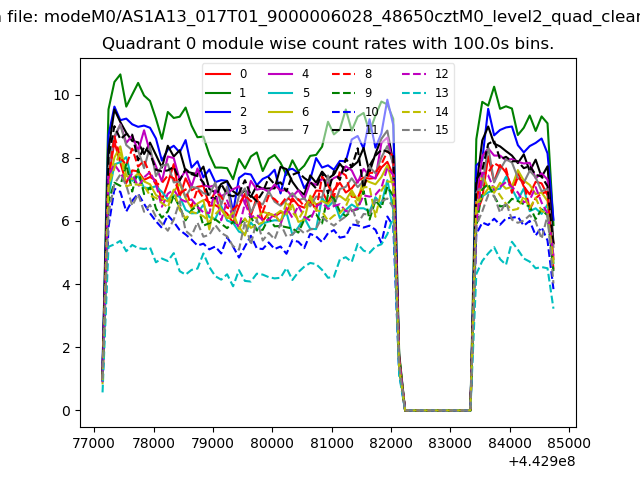 |
 |
| Module-wise count rates for Quadrant B Data is divided into 100 sec bins |
 |
 |
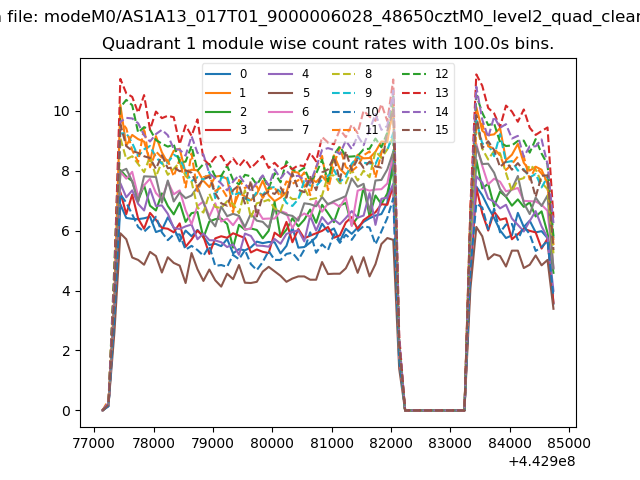
| Module-wise count rates for Quadrant C Data is divided into 100 sec bins |
 |
 |
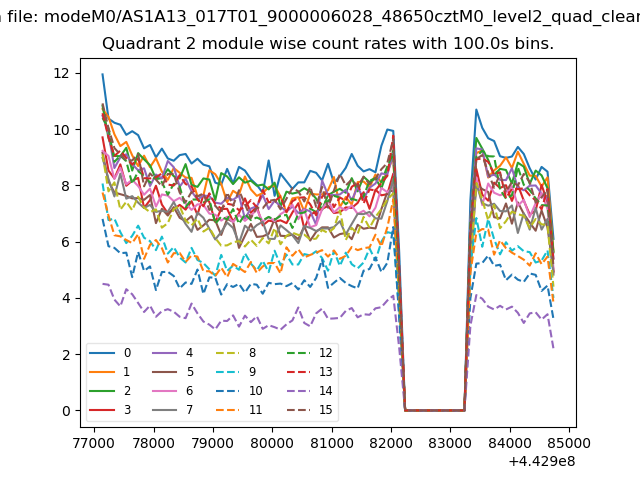
| Module-wise count rates for Quadrant D Data is divided into 100 sec bins |
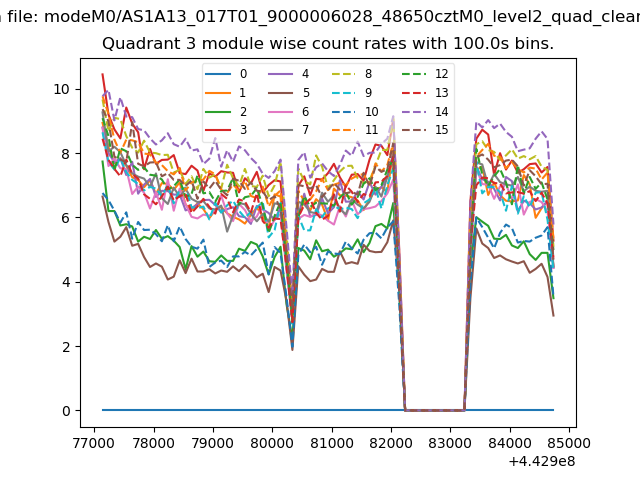 |
 |
| Parameter | Plot |
|---|---|
| CZT HV Monitor | 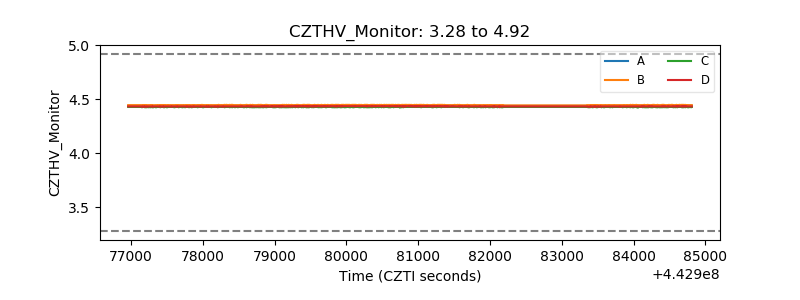 |
| D_VDD | 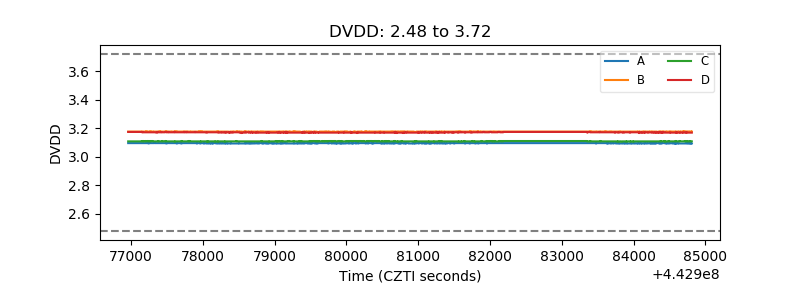 |
| Temperature 1 | 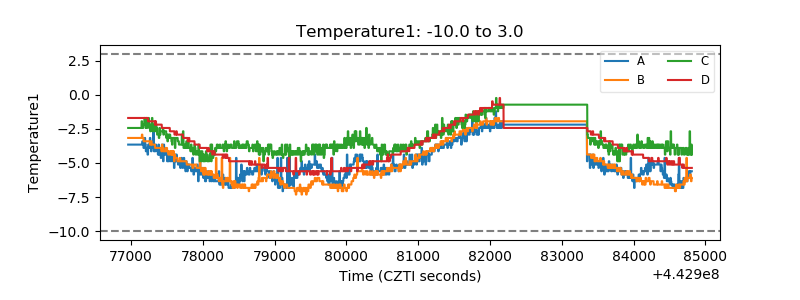 |
| Veto HV Monitor | 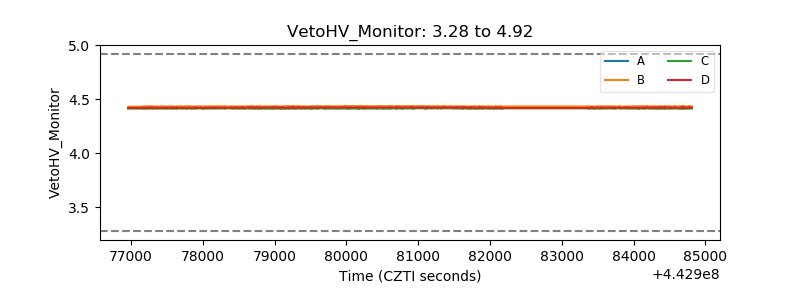 |
| Veto LLD | 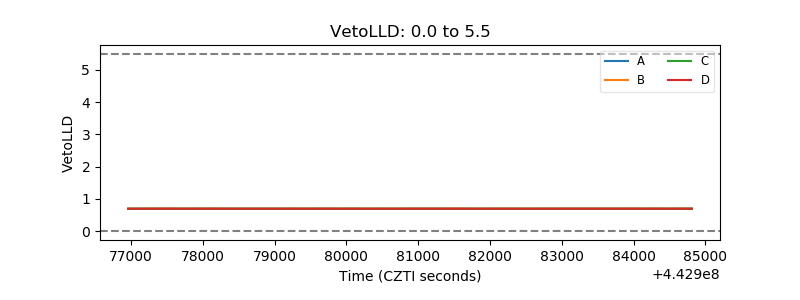 |
| Alpha Counter | 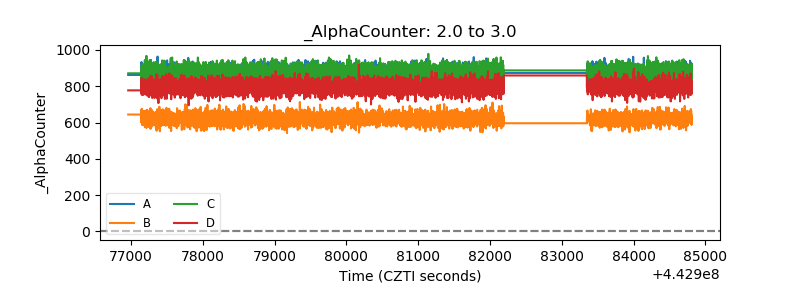 |
| _CPM_Rate | 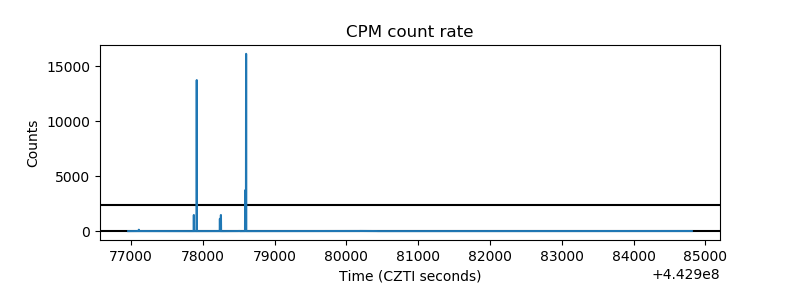 |
| CZT Counter | 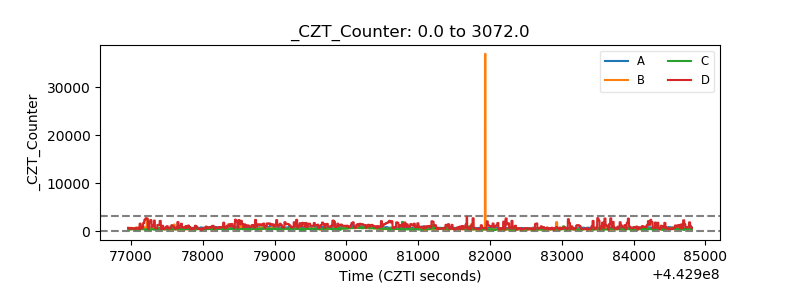 |
| +2.5 Volts monitor | 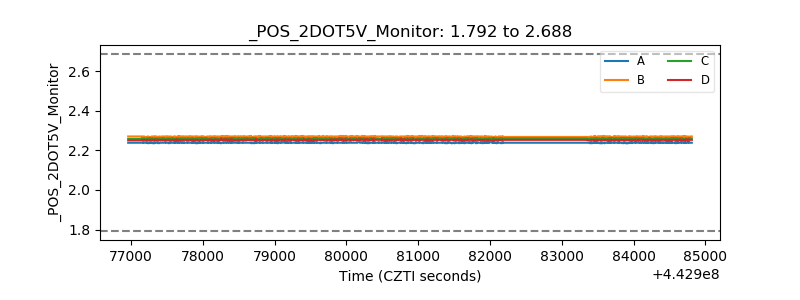 |
| +5 Volts monitor | 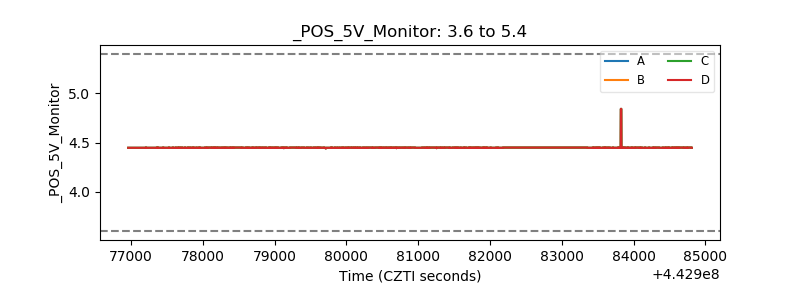 |
| _ROLL_ROT | 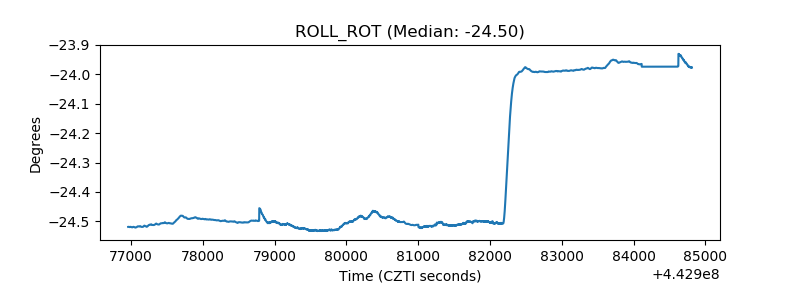 |
| _Roll_DEC | 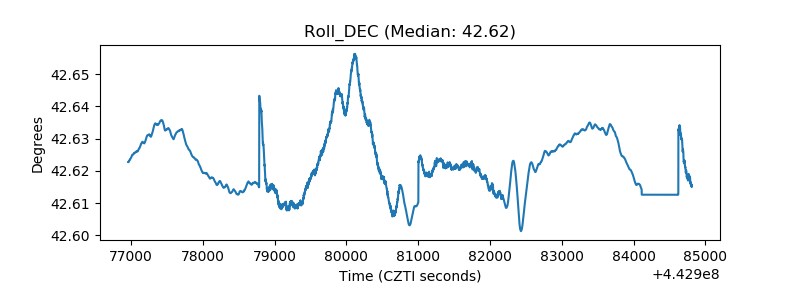 |
| _Roll_RA | 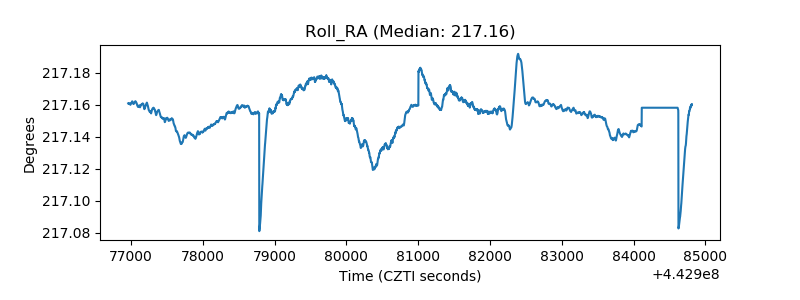 |
| Veto Counter | 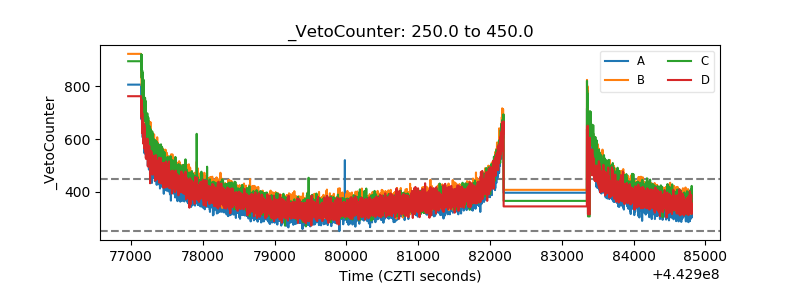 |