| Param | Original file | Final file |
|---|---|---|
| Filename | modeM0/AS1A13_024T02_9000006026_44812cztM0_level2.fits | modeM0/AS1A13_024T02_9000006026_44812cztM0_level2_quad_clean.evt |
| Size (bytes) | 940,308,480 | 117,889,920 |
| Size | 896.7 MB | 112.4 MB |
| Events in quadrant A | 13,956,714 | 555,480 |
| Events in quadrant B | 5,015,764 | 863,916 |
| Events in quadrant C | 3,727,246 | 867,882 |
| Events in quadrant D | 11,465,203 | 703,512 |
| Mode SS | |||
|---|---|---|---|
| Quadrant | BADHDUFLAG | Total packets | Discarded packets |
| A | 0 | 170 | 0 |
| B | 0 | 170 | 0 |
| C | 0 | 170 | 0 |
| D | 0 | 170 | 0 |
| Mode M0 | |||
|---|---|---|---|
| Quadrant | BADHDUFLAG | Total packets | Discarded packets |
| A | 0 | 47266 | 2 |
| B | 0 | 20965 | 2 |
| C | 0 | 17501 | 2 |
| D | 0 | 39937 | 2 |
| Mode M9 | |||
|---|---|---|---|
| Quadrant | BADHDUFLAG | Total packets | Discarded packets |
| A | 0 | 1 | 0 |
| B | 0 | 1 | 0 |
| C | 0 | 1 | 0 |
| D | 0 | 1 | 0 |
| Quadrant | Total seconds | Saturated seconds | Saturation percentage |
|---|---|---|---|
| A | 8317 | 3328 | 40.014428% |
| B | 8318 | 573 | 6.888675% |
| C | 8318 | 41 | 0.492907% |
| D | 8318 | 1228 | 14.763164% |
Noise dominated data is calculated using 1-second bins in cleaned event files. If a bin has >2000 counts, and if more than 50% of those come from <1% of pixels, then it is considered to be noise-dominated and hence unusable.
| Quadrant | # 1 sec bins | Bins with >0 counts | Bins with >2000 counts | High rate bins dominated by noise | Noise dominated (total time) | Noise dominated (detector-on time) | Marked lightcurve |
|---|---|---|---|---|---|---|---|
| A | 8426 | 8316 | 2929 | 2929 | 34.76% | 35.22% | 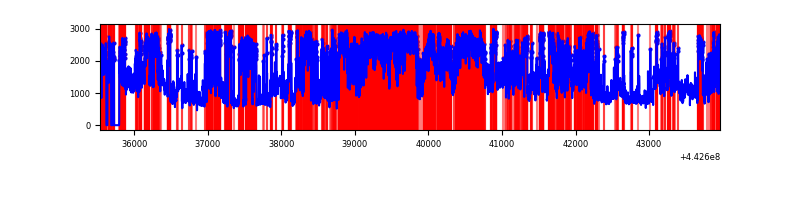 |
| B | 8428 | 8321 | 421 | 421 | 5.00% | 5.06% | 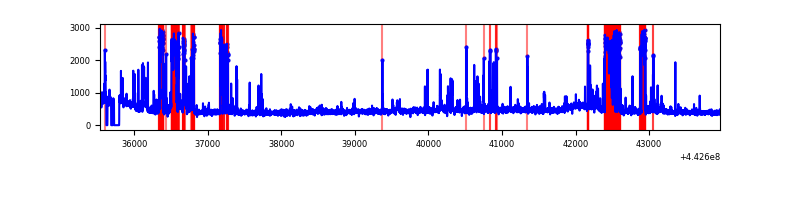 |
| C | 8428 | 8321 | 16 | 16 | 0.19% | 0.19% | 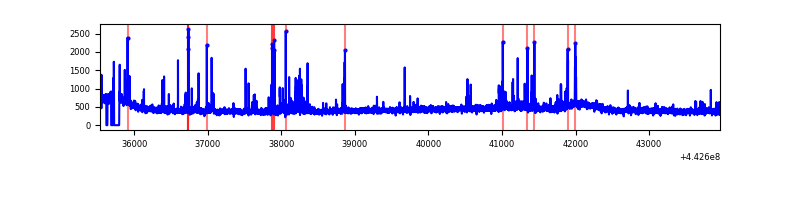 |
| D | 8428 | 8318 | 1114 | 1114 | 13.22% | 13.39% | 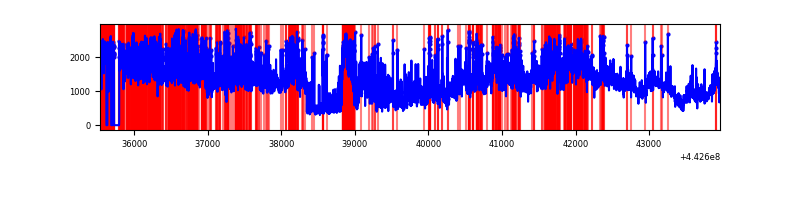 |
Top three noisy pixels from each quadrant. If the there are fewer than three noisy pixels in the level2.evt file, extra rows are filled as -1
| Pixel properties | Quadrant properties | ||||||
|---|---|---|---|---|---|---|---|
| Quadrant | DetID | PixID | Counts | Sigma | Mean | Median | Sigma |
| A | 15 | 223 | 8986811 | 59047.39 | 732 | 715 | 152.2 |
| A | 10 | 83 | 1847440 | 12134.78 | 732 | 715 | 152.2 |
| A | 13 | 248 | 230182 | 1507.82 | 732 | 715 | 152.2 |
| B | 0 | 189 | 1314824 | 7560.64 | 882 | 853 | 173.8 |
| B | 5 | 255 | 60636 | 343.99 | 882 | 853 | 173.8 |
| B | 0 | 155 | 28134 | 156.98 | 882 | 853 | 173.8 |
| C | 1 | 3 | 112389 | 538.54 | 890 | 894 | 207.0 |
| C | 14 | 254 | 46598 | 220.76 | 890 | 894 | 207.0 |
| C | 2 | 14 | 43888 | 207.67 | 890 | 894 | 207.0 |
| D | 13 | 187 | 4929527 | 23590.66 | 833 | 807 | 208.9 |
| D | 1 | 52 | 2475166 | 11843.19 | 833 | 807 | 208.9 |
| D | 2 | 249 | 288612 | 1377.54 | 833 | 807 | 208.9 |
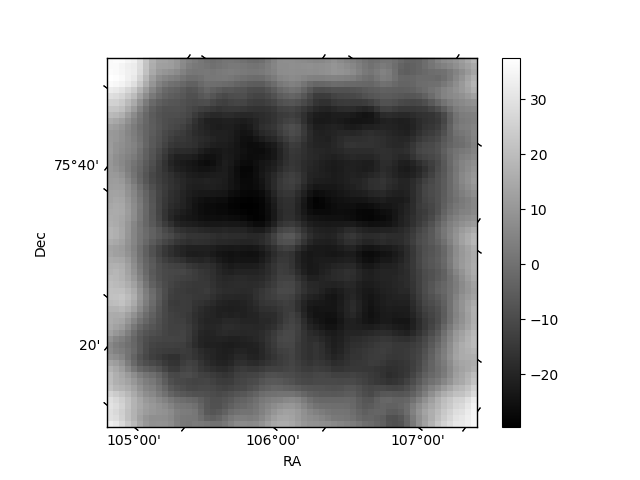
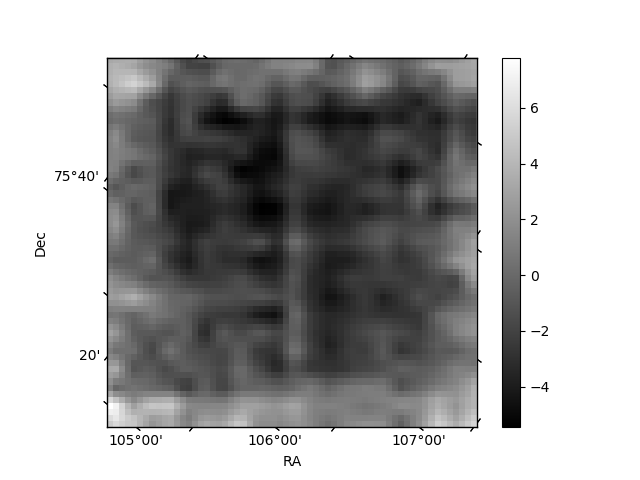
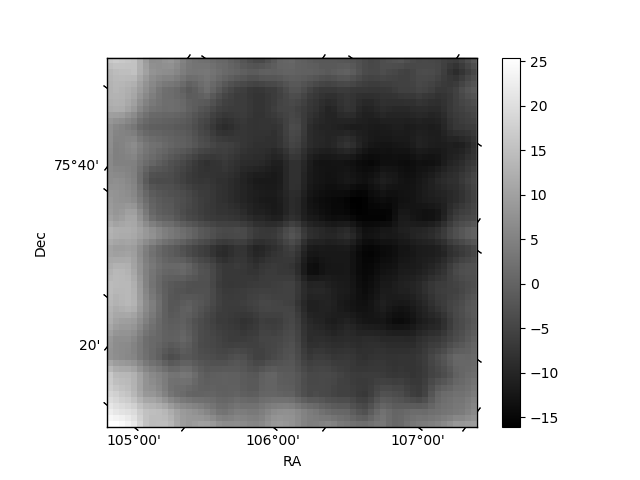
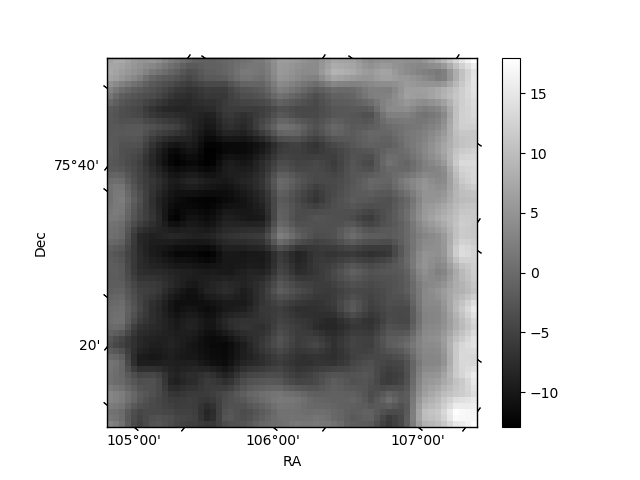
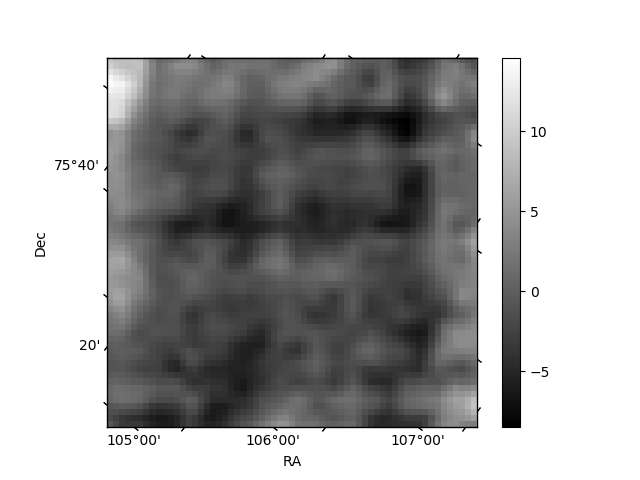
Histogram calculated using DETX and DETY for each event in the final _common_clean file
| Quadrant A | 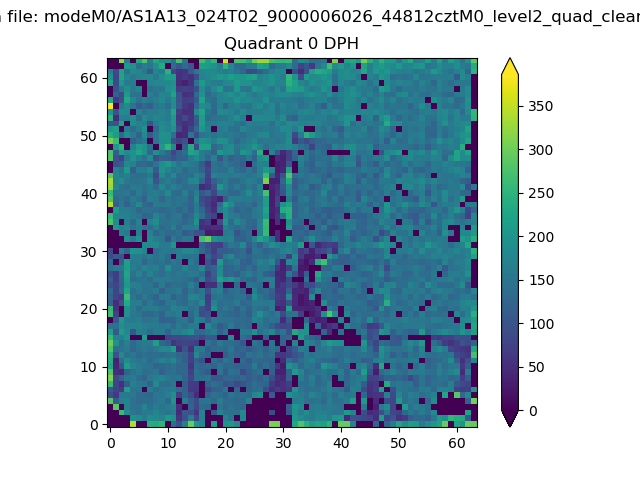 |
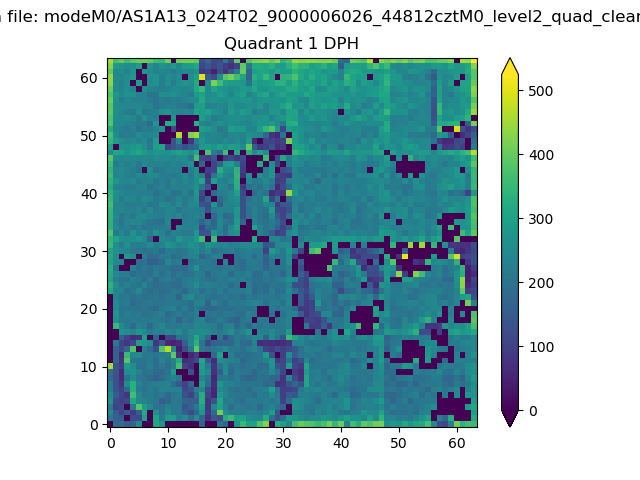 |
Quadrant B |
|---|---|---|---|
| Quadrant D | 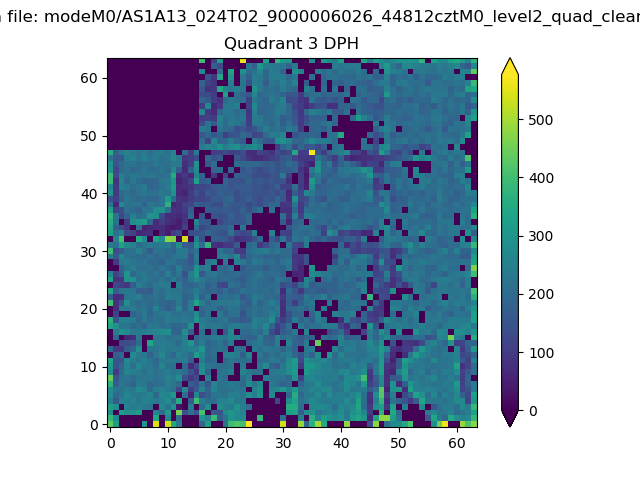 |
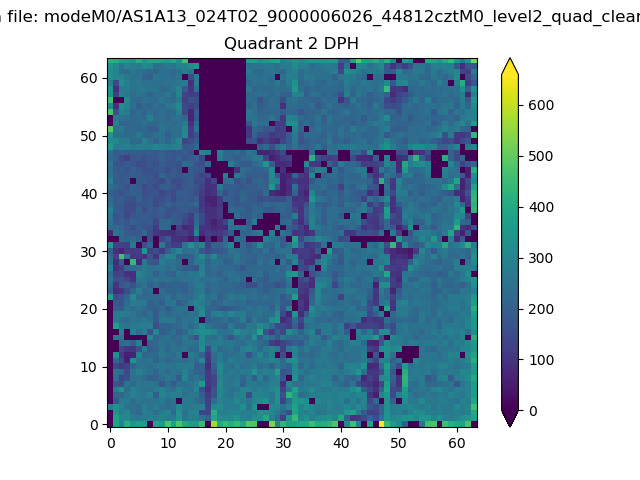 |
Quadrant C |
| Plot type | Count rate plots | Images |
|---|---|---|
| Comparison with Poisson distribution Blue bars denote a histogram of data divided into 1 sec bins. Red curve is a Poisson curve with rate = median count rate of data. |
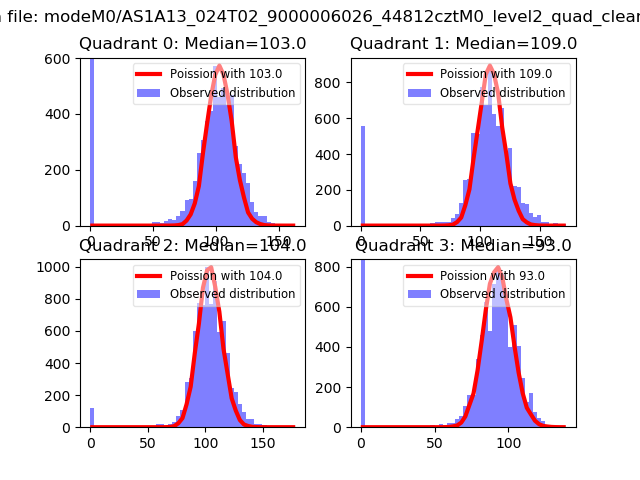 |
 |
| Quadrant-wise count rates Data is divided into 100 sec bins |
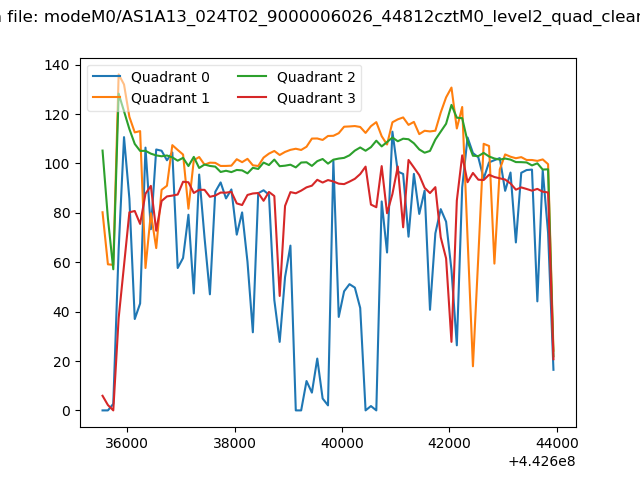 |
|
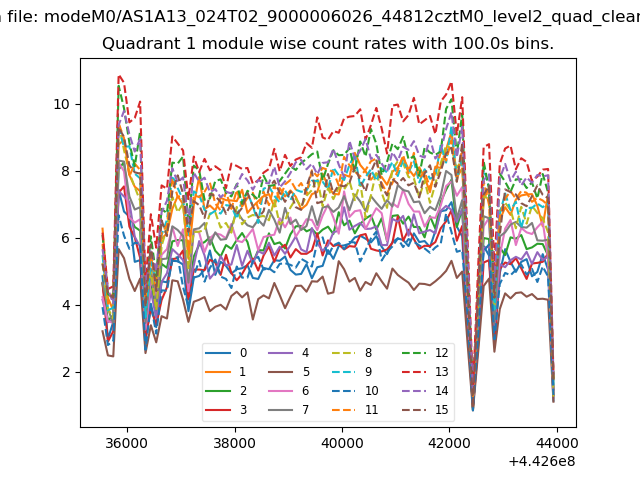
| Module-wise count rates for Quadrant A Data is divided into 100 sec bins |
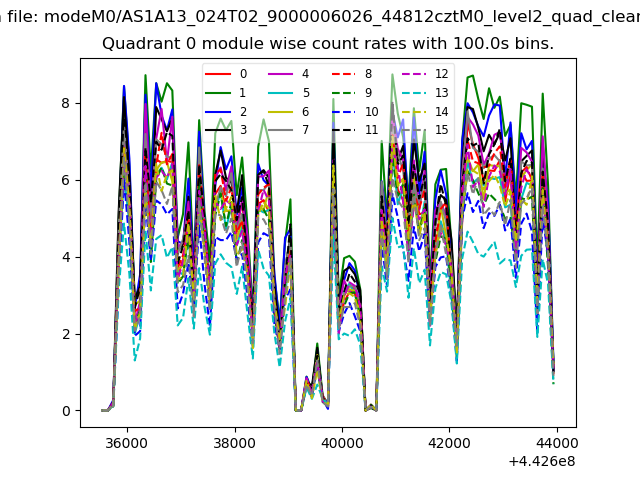 |
 |
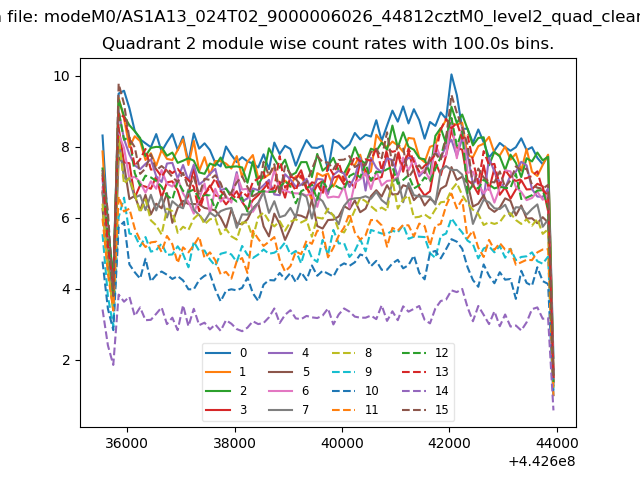
| Module-wise count rates for Quadrant B Data is divided into 100 sec bins |
 |
 |
| Module-wise count rates for Quadrant C Data is divided into 100 sec bins |
 |
 |
| Module-wise count rates for Quadrant D Data is divided into 100 sec bins |
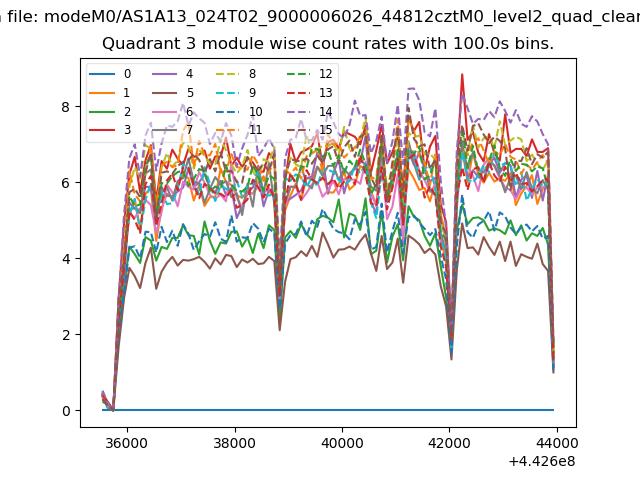 |
 |
| Parameter | Plot |
|---|---|
| CZT HV Monitor | 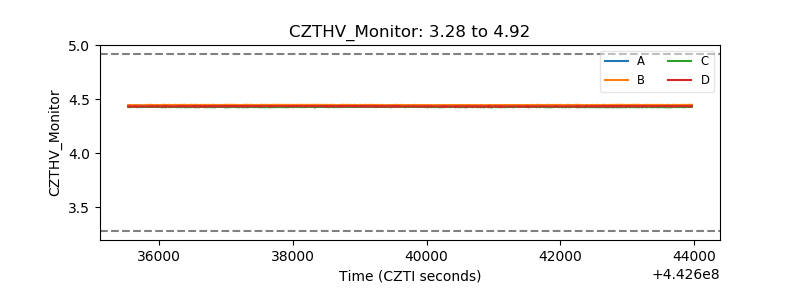 |
| D_VDD | 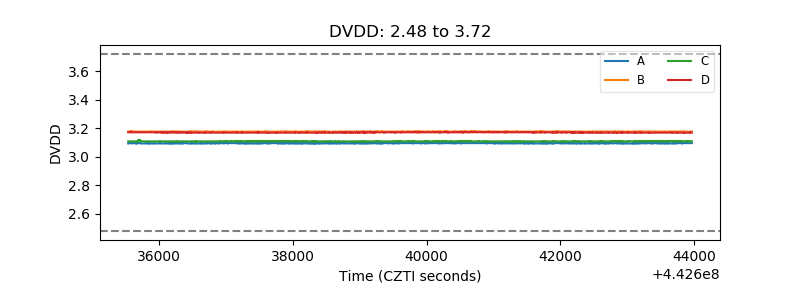 |
| Temperature 1 | 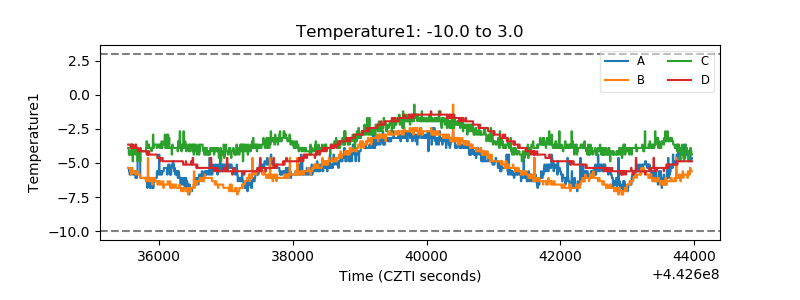 |
| Veto HV Monitor | 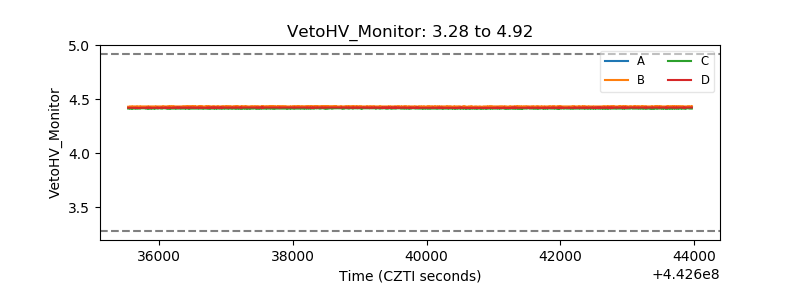 |
| Veto LLD | 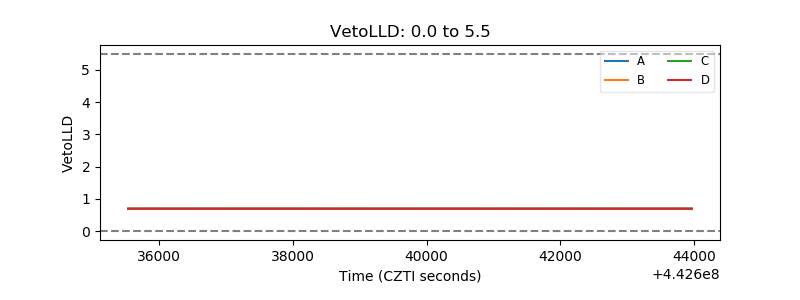 |
| Alpha Counter | 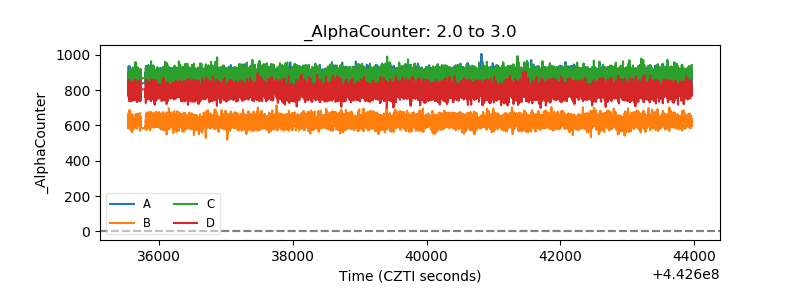 |
| _CPM_Rate | 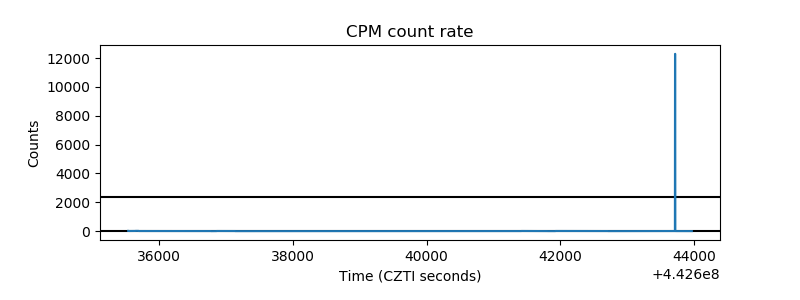 |
| CZT Counter | 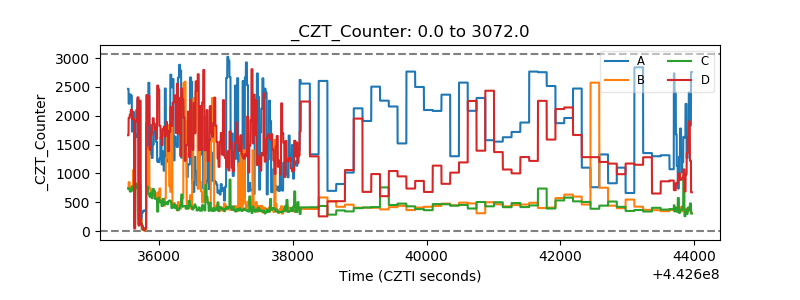 |
| +2.5 Volts monitor | 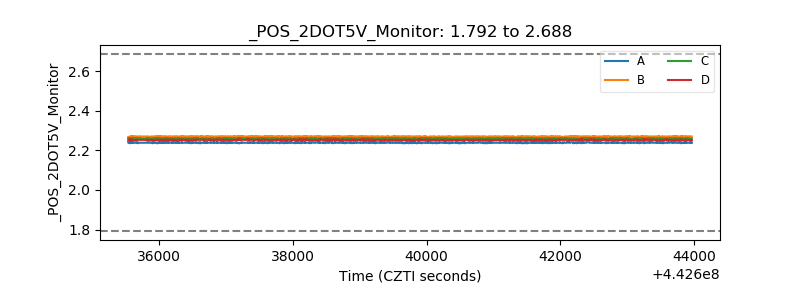 |
| +5 Volts monitor | 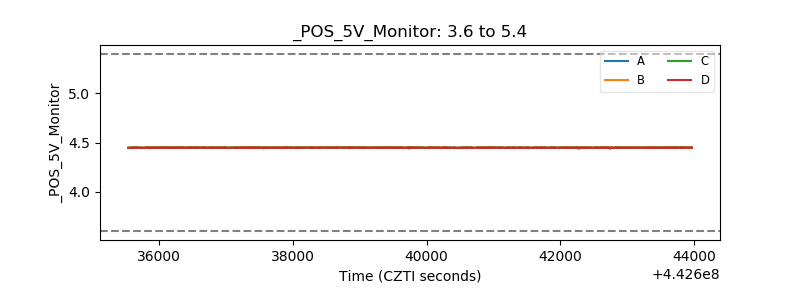 |
| _ROLL_ROT | 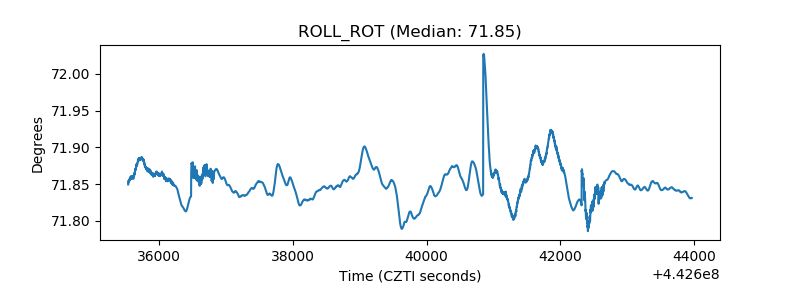 |
| _Roll_DEC | 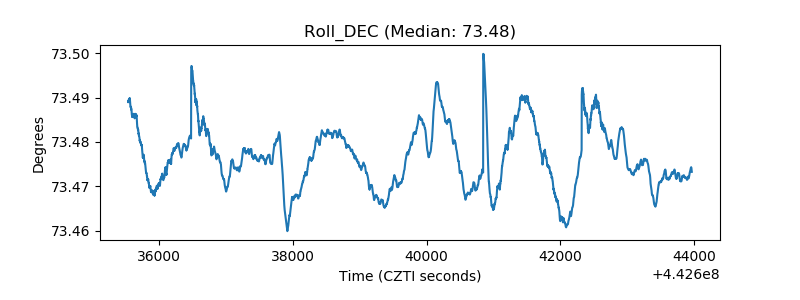 |
| _Roll_RA | 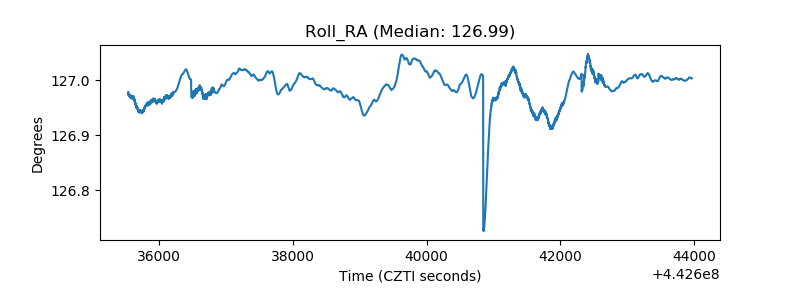 |
| Veto Counter | 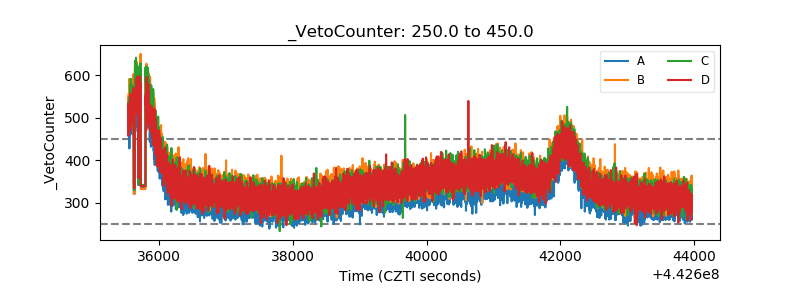 |