| Param | Original file | Final file |
|---|---|---|
| Filename | modeM0/AS1A13_024T02_9000006026_44813cztM0_level2.fits | modeM0/AS1A13_024T02_9000006026_44813cztM0_level2_quad_clean.evt |
| Size (bytes) | 796,446,720 | 107,412,480 |
| Size | 759.6 MB | 102.4 MB |
| Events in quadrant A | 12,404,759 | 524,703 |
| Events in quadrant B | 3,668,553 | 787,209 |
| Events in quadrant C | 3,240,917 | 756,939 |
| Events in quadrant D | 9,597,576 | 669,609 |
| Mode SS | |||
|---|---|---|---|
| Quadrant | BADHDUFLAG | Total packets | Discarded packets |
| A | 0 | 146 | 0 |
| B | 0 | 146 | 0 |
| C | 0 | 146 | 0 |
| D | 0 | 146 | 0 |
| Mode M0 | |||
|---|---|---|---|
| Quadrant | BADHDUFLAG | Total packets | Discarded packets |
| A | 0 | 41989 | 0 |
| B | 0 | 16251 | 0 |
| C | 0 | 15380 | 0 |
| D | 0 | 33754 | 4 |
| Quadrant | Total seconds | Saturated seconds | Saturation percentage |
|---|---|---|---|
| A | 7381 | 2761 | 37.406855% |
| B | 7382 | 189 | 2.560282% |
| C | 7382 | 28 | 0.379301% |
| D | 7381 | 460 | 6.232218% |
Noise dominated data is calculated using 1-second bins in cleaned event files. If a bin has >2000 counts, and if more than 50% of those come from <1% of pixels, then it is considered to be noise-dominated and hence unusable.
| Quadrant | # 1 sec bins | Bins with >0 counts | Bins with >2000 counts | High rate bins dominated by noise | Noise dominated (total time) | Noise dominated (detector-on time) | Marked lightcurve |
|---|---|---|---|---|---|---|---|
| A | 7380 | 7380 | 2596 | 2596 | 35.18% | 35.18% | 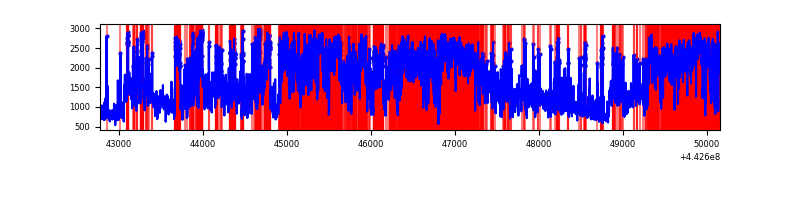 |
| B | 7382 | 7382 | 102 | 102 | 1.38% | 1.38% | 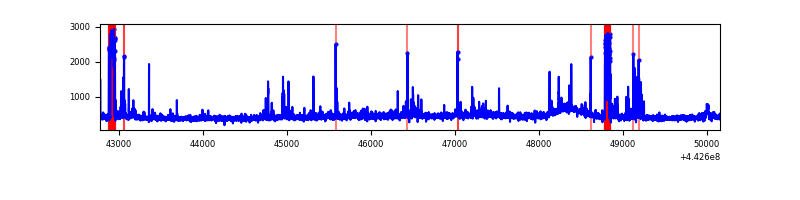 |
| C | 7381 | 7381 | 24 | 24 | 0.33% | 0.33% | 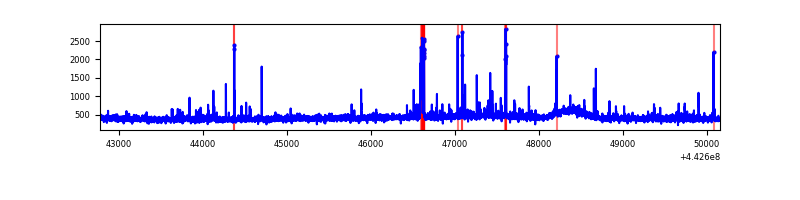 |
| D | 7381 | 7381 | 398 | 398 | 5.39% | 5.39% | 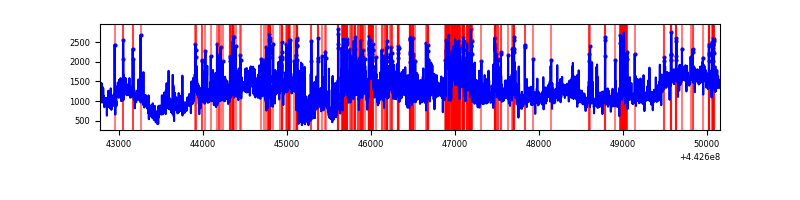 |
Top three noisy pixels from each quadrant. If the there are fewer than three noisy pixels in the level2.evt file, extra rows are filled as -1
| Pixel properties | Quadrant properties | ||||||
|---|---|---|---|---|---|---|---|
| Quadrant | DetID | PixID | Counts | Sigma | Mean | Median | Sigma |
| A | 15 | 223 | 7524476 | 52116.8 | 696 | 681 | 144.4 |
| A | 10 | 83 | 1790372 | 12397.06 | 696 | 681 | 144.4 |
| A | 13 | 248 | 278649 | 1925.46 | 696 | 681 | 144.4 |
| B | 0 | 189 | 191000 | 1220.79 | 787 | 760 | 155.8 |
| B | 5 | 255 | 174398 | 1114.26 | 787 | 760 | 155.8 |
| B | 0 | 190 | 38344 | 241.18 | 787 | 760 | 155.8 |
| C | 2 | 14 | 72727 | 398.48 | 772 | 775 | 180.6 |
| C | 12 | 2 | 50081 | 273.06 | 772 | 775 | 180.6 |
| C | 14 | 254 | 48706 | 265.45 | 772 | 775 | 180.6 |
| D | 13 | 187 | 4858354 | 25625.09 | 752 | 728 | 189.6 |
| D | 1 | 52 | 894062 | 4712.54 | 752 | 728 | 189.6 |
| D | 2 | 249 | 218307 | 1147.78 | 752 | 728 | 189.6 |
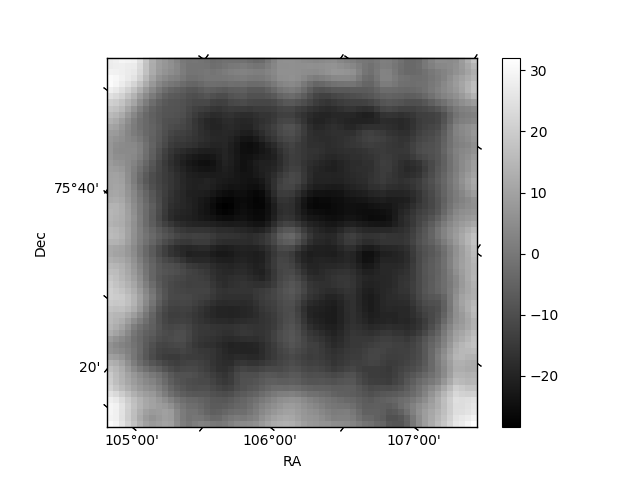
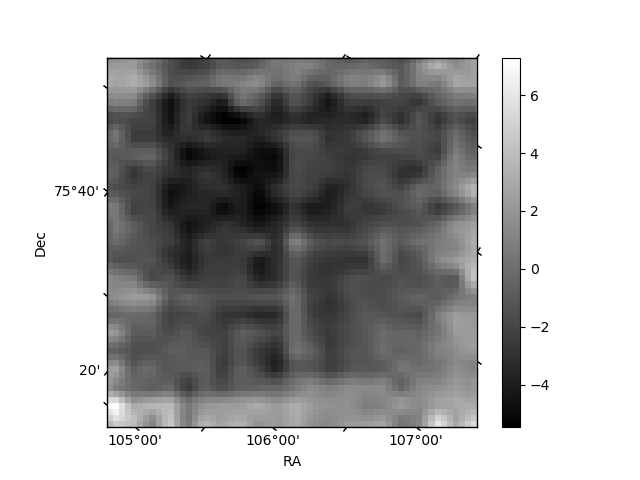
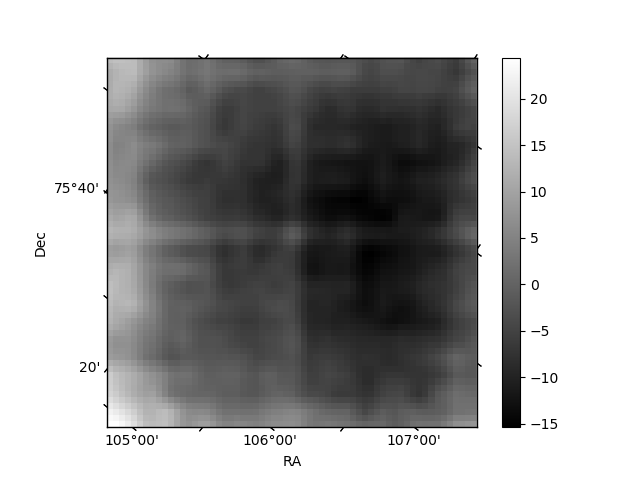
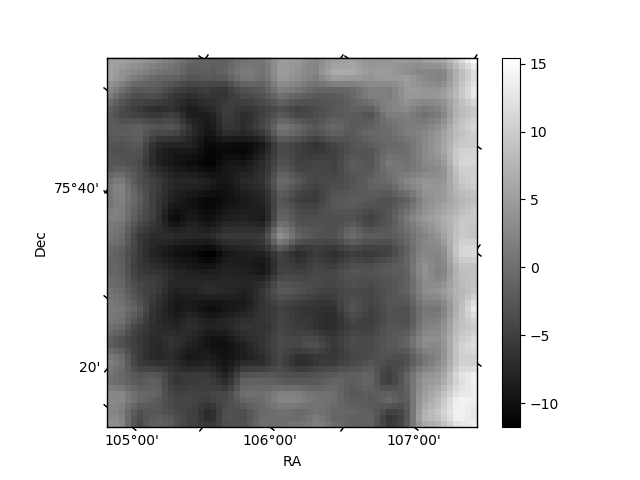
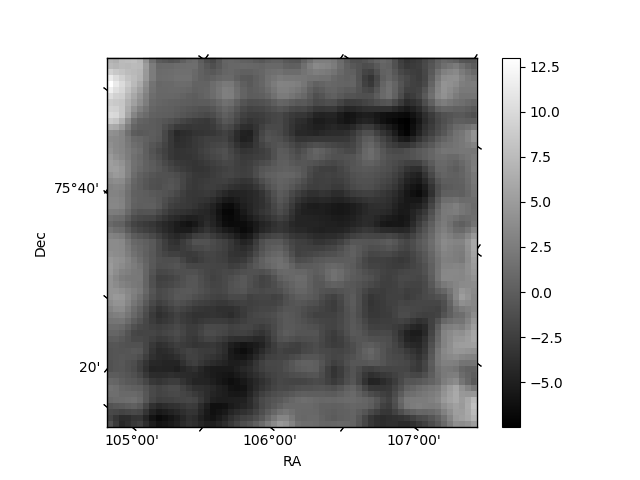
Histogram calculated using DETX and DETY for each event in the final _common_clean file
| Quadrant A | 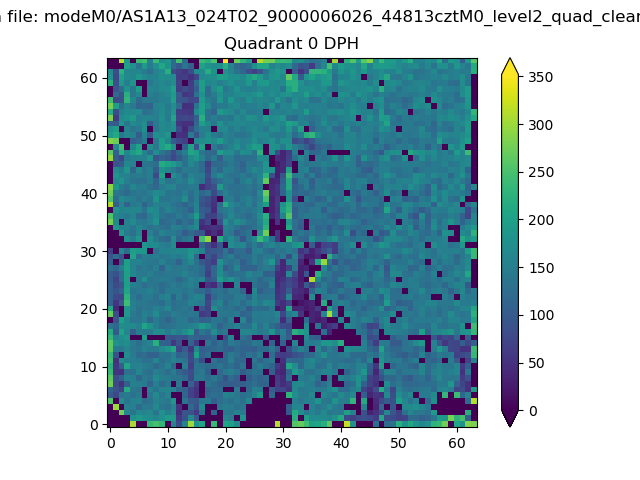 |
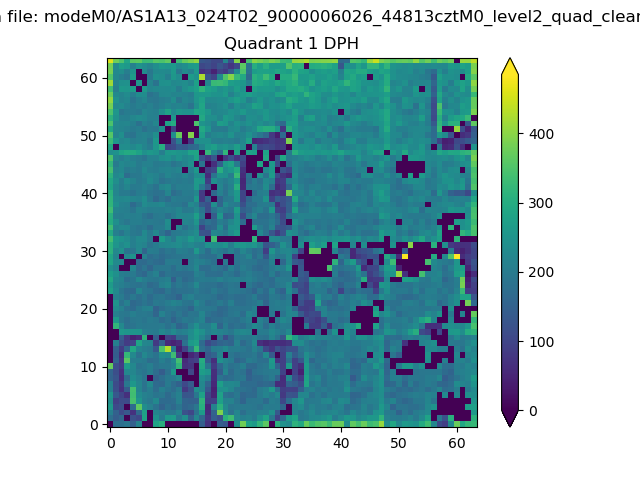 |
Quadrant B |
|---|---|---|---|
| Quadrant D |  |
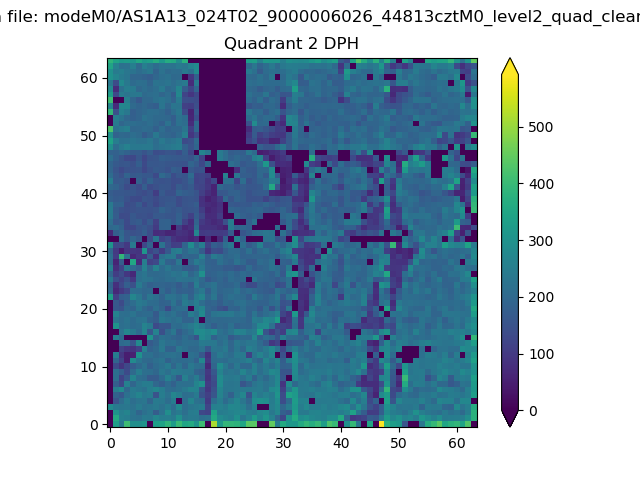 |
Quadrant C |
| Plot type | Count rate plots | Images |
|---|---|---|
| Comparison with Poisson distribution Blue bars denote a histogram of data divided into 1 sec bins. Red curve is a Poisson curve with rate = median count rate of data. |
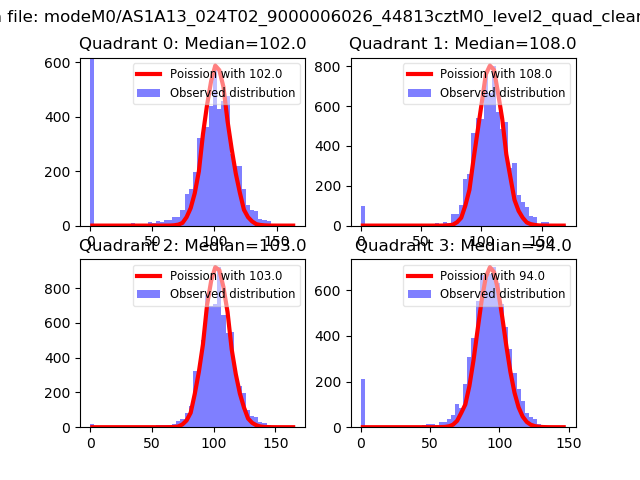 |
 |
| Quadrant-wise count rates Data is divided into 100 sec bins |
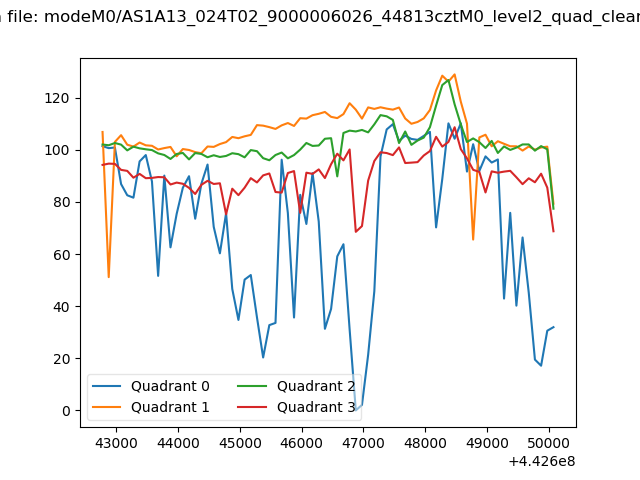 |
|
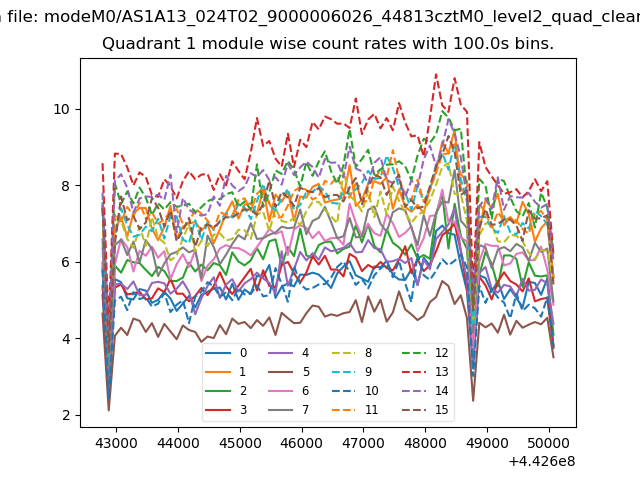
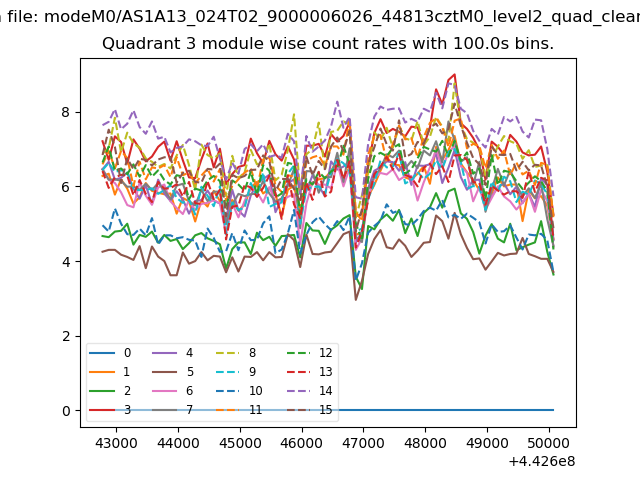
| Module-wise count rates for Quadrant A Data is divided into 100 sec bins |
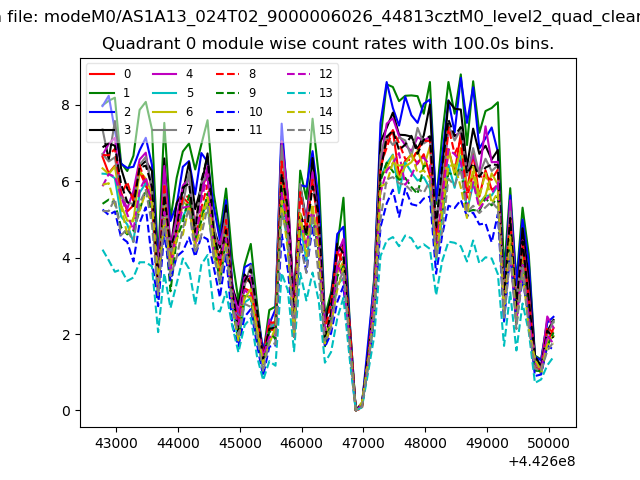 |
 |
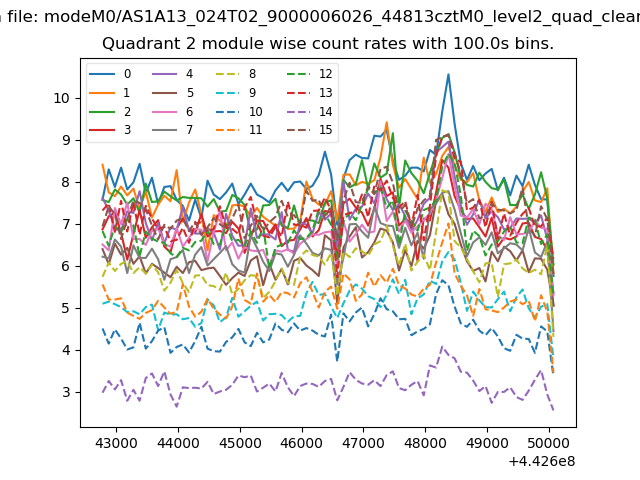
| Module-wise count rates for Quadrant B Data is divided into 100 sec bins |
 |
 |
| Module-wise count rates for Quadrant C Data is divided into 100 sec bins |
 |
 |
| Module-wise count rates for Quadrant D Data is divided into 100 sec bins |
 |
 |
| Parameter | Plot |
|---|---|
| CZT HV Monitor | 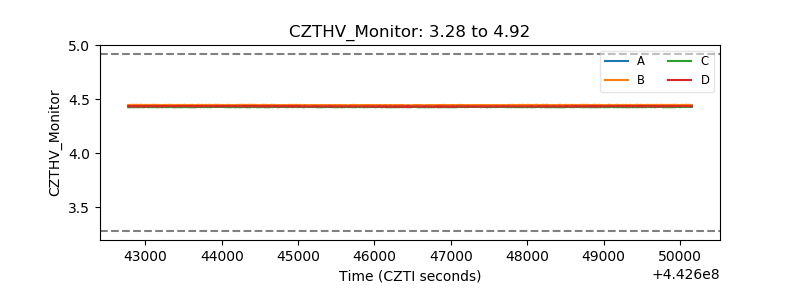 |
| D_VDD | 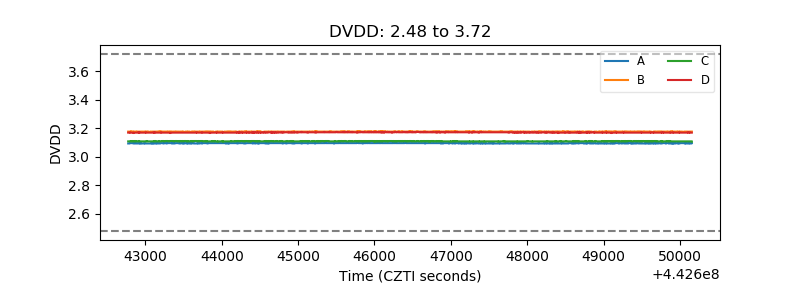 |
| Temperature 1 | 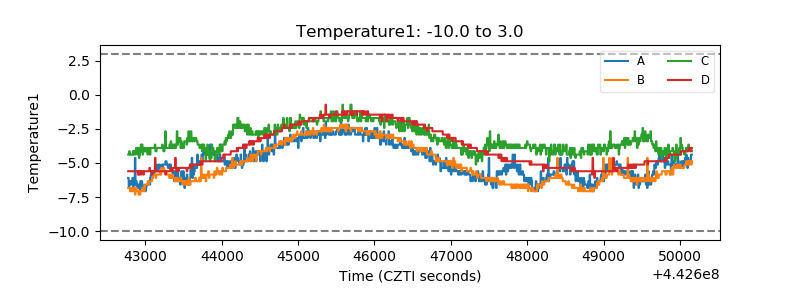 |
| Veto HV Monitor | 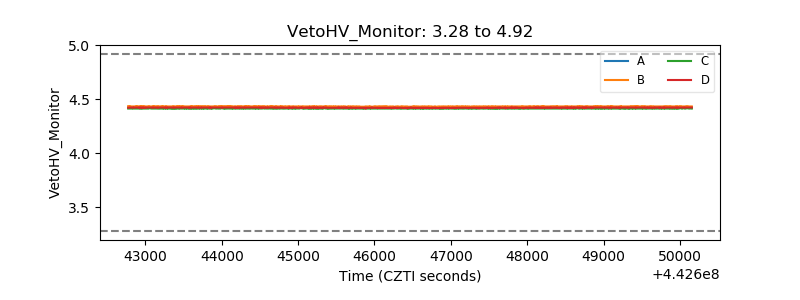 |
| Veto LLD | 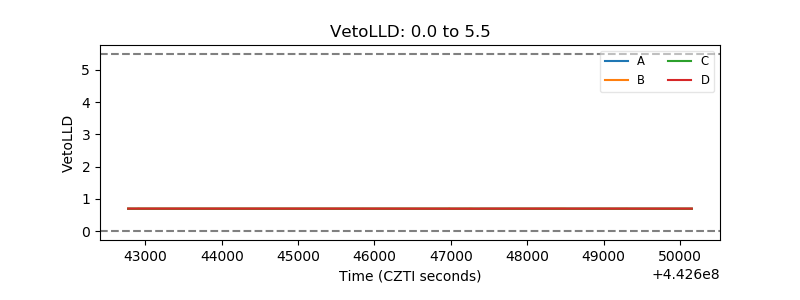 |
| Alpha Counter | 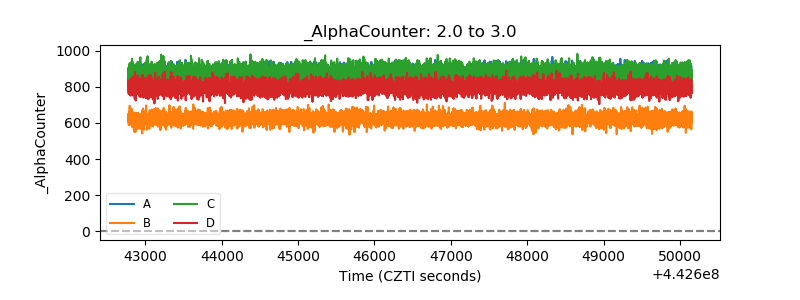 |
| _CPM_Rate | 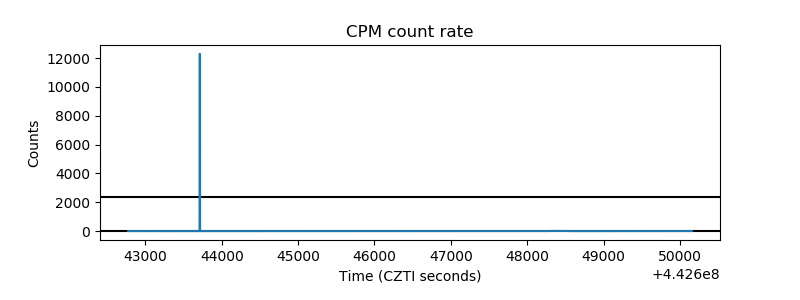 |
| CZT Counter | 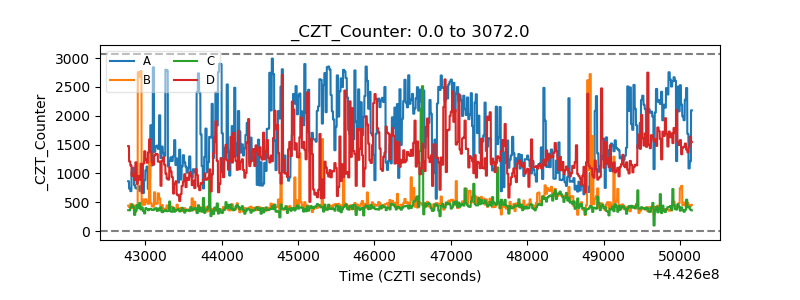 |
| +2.5 Volts monitor | 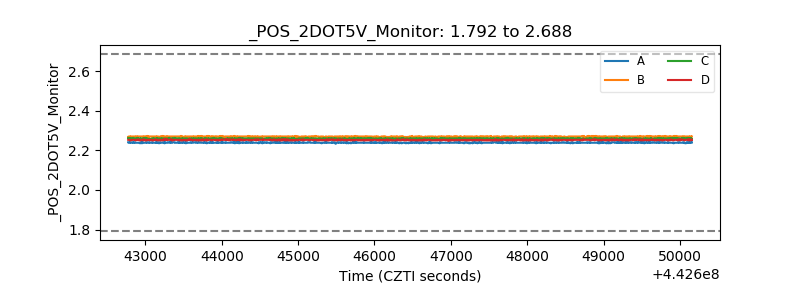 |
| +5 Volts monitor | 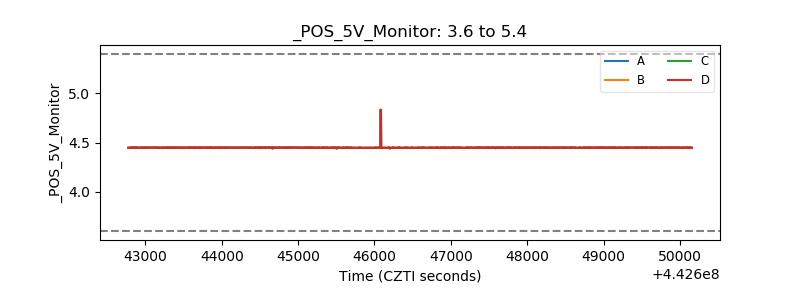 |
| _ROLL_ROT | 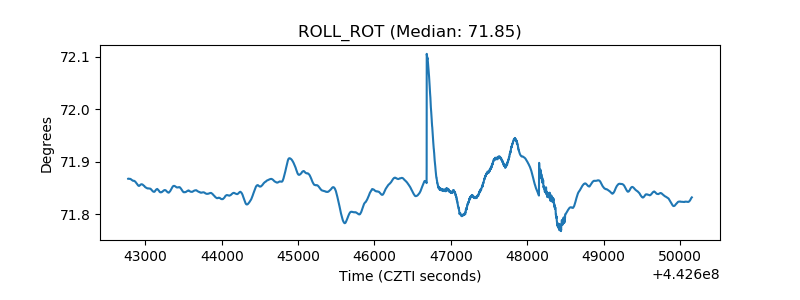 |
| _Roll_DEC | 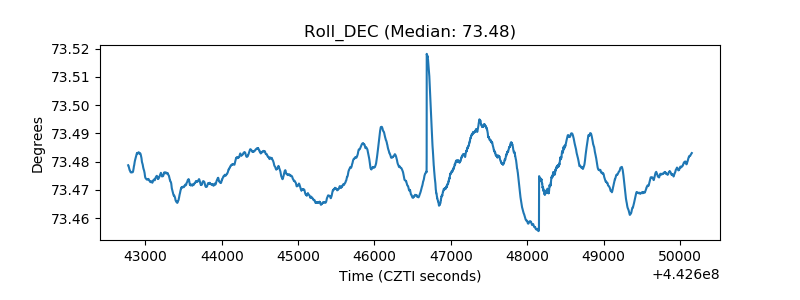 |
| _Roll_RA | 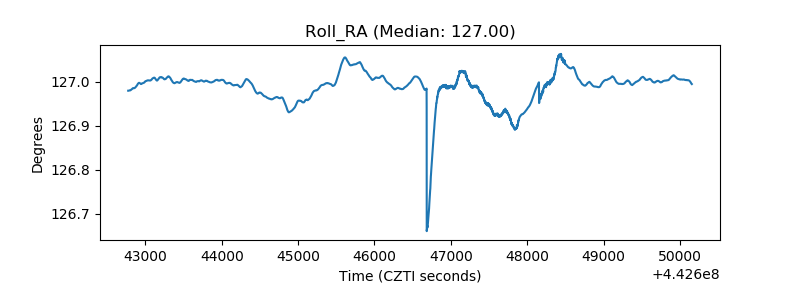 |
| Veto Counter | 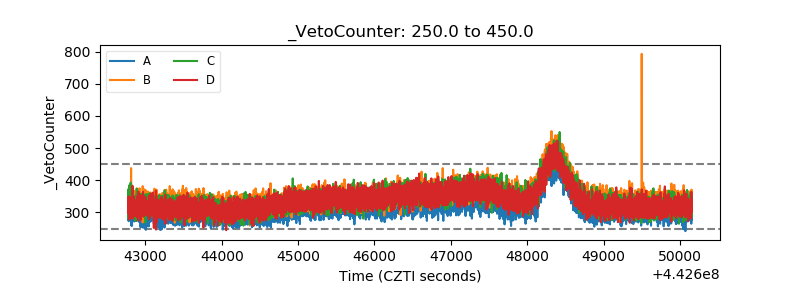 |