| Param | Original file | Final file |
|---|---|---|
| Filename | modeM0/AS1A13_024T02_9000006026_44819cztM0_level2.fits | modeM0/AS1A13_024T02_9000006026_44819cztM0_level2_quad_clean.evt |
| Size (bytes) | 636,154,560 | 101,661,120 |
| Size | 606.7 MB | 97.0 MB |
| Events in quadrant A | 7,449,561 | 650,445 |
| Events in quadrant B | 3,337,850 | 738,426 |
| Events in quadrant C | 3,087,603 | 691,419 |
| Events in quadrant D | 9,176,181 | 549,537 |
| Mode SS | |||
|---|---|---|---|
| Quadrant | BADHDUFLAG | Total packets | Discarded packets |
| A | 0 | 130 | 0 |
| B | 0 | 130 | 0 |
| C | 0 | 130 | 0 |
| D | 0 | 130 | 0 |
| Mode M0 | |||
|---|---|---|---|
| Quadrant | BADHDUFLAG | Total packets | Discarded packets |
| A | 0 | 26838 | 1 |
| B | 0 | 14277 | 1 |
| C | 0 | 13796 | 1 |
| D | 0 | 31791 | 1 |
| Mode M9 | |||
|---|---|---|---|
| Quadrant | BADHDUFLAG | Total packets | Discarded packets |
| A | 0 | 11 | 0 |
| B | 0 | 11 | 0 |
| C | 0 | 11 | 0 |
| D | 0 | 11 | 0 |
| Quadrant | Total seconds | Saturated seconds | Saturation percentage |
|---|---|---|---|
| A | 6425 | 877 | 13.649805% |
| B | 6426 | 118 | 1.836290% |
| C | 6426 | 106 | 1.649549% |
| D | 6425 | 1215 | 18.910506% |
Noise dominated data is calculated using 1-second bins in cleaned event files. If a bin has >2000 counts, and if more than 50% of those come from <1% of pixels, then it is considered to be noise-dominated and hence unusable.
| Quadrant | # 1 sec bins | Bins with >0 counts | Bins with >2000 counts | High rate bins dominated by noise | Noise dominated (total time) | Noise dominated (detector-on time) | Marked lightcurve |
|---|---|---|---|---|---|---|---|
| A | 7470 | 6426 | 659 | 659 | 8.82% | 10.26% | 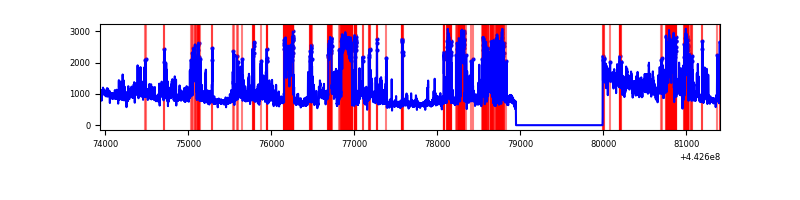 |
| B | 7471 | 6426 | 30 | 30 | 0.40% | 0.47% | 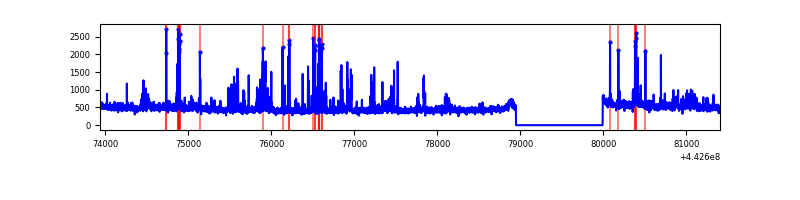 |
| C | 7471 | 6426 | 35 | 35 | 0.47% | 0.54% | 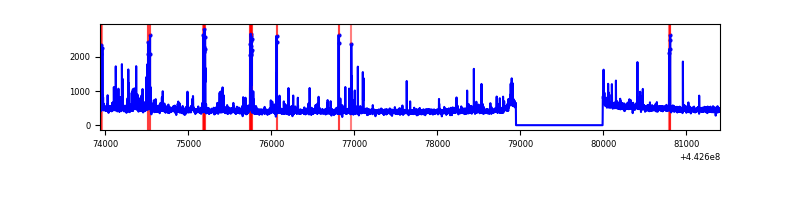 |
| D | 7470 | 6426 | 1204 | 1204 | 16.12% | 18.74% | 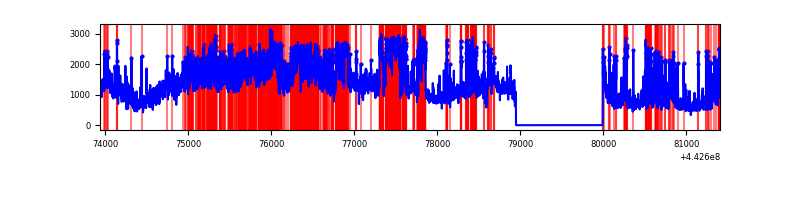 |
Top three noisy pixels from each quadrant. If the there are fewer than three noisy pixels in the level2.evt file, extra rows are filled as -1
| Pixel properties | Quadrant properties | ||||||
|---|---|---|---|---|---|---|---|
| Quadrant | DetID | PixID | Counts | Sigma | Mean | Median | Sigma |
| A | 15 | 223 | 2657304 | 18651.27 | 690 | 677 | 142.4 |
| A | 10 | 83 | 2024277 | 14207.01 | 690 | 677 | 142.4 |
| A | 13 | 248 | 82062 | 571.38 | 690 | 677 | 142.4 |
| B | 0 | 189 | 138635 | 982.97 | 718 | 697 | 140.3 |
| B | 5 | 255 | 74417 | 525.34 | 718 | 697 | 140.3 |
| B | 5 | 172 | 74338 | 524.78 | 718 | 697 | 140.3 |
| C | 14 | 254 | 109172 | 663.27 | 705 | 708 | 163.5 |
| C | 12 | 2 | 92188 | 559.41 | 705 | 708 | 163.5 |
| C | 1 | 3 | 57706 | 348.55 | 705 | 708 | 163.5 |
| D | 13 | 187 | 2911670 | 17560.7 | 656 | 633 | 165.8 |
| D | 2 | 249 | 1266356 | 7635.42 | 656 | 633 | 165.8 |
| D | 13 | 174 | 816356 | 4920.81 | 656 | 633 | 165.8 |
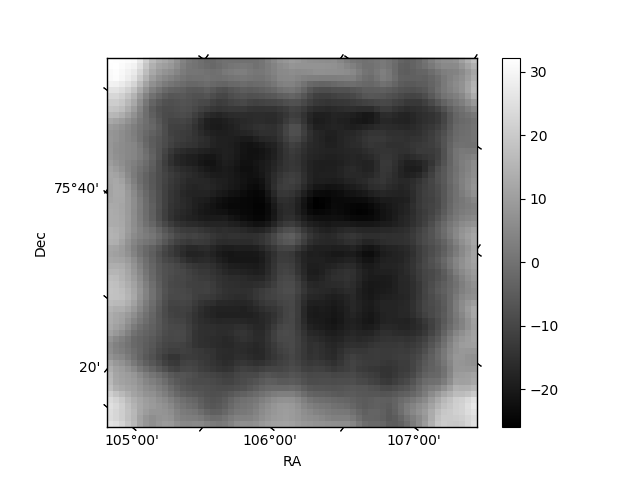
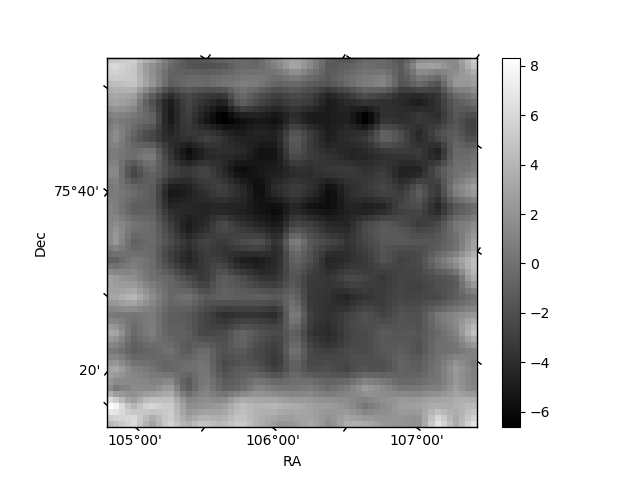
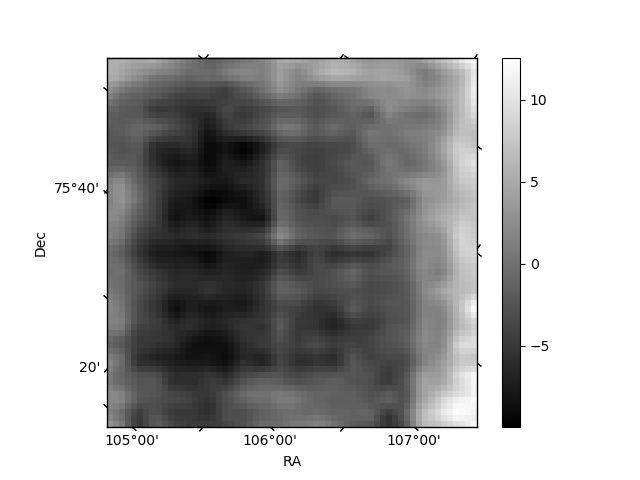
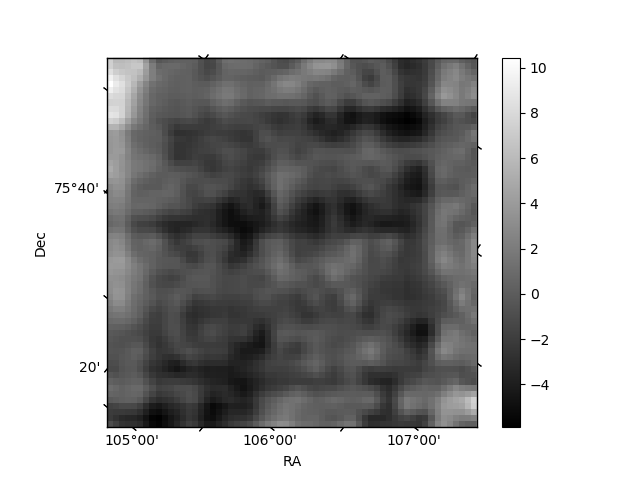
Histogram calculated using DETX and DETY for each event in the final _common_clean file
| Quadrant A | 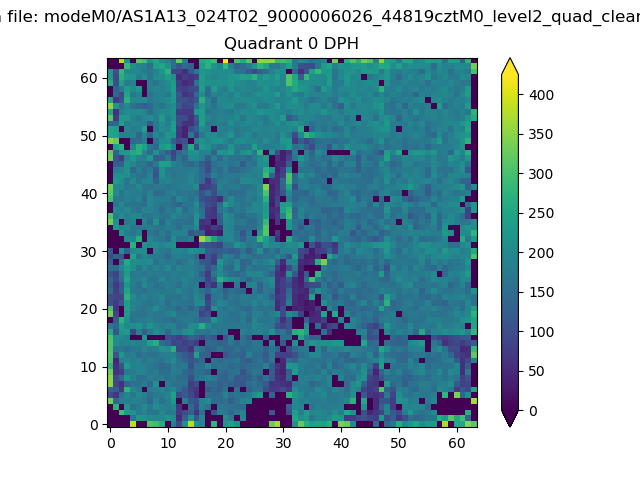 |
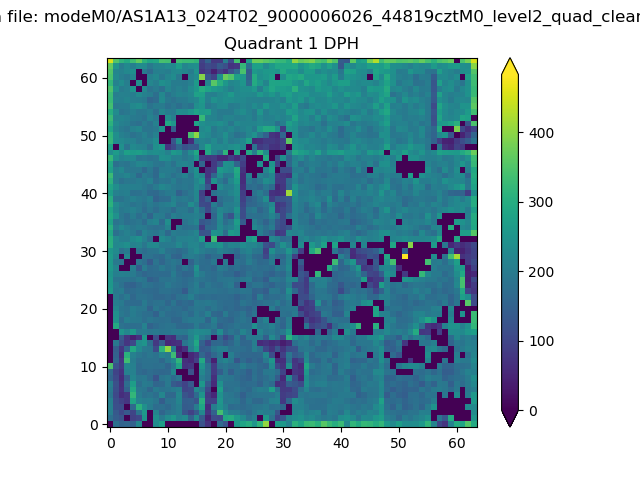 |
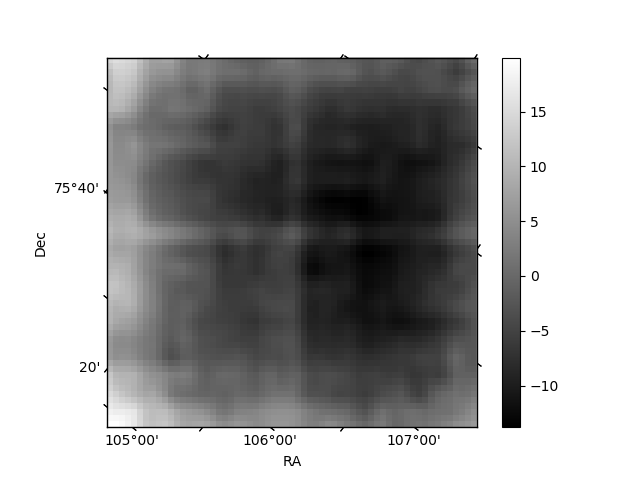
Quadrant B |
|---|---|---|---|
| Quadrant D | 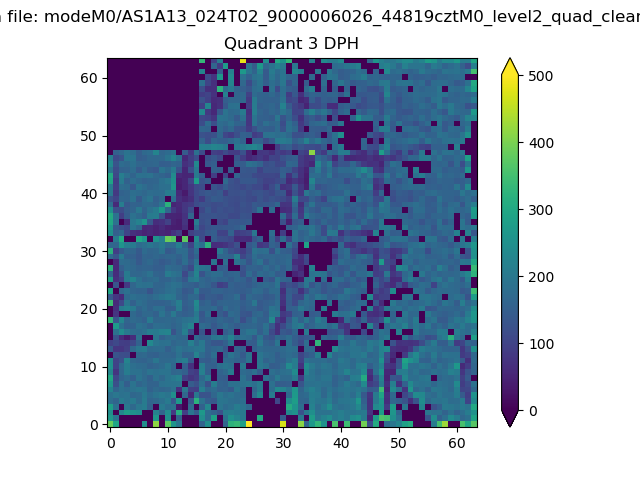 |
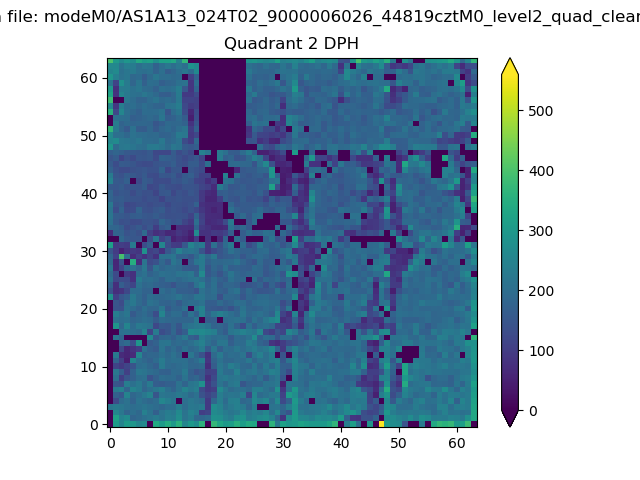 |
Quadrant C |
| Plot type | Count rate plots | Images |
|---|---|---|
| Comparison with Poisson distribution Blue bars denote a histogram of data divided into 1 sec bins. Red curve is a Poisson curve with rate = median count rate of data. |
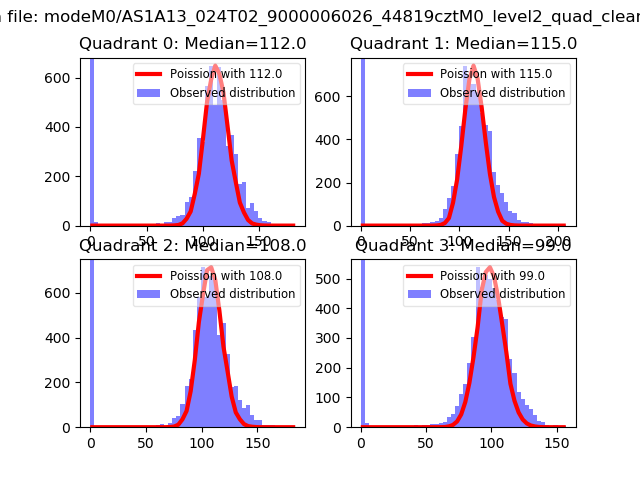 |
 |
| Quadrant-wise count rates Data is divided into 100 sec bins |
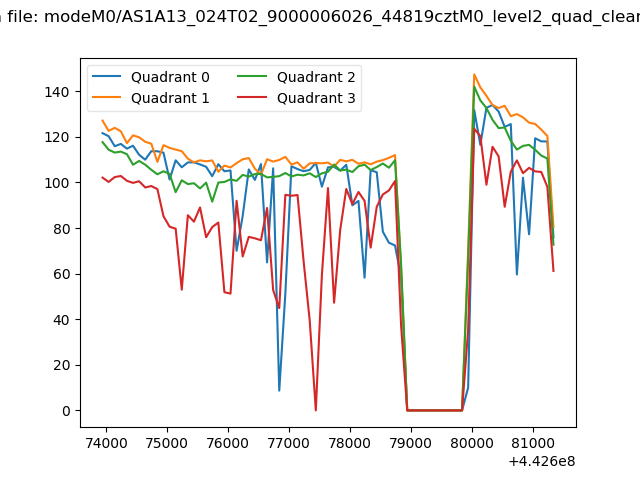 |
|
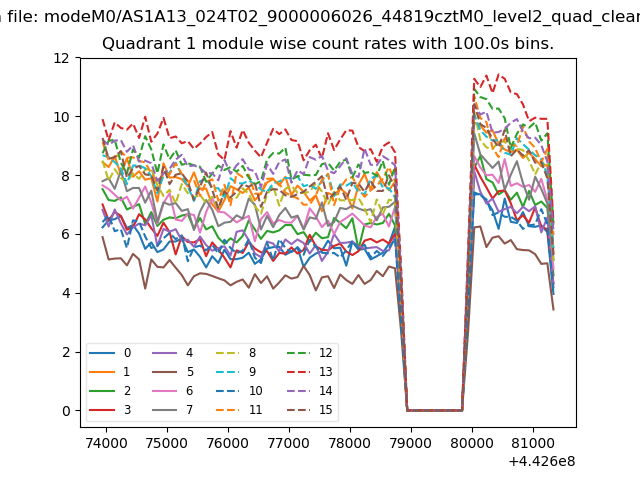
| Module-wise count rates for Quadrant A Data is divided into 100 sec bins |
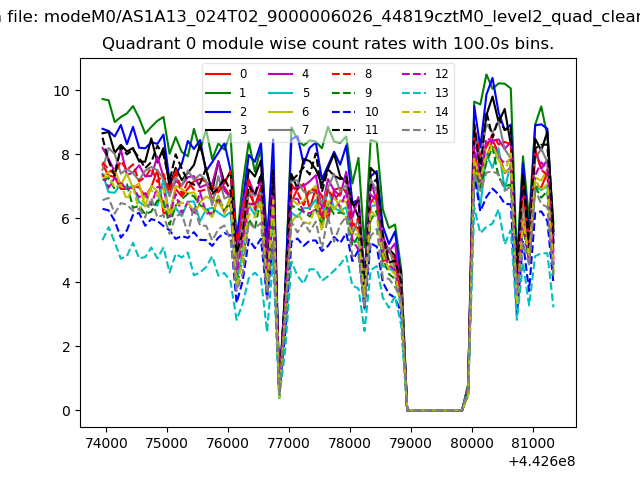 |
 |
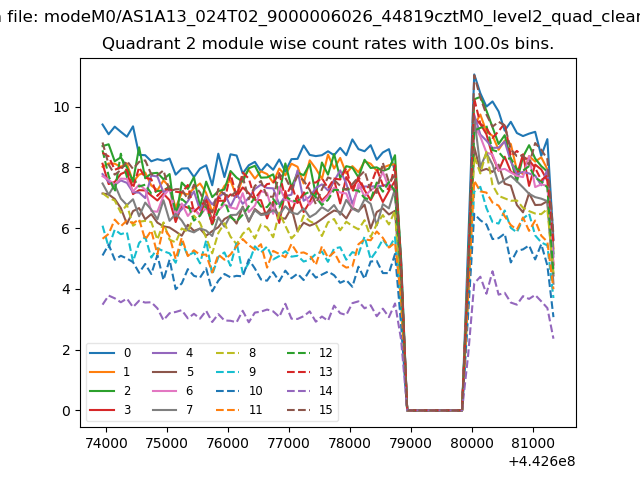
| Module-wise count rates for Quadrant B Data is divided into 100 sec bins |
 |
 |
| Module-wise count rates for Quadrant C Data is divided into 100 sec bins |
 |
 |
| Module-wise count rates for Quadrant D Data is divided into 100 sec bins |
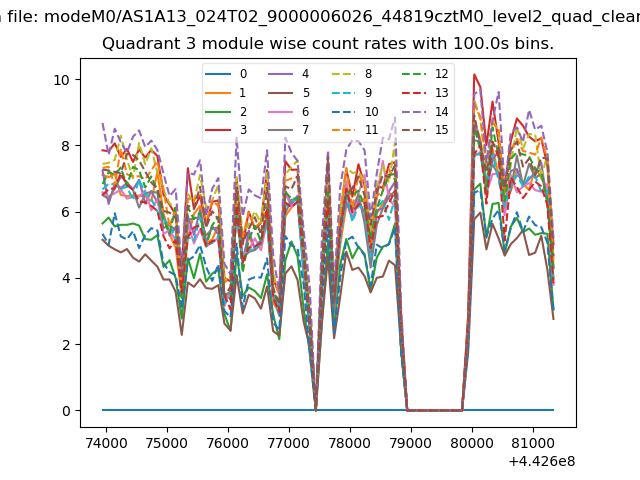 |
 |
| Parameter | Plot |
|---|---|
| CZT HV Monitor | 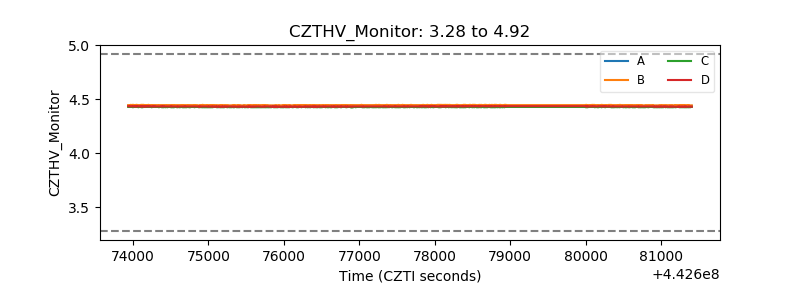 |
| D_VDD | 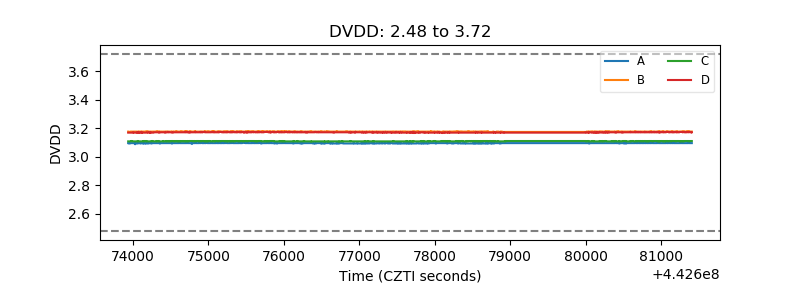 |
| Temperature 1 | 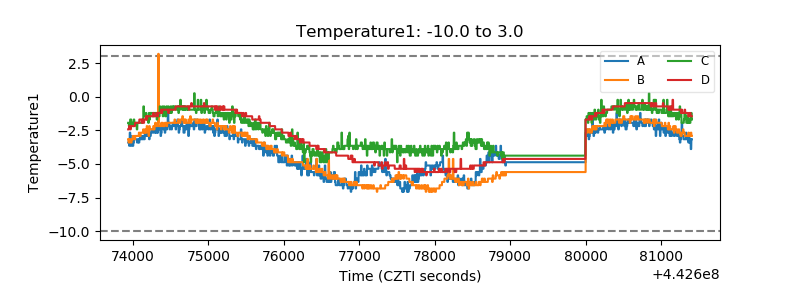 |
| Veto HV Monitor | 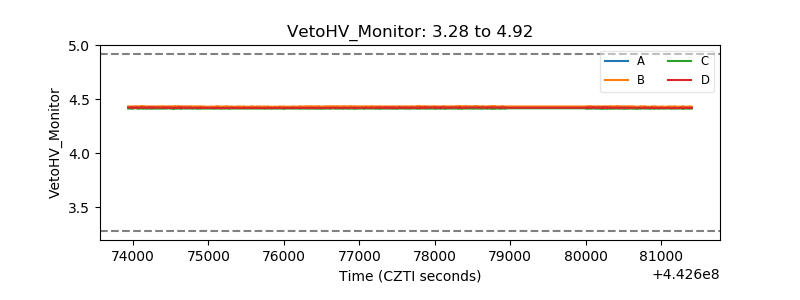 |
| Veto LLD | 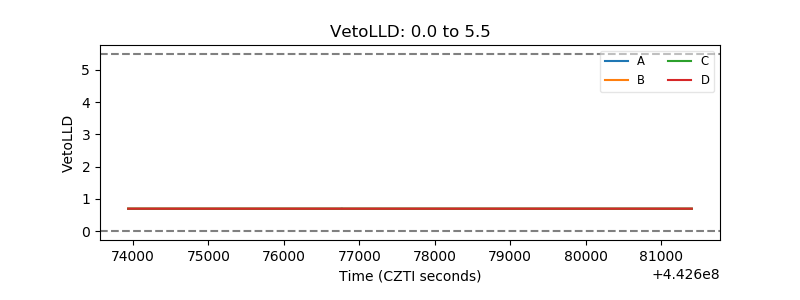 |
| Alpha Counter | 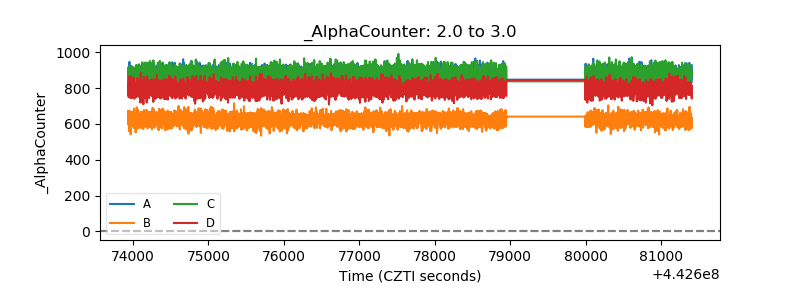 |
| _CPM_Rate | 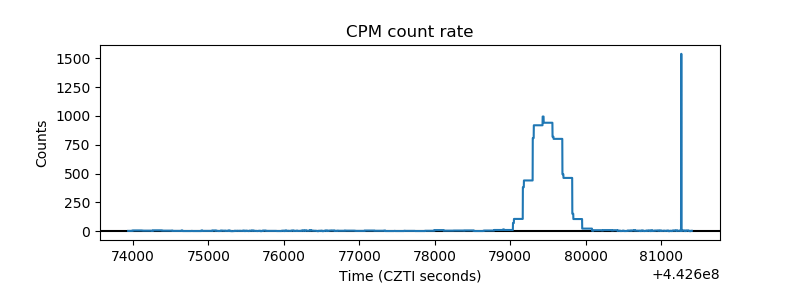 |
| CZT Counter | 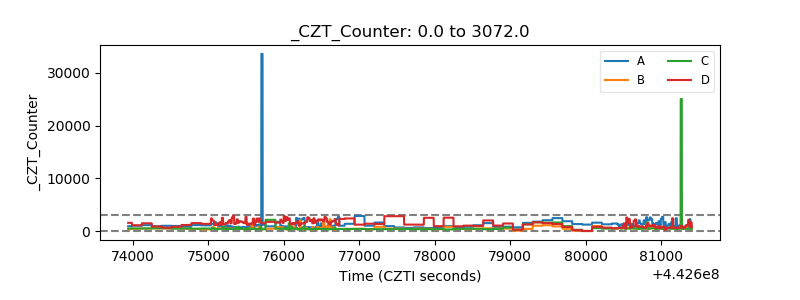 |
| +2.5 Volts monitor | 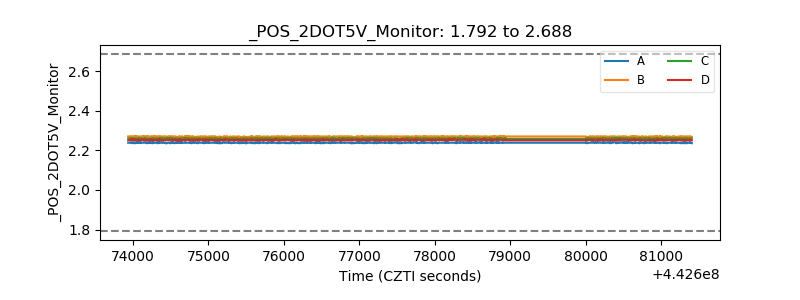 |
| +5 Volts monitor | 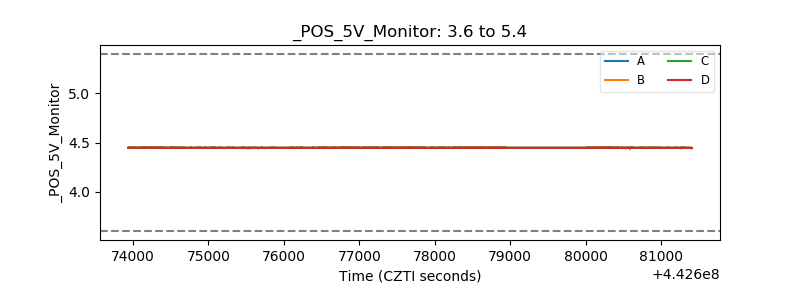 |
| _ROLL_ROT | 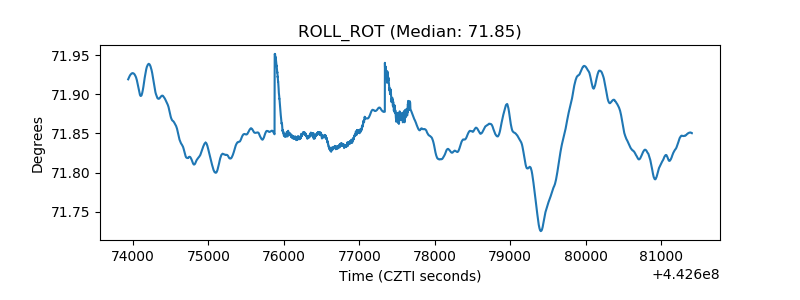 |
| _Roll_DEC | 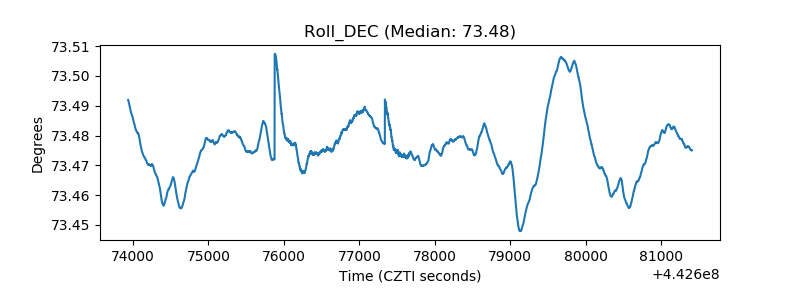 |
| _Roll_RA | 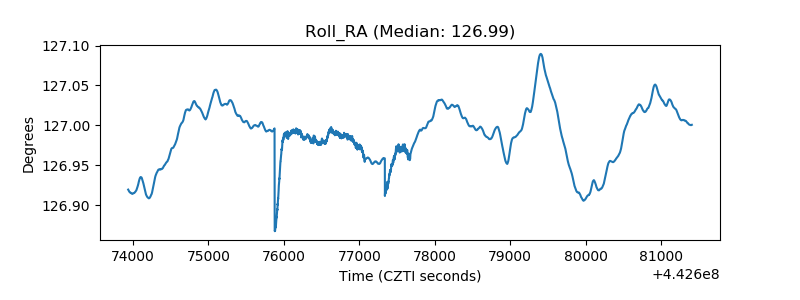 |
| Veto Counter | 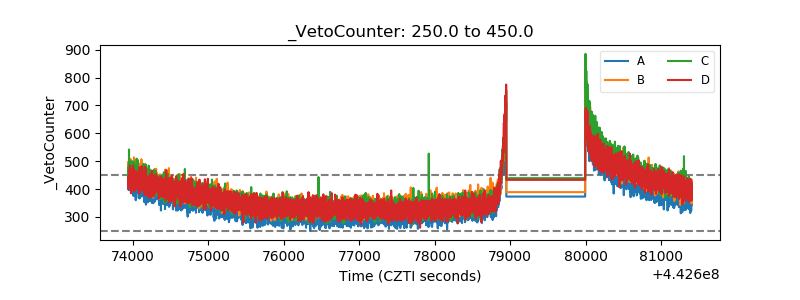 |