| Param | Original file | Final file |
|---|---|---|
| Filename | modeM0/AS1A13_024T02_9000006026_44820cztM0_level2.fits | modeM0/AS1A13_024T02_9000006026_44820cztM0_level2_quad_clean.evt |
| Size (bytes) | 604,517,760 | 99,797,760 |
| Size | 576.5 MB | 95.2 MB |
| Events in quadrant A | 7,704,115 | 600,909 |
| Events in quadrant B | 3,378,909 | 723,283 |
| Events in quadrant C | 2,819,676 | 687,451 |
| Events in quadrant D | 8,004,424 | 585,676 |
| Mode SS | |||
|---|---|---|---|
| Quadrant | BADHDUFLAG | Total packets | Discarded packets |
| A | 0 | 124 | 0 |
| B | 0 | 124 | 0 |
| C | 0 | 124 | 0 |
| D | 0 | 124 | 0 |
| Mode M0 | |||
|---|---|---|---|
| Quadrant | BADHDUFLAG | Total packets | Discarded packets |
| A | 0 | 27300 | 1 |
| B | 0 | 14284 | 1 |
| C | 0 | 12755 | 1 |
| D | 0 | 28142 | 1 |
| Mode M9 | |||
|---|---|---|---|
| Quadrant | BADHDUFLAG | Total packets | Discarded packets |
| A | 0 | 11 | 0 |
| B | 0 | 11 | 0 |
| C | 0 | 11 | 0 |
| D | 0 | 11 | 0 |
| Quadrant | Total seconds | Saturated seconds | Saturation percentage |
|---|---|---|---|
| A | 6076 | 1116 | 18.367347% |
| B | 6076 | 165 | 2.715602% |
| C | 6076 | 81 | 1.333114% |
| D | 6077 | 728 | 11.979595% |
Noise dominated data is calculated using 1-second bins in cleaned event files. If a bin has >2000 counts, and if more than 50% of those come from <1% of pixels, then it is considered to be noise-dominated and hence unusable.
| Quadrant | # 1 sec bins | Bins with >0 counts | Bins with >2000 counts | High rate bins dominated by noise | Noise dominated (total time) | Noise dominated (detector-on time) | Marked lightcurve |
|---|---|---|---|---|---|---|---|
| A | 7216 | 6077 | 913 | 913 | 12.65% | 15.02% | 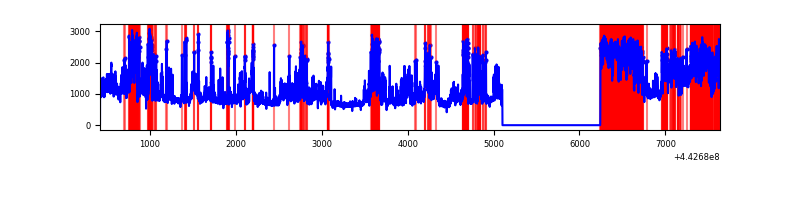 |
| B | 7216 | 6076 | 54 | 54 | 0.75% | 0.89% | 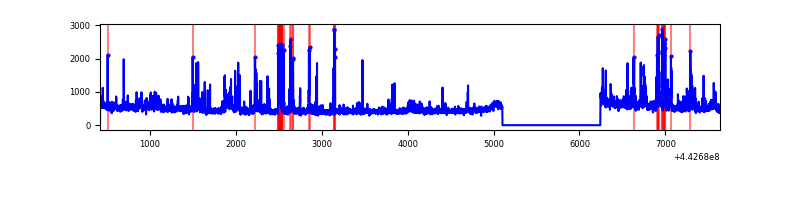 |
| C | 7216 | 6077 | 18 | 18 | 0.25% | 0.30% | 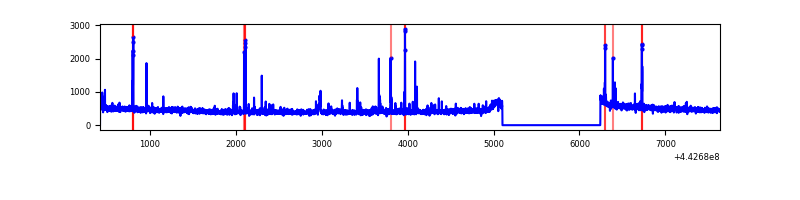 |
| D | 7217 | 6077 | 634 | 634 | 8.78% | 10.43% | 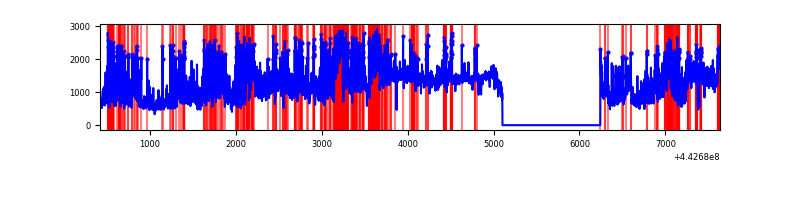 |
Top three noisy pixels from each quadrant. If the there are fewer than three noisy pixels in the level2.evt file, extra rows are filled as -1
| Pixel properties | Quadrant properties | ||||||
|---|---|---|---|---|---|---|---|
| Quadrant | DetID | PixID | Counts | Sigma | Mean | Median | Sigma |
| A | 15 | 223 | 3356098 | 25439.82 | 640 | 627 | 131.9 |
| A | 10 | 83 | 1806851 | 13694.06 | 640 | 627 | 131.9 |
| A | 13 | 248 | 48940 | 366.29 | 640 | 627 | 131.9 |
| B | 0 | 189 | 192157 | 1417.35 | 690 | 669 | 135.1 |
| B | 5 | 255 | 92464 | 679.45 | 690 | 669 | 135.1 |
| B | 15 | 36 | 88694 | 651.54 | 690 | 669 | 135.1 |
| C | 12 | 2 | 44817 | 279.2 | 682 | 685 | 158.1 |
| C | 1 | 3 | 43768 | 272.56 | 682 | 685 | 158.1 |
| C | 14 | 254 | 33685 | 208.77 | 682 | 685 | 158.1 |
| D | 13 | 187 | 2475017 | 15187.56 | 652 | 633 | 162.9 |
| D | 2 | 249 | 939186 | 5760.76 | 652 | 633 | 162.9 |
| D | 1 | 52 | 889643 | 5456.67 | 652 | 633 | 162.9 |
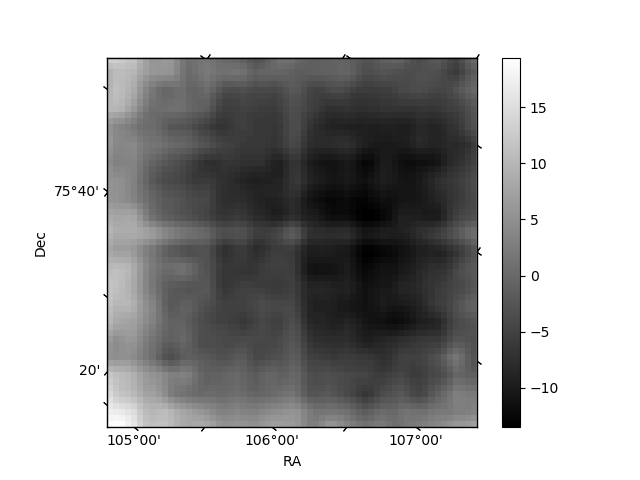
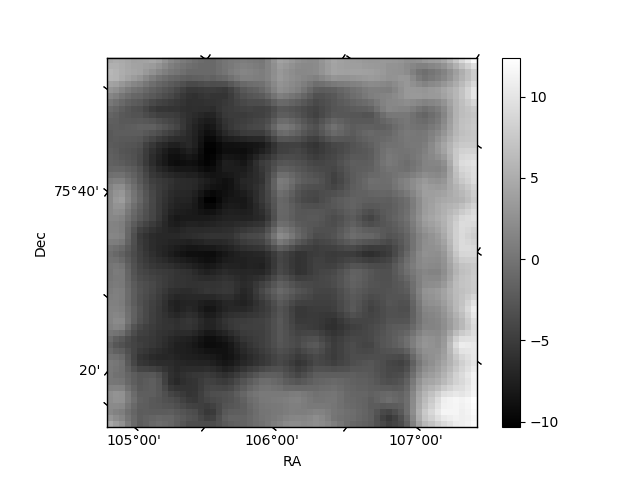
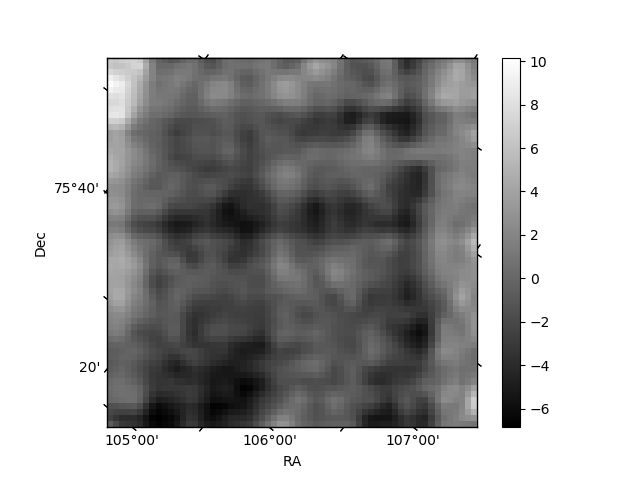
Histogram calculated using DETX and DETY for each event in the final _common_clean file
| Quadrant A | 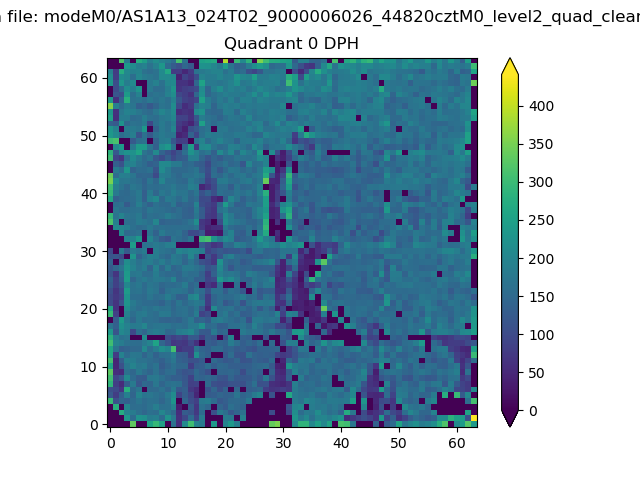 |
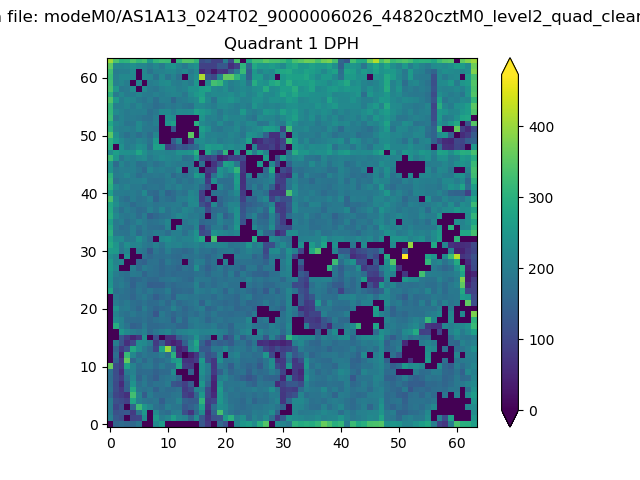 |
Quadrant B |
|---|---|---|---|
| Quadrant D | 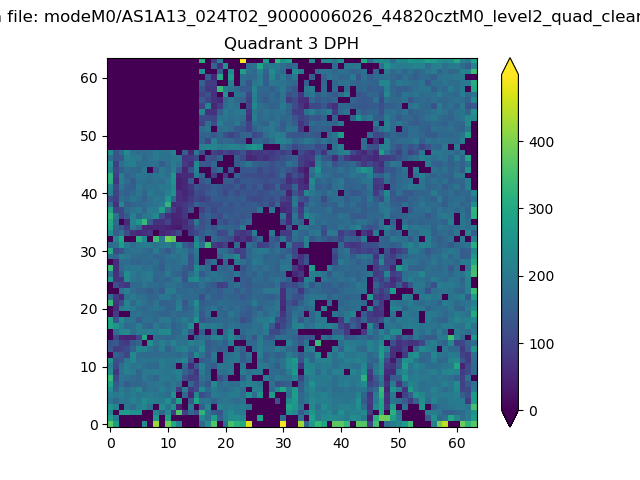 |
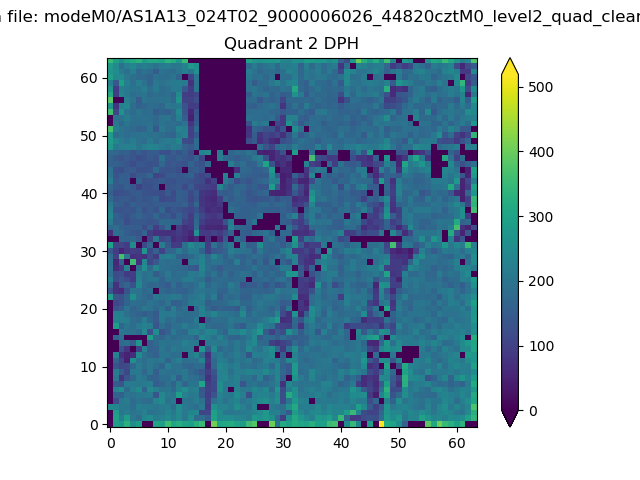 |
Quadrant C |
| Plot type | Count rate plots | Images |
|---|---|---|
| Comparison with Poisson distribution Blue bars denote a histogram of data divided into 1 sec bins. Red curve is a Poisson curve with rate = median count rate of data. |
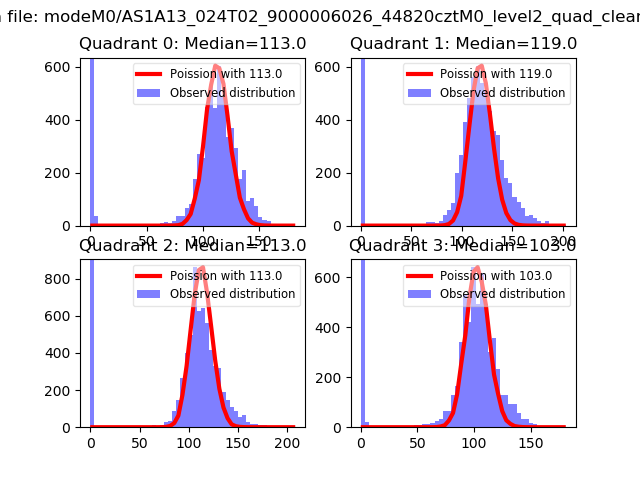 |
 |
| Quadrant-wise count rates Data is divided into 100 sec bins |
 |
|
| Module-wise count rates for Quadrant A Data is divided into 100 sec bins |
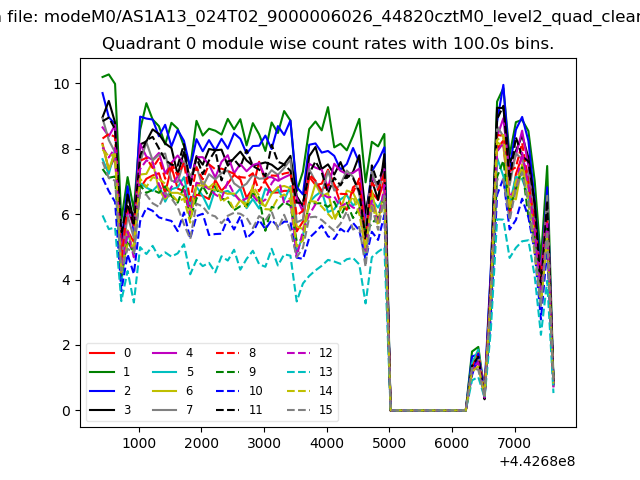 |
 |
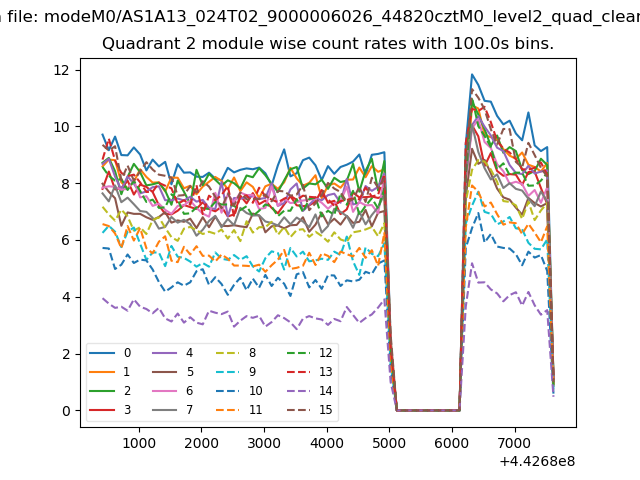
| Module-wise count rates for Quadrant B Data is divided into 100 sec bins |
 |
 |
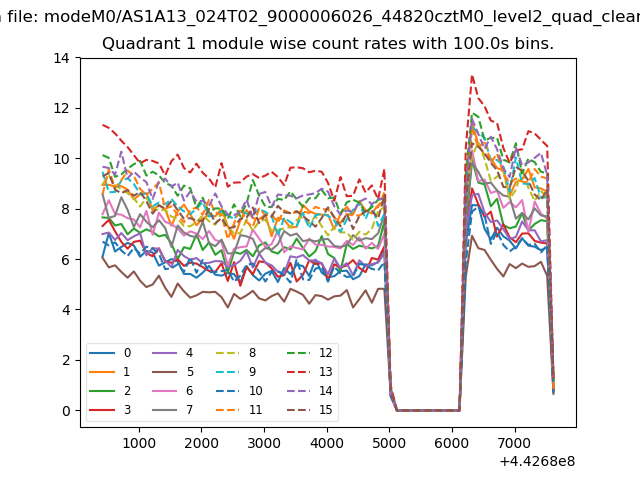
| Module-wise count rates for Quadrant C Data is divided into 100 sec bins |
 |
 |
| Module-wise count rates for Quadrant D Data is divided into 100 sec bins |
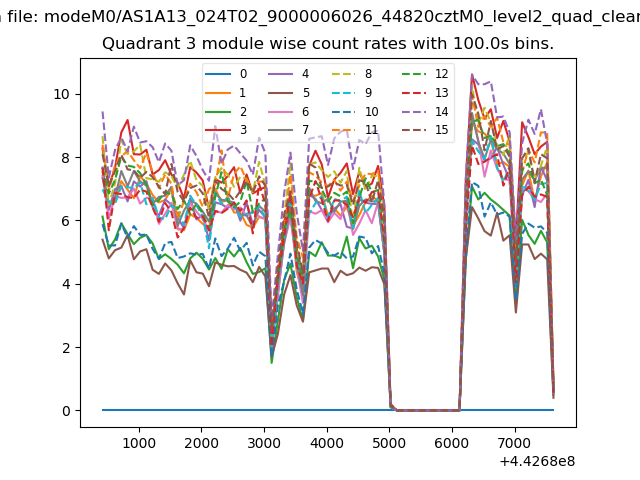 |
 |
| Parameter | Plot |
|---|---|
| CZT HV Monitor | 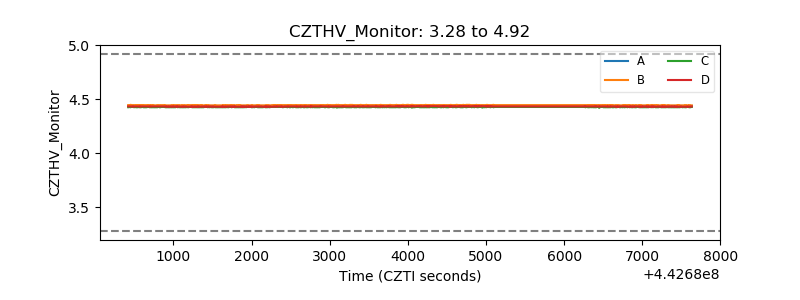 |
| D_VDD | 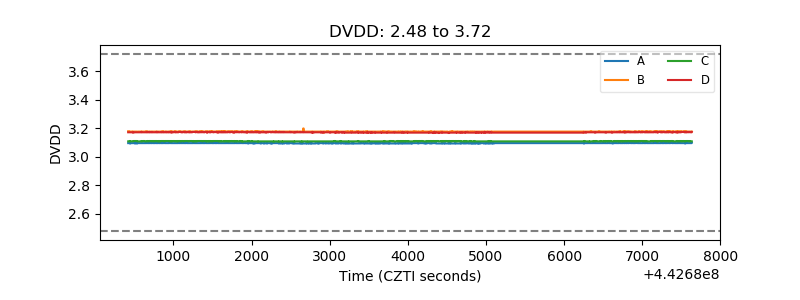 |
| Temperature 1 | 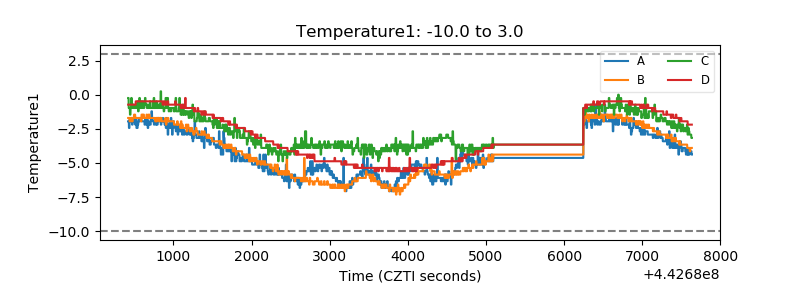 |
| Veto HV Monitor | 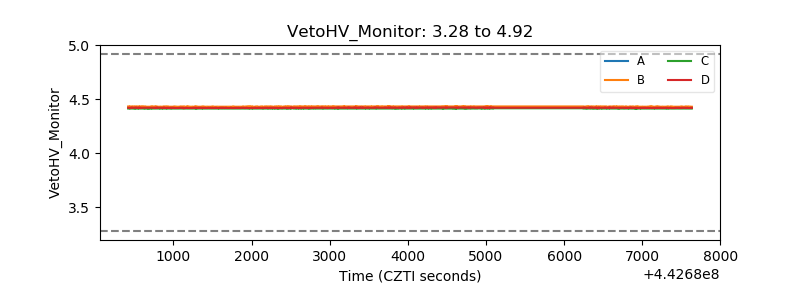 |
| Veto LLD | 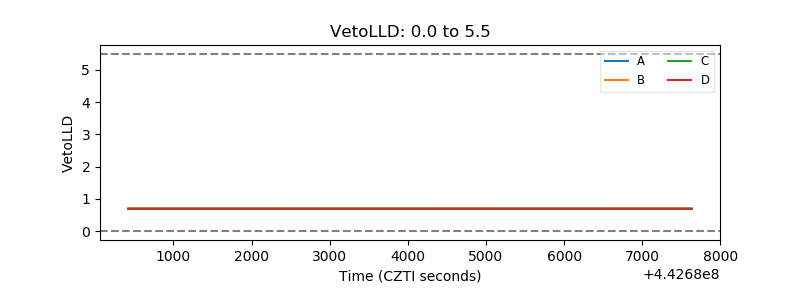 |
| Alpha Counter | 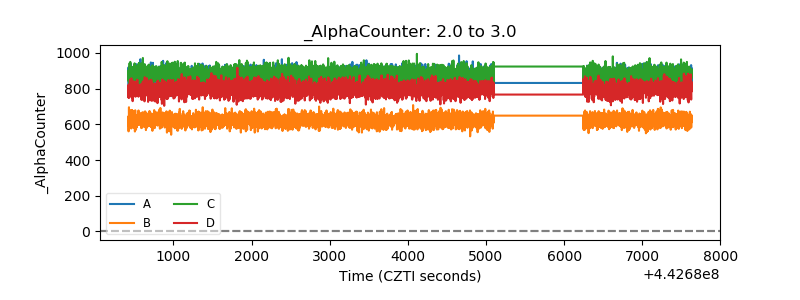 |
| _CPM_Rate | 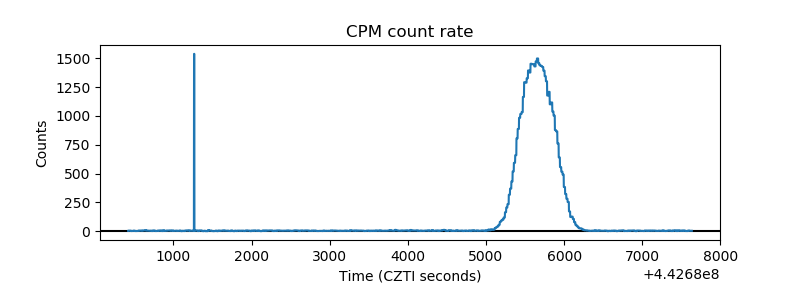 |
| CZT Counter | 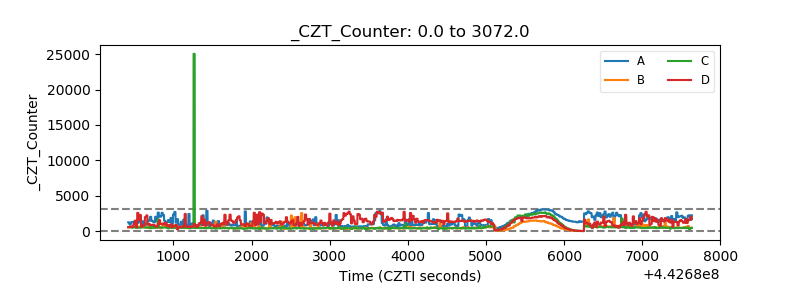 |
| +2.5 Volts monitor | 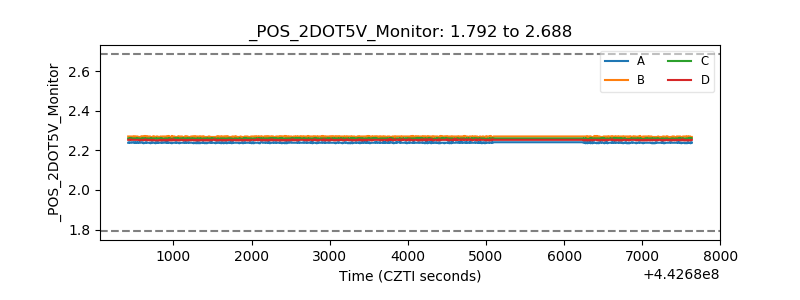 |
| +5 Volts monitor | 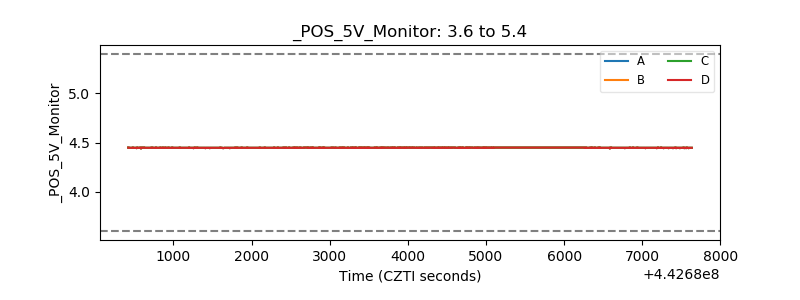 |
| _ROLL_ROT | 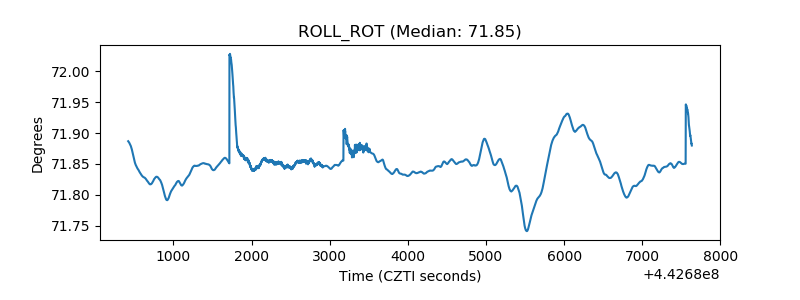 |
| _Roll_DEC | 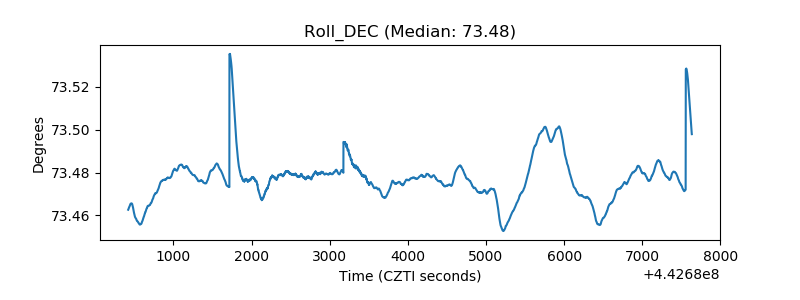 |
| _Roll_RA | 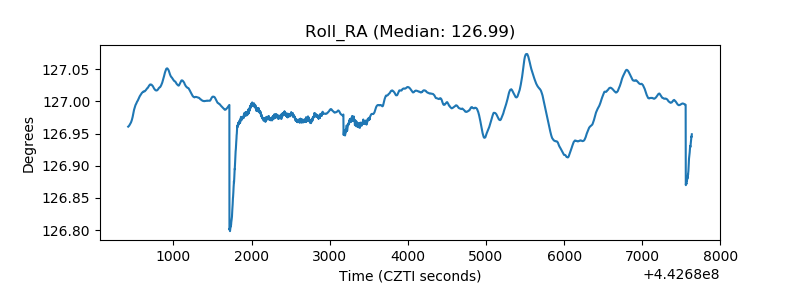 |
| Veto Counter | 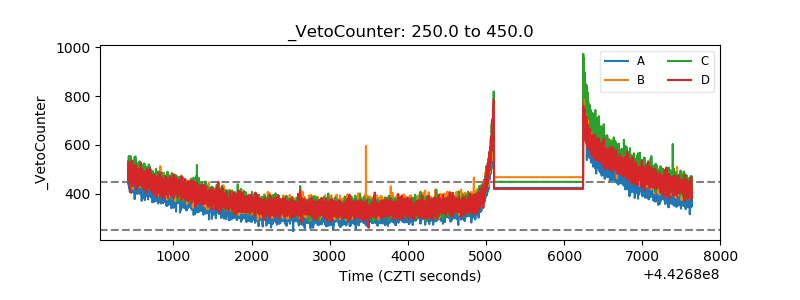 |