| Param | Original file | Final file |
|---|---|---|
| Filename | modeM0/AS1A13_024T02_9000006026_44821cztM0_level2.fits | modeM0/AS1A13_024T02_9000006026_44821cztM0_level2_quad_clean.evt |
| Size (bytes) | 267,788,160 | 40,415,040 |
| Size | 255.4 MB | 38.5 MB |
| Events in quadrant A | 3,787,319 | 219,479 |
| Events in quadrant B | 1,413,172 | 304,022 |
| Events in quadrant C | 1,139,851 | 287,190 |
| Events in quadrant D | 3,389,622 | 244,986 |
| Mode SS | |||
|---|---|---|---|
| Quadrant | BADHDUFLAG | Total packets | Discarded packets |
| A | 0 | 46 | 0 |
| B | 0 | 46 | 0 |
| C | 0 | 46 | 0 |
| D | 0 | 46 | 0 |
| Mode M0 | |||
|---|---|---|---|
| Quadrant | BADHDUFLAG | Total packets | Discarded packets |
| A | 0 | 12898 | 0 |
| B | 0 | 5819 | 0 |
| C | 0 | 4941 | 0 |
| D | 0 | 11722 | 0 |
| Quadrant | Total seconds | Saturated seconds | Saturation percentage |
|---|---|---|---|
| A | 2336 | 701 | 30.008562% |
| B | 2337 | 46 | 1.968335% |
| C | 2337 | 8 | 0.342319% |
| D | 2337 | 312 | 13.350449% |
Noise dominated data is calculated using 1-second bins in cleaned event files. If a bin has >2000 counts, and if more than 50% of those come from <1% of pixels, then it is considered to be noise-dominated and hence unusable.
| Quadrant | # 1 sec bins | Bins with >0 counts | Bins with >2000 counts | High rate bins dominated by noise | Noise dominated (total time) | Noise dominated (detector-on time) | Marked lightcurve |
|---|---|---|---|---|---|---|---|
| A | 2336 | 2336 | 648 | 648 | 27.74% | 27.74% | 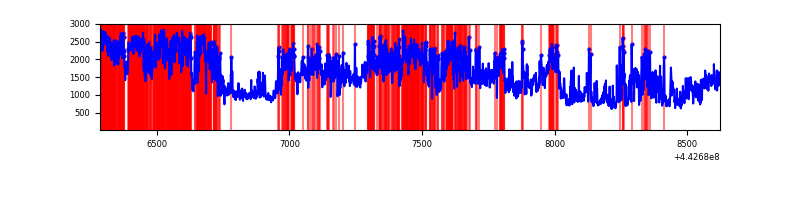 |
| B | 2337 | 2337 | 28 | 28 | 1.20% | 1.20% | 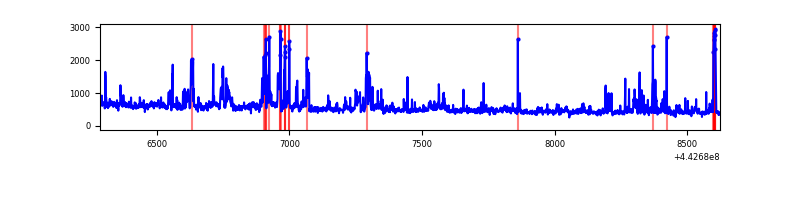 |
| C | 2337 | 2337 | 9 | 9 | 0.39% | 0.39% | 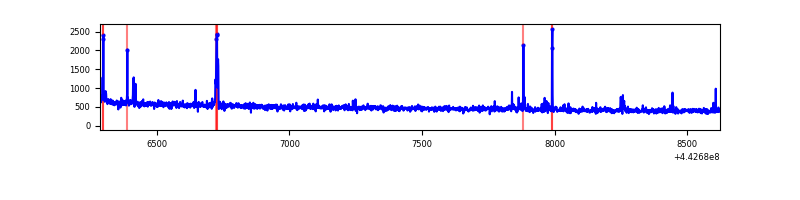 |
| D | 2337 | 2337 | 359 | 359 | 15.36% | 15.36% | 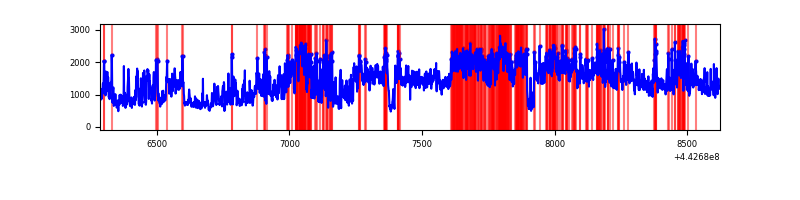 |
Top three noisy pixels from each quadrant. If the there are fewer than three noisy pixels in the level2.evt file, extra rows are filled as -1
| Pixel properties | Quadrant properties | ||||||
|---|---|---|---|---|---|---|---|
| Quadrant | DetID | PixID | Counts | Sigma | Mean | Median | Sigma |
| A | 15 | 223 | 2031884 | 38921.45 | 247 | 242 | 52.2 |
| A | 10 | 83 | 762086 | 14595.13 | 247 | 242 | 52.2 |
| A | 13 | 248 | 20197 | 382.29 | 247 | 242 | 52.2 |
| B | 15 | 36 | 85741 | 1566.49 | 276 | 268 | 54.6 |
| B | 5 | 255 | 56371 | 1028.22 | 276 | 268 | 54.6 |
| B | 4 | 171 | 52572 | 958.59 | 276 | 268 | 54.6 |
| C | 12 | 2 | 21561 | 328.17 | 277 | 279 | 64.9 |
| C | 1 | 3 | 17037 | 258.41 | 277 | 279 | 64.9 |
| C | 12 | 250 | 8854 | 132.23 | 277 | 279 | 64.9 |
| D | 13 | 187 | 1227335 | 18238.44 | 268 | 260 | 67.3 |
| D | 13 | 174 | 322547 | 4790.26 | 268 | 260 | 67.3 |
| D | 2 | 249 | 282913 | 4201.17 | 268 | 260 | 67.3 |
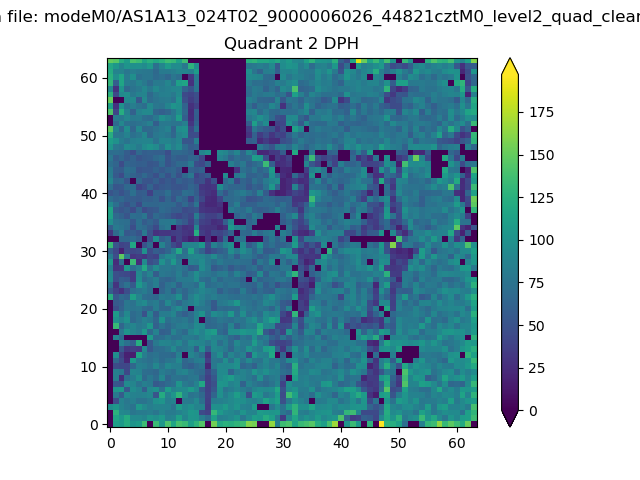
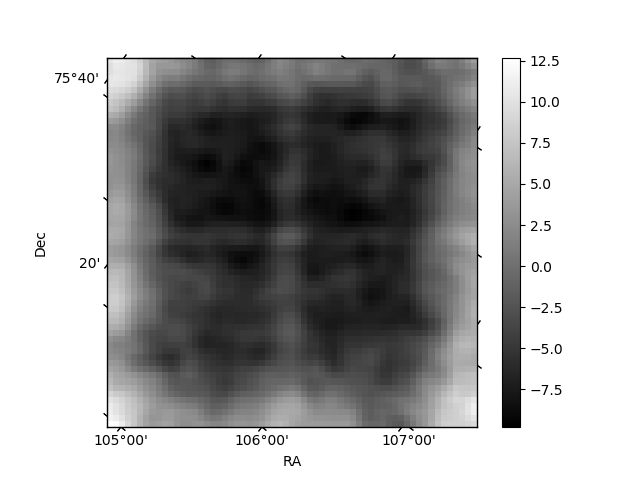
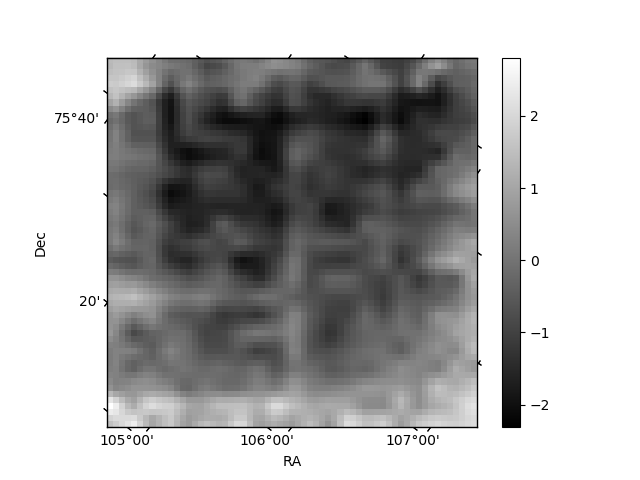
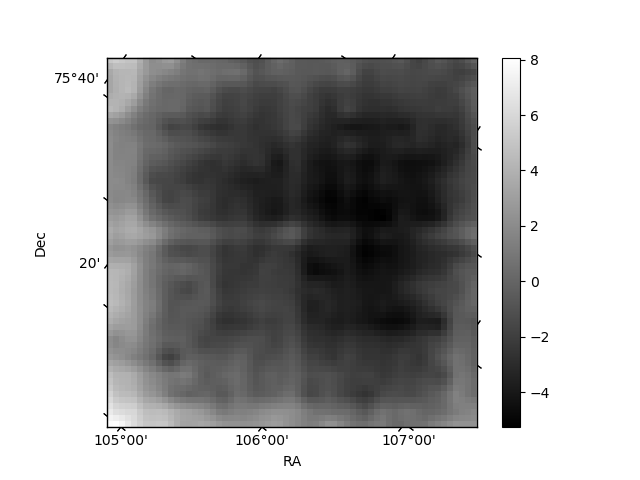
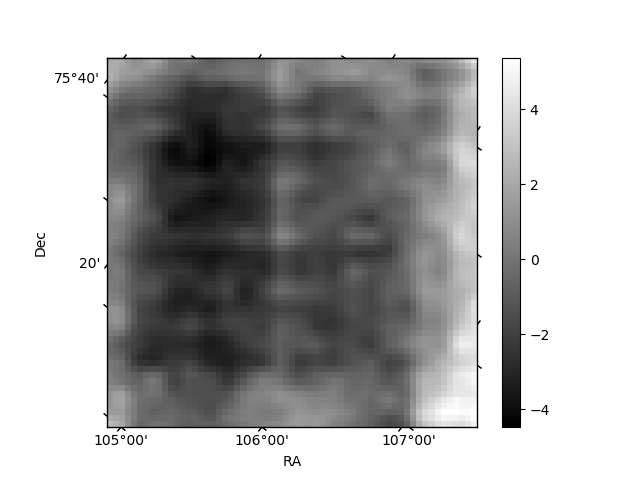
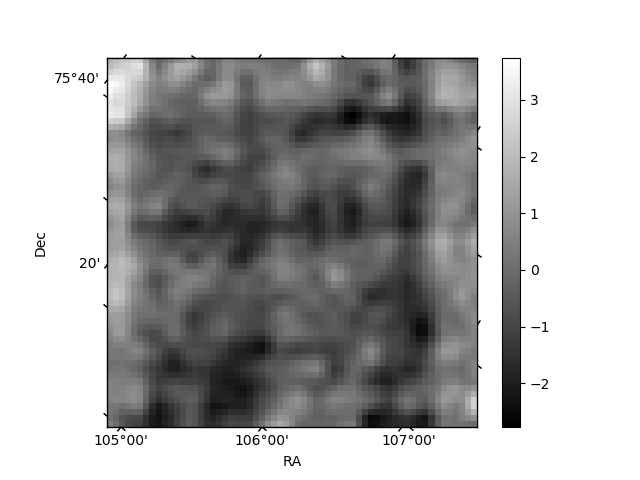
Histogram calculated using DETX and DETY for each event in the final _common_clean file
| Quadrant A | 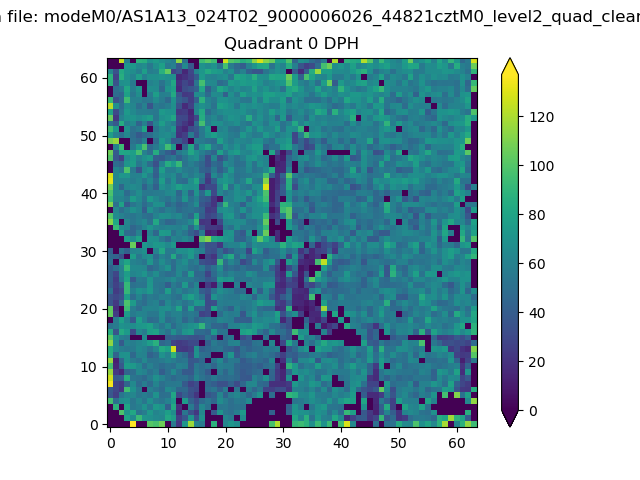 |
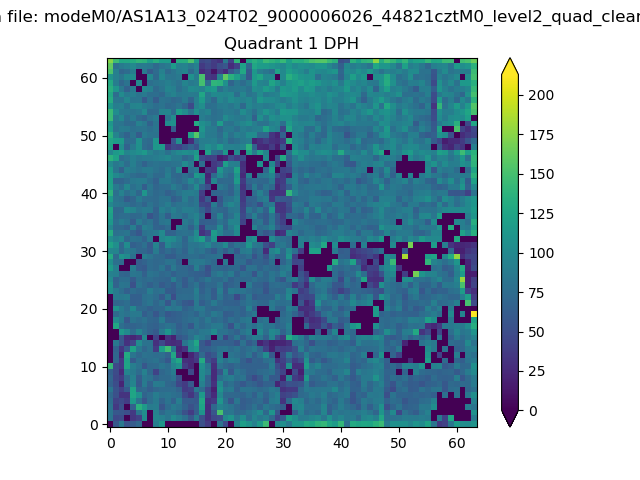 |
Quadrant B |
|---|---|---|---|
| Quadrant D | 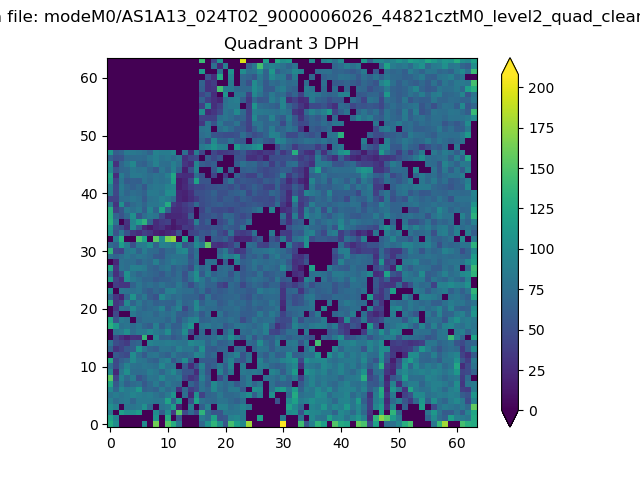 |
 |
Quadrant C |
| Plot type | Count rate plots | Images |
|---|---|---|
| Comparison with Poisson distribution Blue bars denote a histogram of data divided into 1 sec bins. Red curve is a Poisson curve with rate = median count rate of data. |
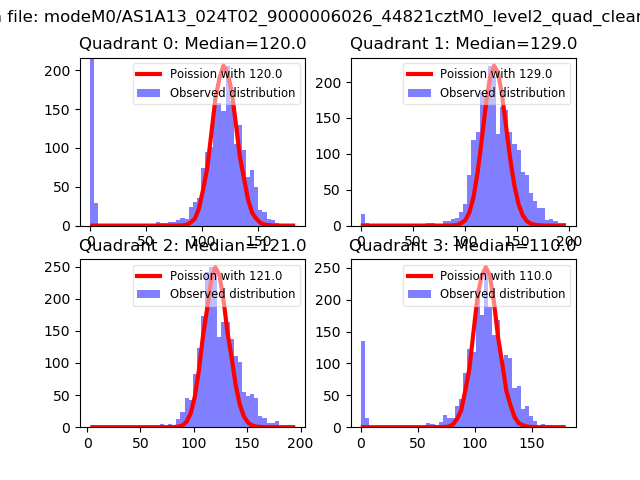 |
 |
| Quadrant-wise count rates Data is divided into 100 sec bins |
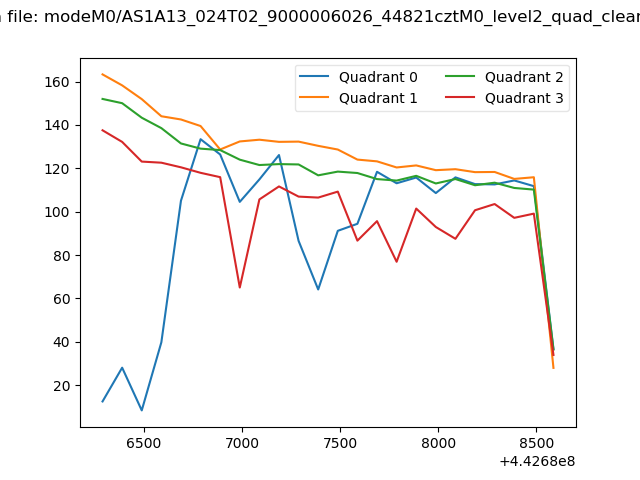 |
|
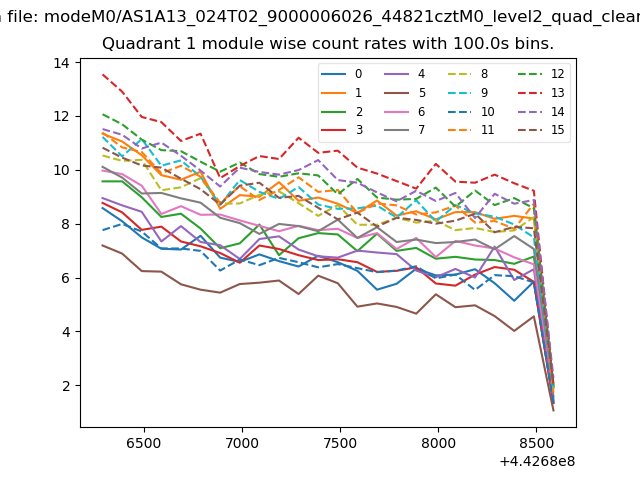
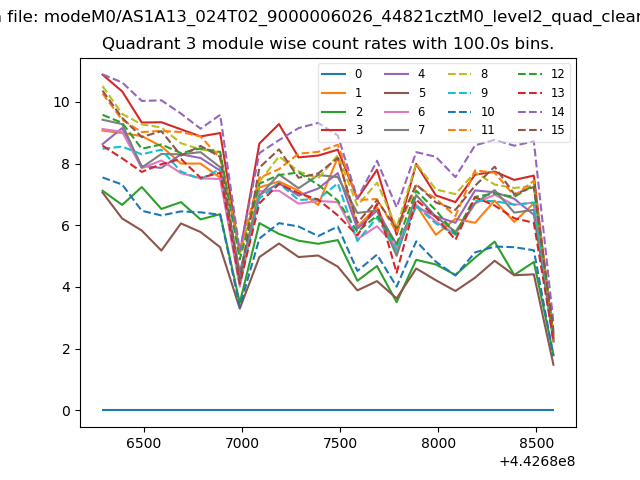
| Module-wise count rates for Quadrant A Data is divided into 100 sec bins |
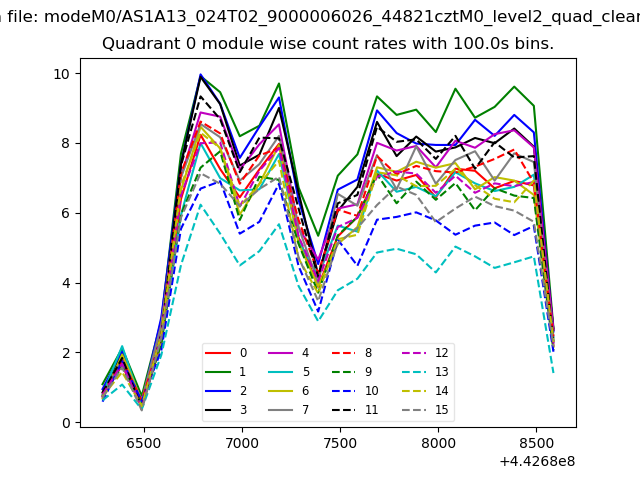 |
 |
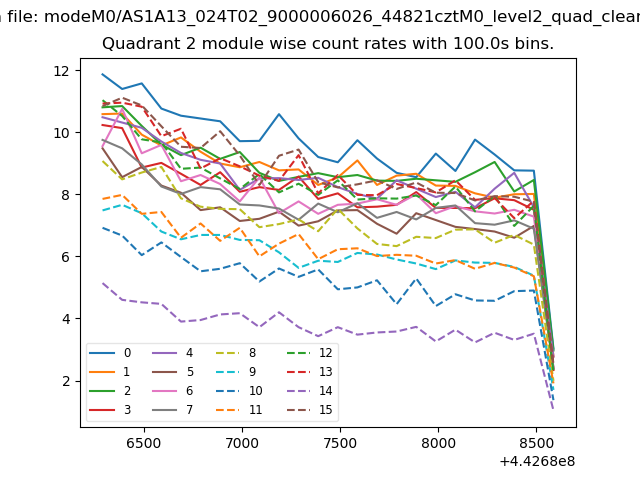
| Module-wise count rates for Quadrant B Data is divided into 100 sec bins |
 |
 |
| Module-wise count rates for Quadrant C Data is divided into 100 sec bins |
 |
 |
| Module-wise count rates for Quadrant D Data is divided into 100 sec bins |
 |
 |
| Parameter | Plot |
|---|---|
| CZT HV Monitor | 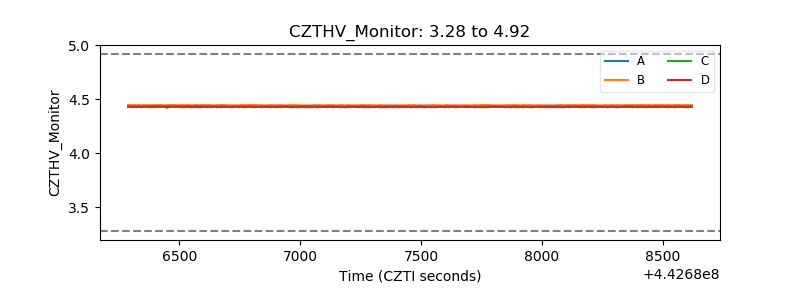 |
| D_VDD | 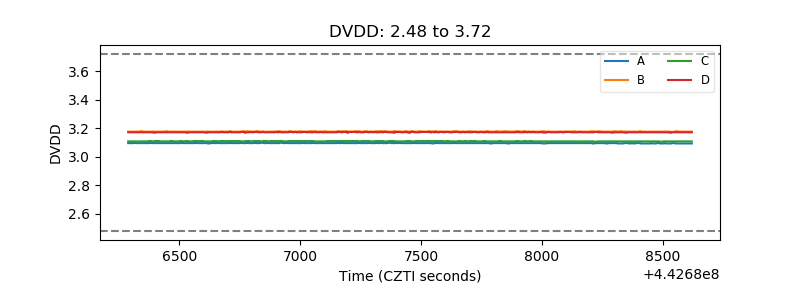 |
| Temperature 1 | 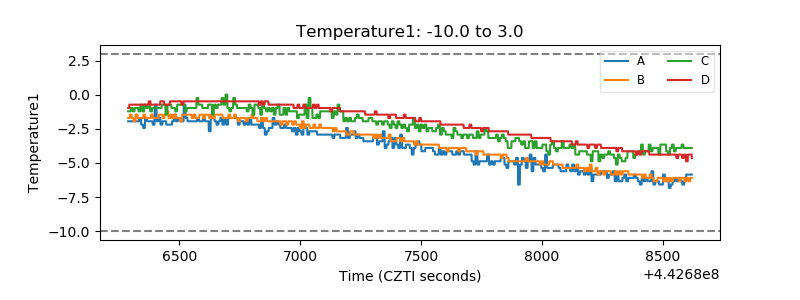 |
| Veto HV Monitor | 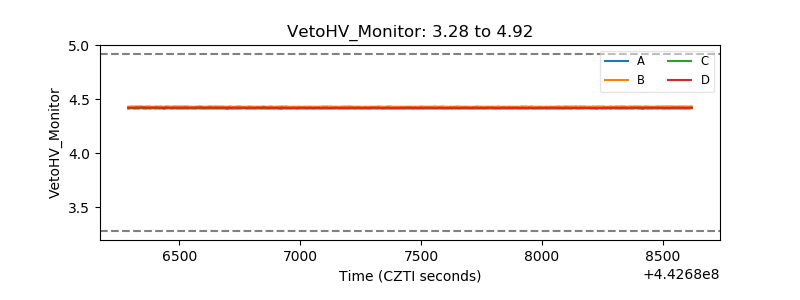 |
| Veto LLD | 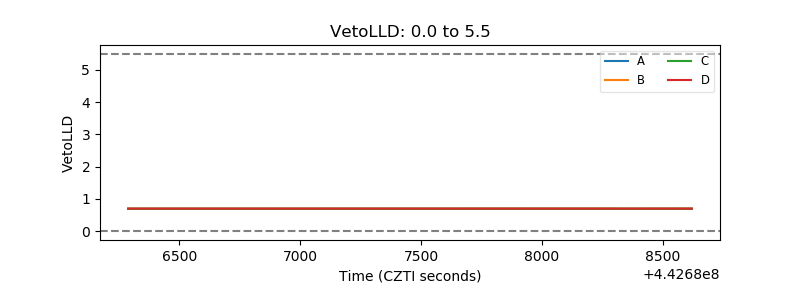 |
| Alpha Counter | 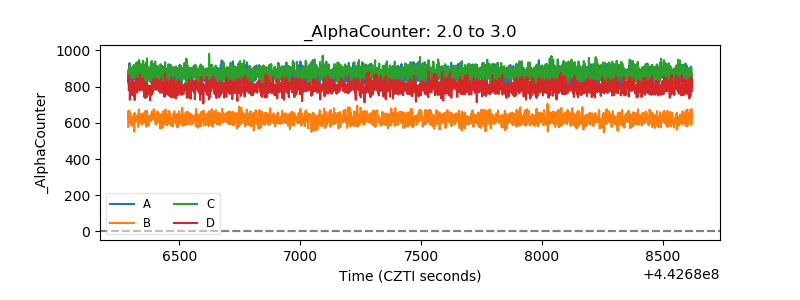 |
| _CPM_Rate | 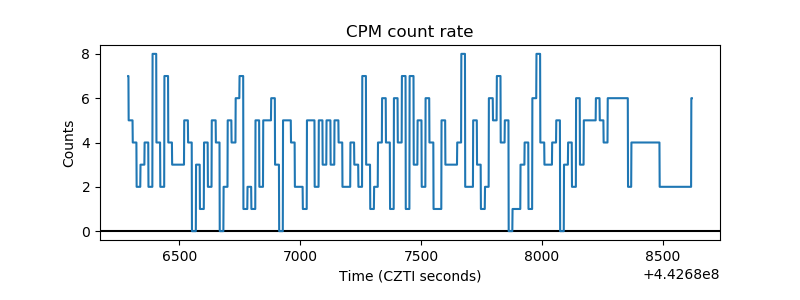 |
| CZT Counter | 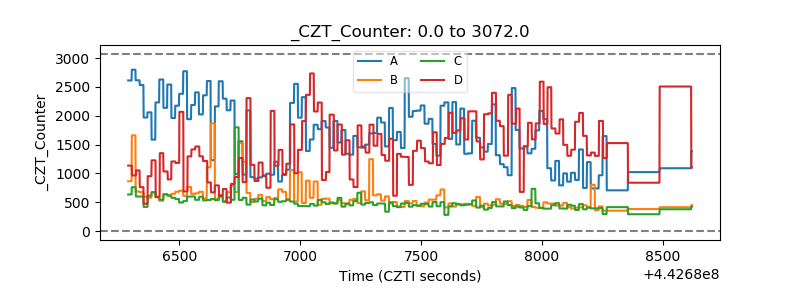 |
| +2.5 Volts monitor | 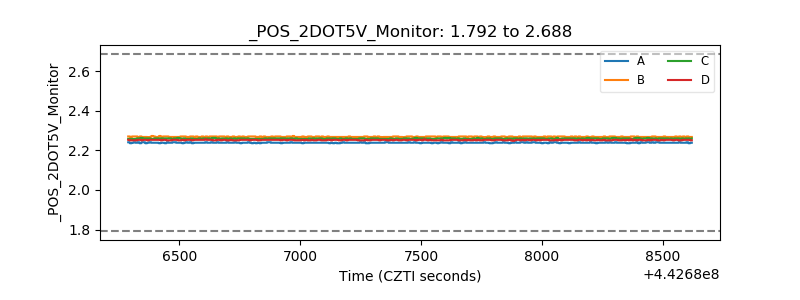 |
| +5 Volts monitor | 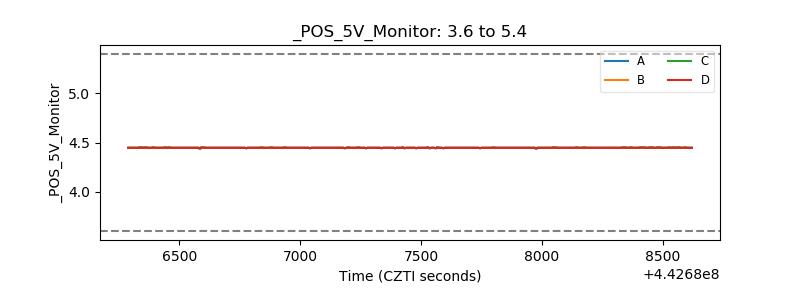 |
| _ROLL_ROT | 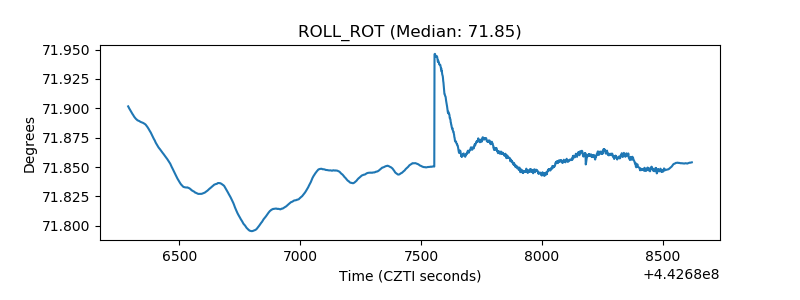 |
| _Roll_DEC | 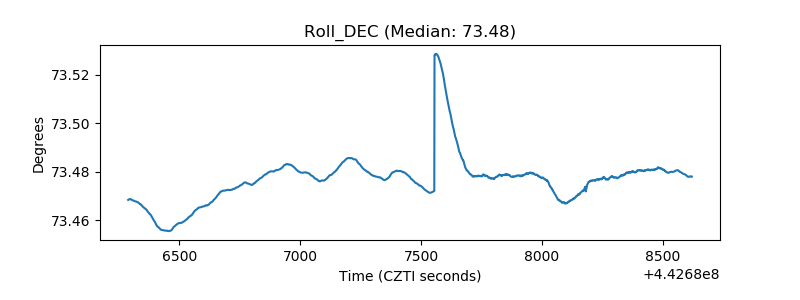 |
| _Roll_RA | 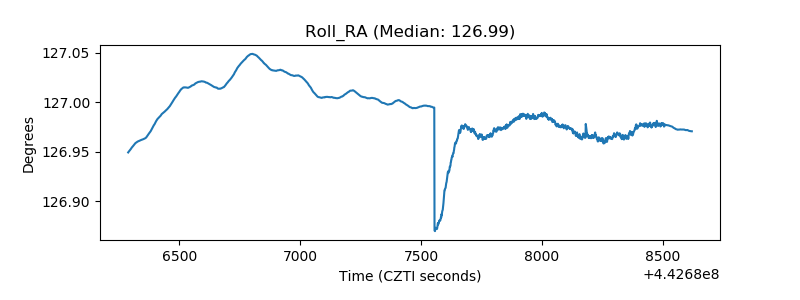 |
| Veto Counter | 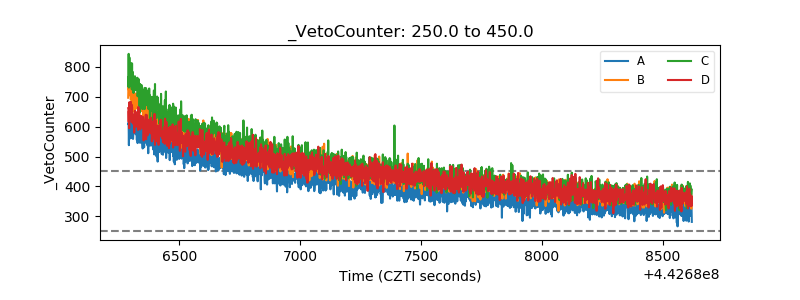 |