| Param | Original file | Final file |
|---|---|---|
| Filename | modeM0/AS1A13_017T02_9000006032_44880cztM0_level2.fits | modeM0/AS1A13_017T02_9000006032_44880cztM0_level2_quad_clean.evt |
| Size (bytes) | 235,716,480 | 56,260,800 |
| Size | 224.8 MB | 53.7 MB |
| Events in quadrant A | 2,697,422 | 374,859 |
| Events in quadrant B | 1,704,358 | 394,680 |
| Events in quadrant C | 1,654,425 | 380,864 |
| Events in quadrant D | 2,427,022 | 332,655 |
| Mode SS | |||
|---|---|---|---|
| Quadrant | BADHDUFLAG | Total packets | Discarded packets |
| A | 0 | 66 | 0 |
| B | 0 | 66 | 0 |
| C | 0 | 66 | 0 |
| D | 0 | 66 | 0 |
| Mode M0 | |||
|---|---|---|---|
| Quadrant | BADHDUFLAG | Total packets | Discarded packets |
| A | 0 | 10255 | 1 |
| B | 0 | 7074 | 1 |
| C | 0 | 6854 | 1 |
| D | 0 | 9292 | 1 |
| Mode M9 | |||
|---|---|---|---|
| Quadrant | BADHDUFLAG | Total packets | Discarded packets |
| A | 0 | 12 | 0 |
| B | 0 | 12 | 0 |
| C | 0 | 12 | 0 |
| D | 0 | 12 | 0 |
| Quadrant | Total seconds | Saturated seconds | Saturation percentage |
|---|---|---|---|
| A | 3094 | 176 | 5.688429% |
| B | 3094 | 106 | 3.425986% |
| C | 3094 | 82 | 2.650291% |
| D | 3094 | 234 | 7.563025% |
Noise dominated data is calculated using 1-second bins in cleaned event files. If a bin has >2000 counts, and if more than 50% of those come from <1% of pixels, then it is considered to be noise-dominated and hence unusable.
| Quadrant | # 1 sec bins | Bins with >0 counts | Bins with >2000 counts | High rate bins dominated by noise | Noise dominated (total time) | Noise dominated (detector-on time) | Marked lightcurve |
|---|---|---|---|---|---|---|---|
| A | 4329 | 3095 | 13 | 13 | 0.30% | 0.42% | 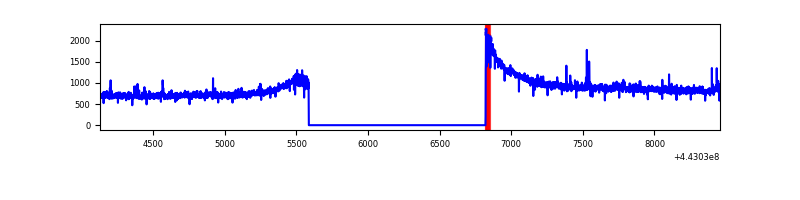 |
| B | 4329 | 3095 | 2 | 2 | 0.05% | 0.06% | 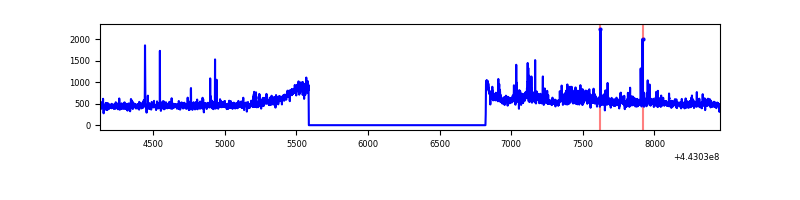 |
| C | 4329 | 3095 | 2 | 2 | 0.05% | 0.06% | 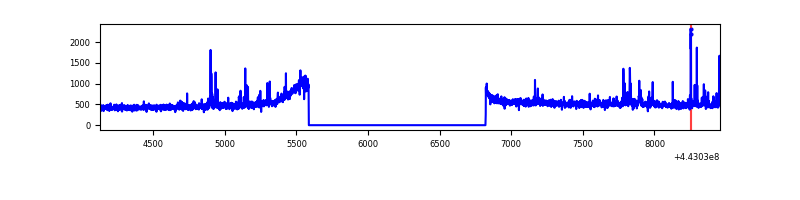 |
| D | 4329 | 3095 | 131 | 131 | 3.03% | 4.23% | 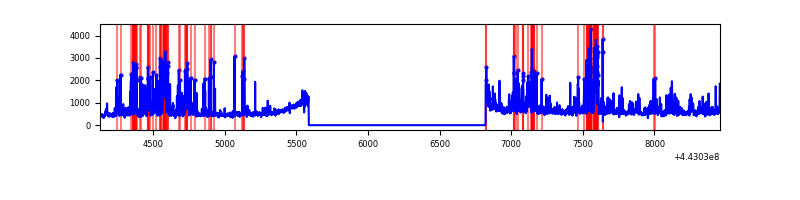 |
Top three noisy pixels from each quadrant. If the there are fewer than three noisy pixels in the level2.evt file, extra rows are filled as -1
| Pixel properties | Quadrant properties | ||||||
|---|---|---|---|---|---|---|---|
| Quadrant | DetID | PixID | Counts | Sigma | Mean | Median | Sigma |
| A | 10 | 83 | 1125934 | 13208.76 | 399 | 390 | 85.2 |
| A | 13 | 248 | 21309 | 245.49 | 399 | 390 | 85.2 |
| A | 7 | 3 | 5730 | 62.67 | 399 | 390 | 85.2 |
| B | 0 | 155 | 45685 | 567.56 | 400 | 389 | 79.8 |
| B | 5 | 255 | 31725 | 392.64 | 400 | 389 | 79.8 |
| B | 0 | 190 | 12785 | 155.32 | 400 | 389 | 79.8 |
| C | 12 | 250 | 37444 | 392.04 | 399 | 402 | 94.5 |
| C | 1 | 3 | 35126 | 367.5 | 399 | 402 | 94.5 |
| C | 3 | 233 | 12599 | 129.09 | 399 | 402 | 94.5 |
| D | 1 | 52 | 382847 | 3907.26 | 391 | 379 | 97.9 |
| D | 13 | 249 | 280151 | 2858.13 | 391 | 379 | 97.9 |
| D | 2 | 249 | 190099 | 1938.16 | 391 | 379 | 97.9 |
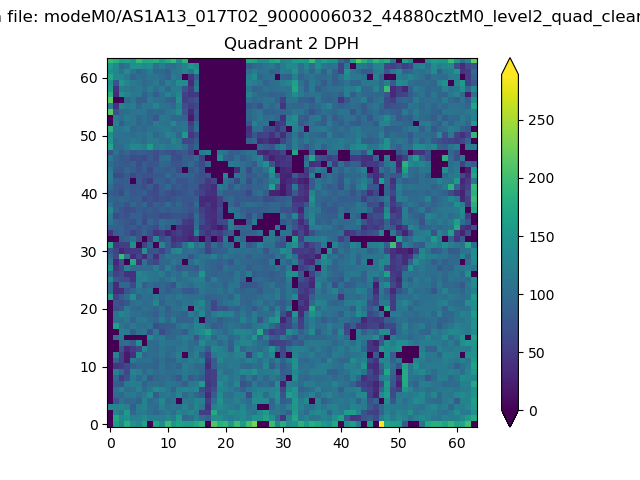
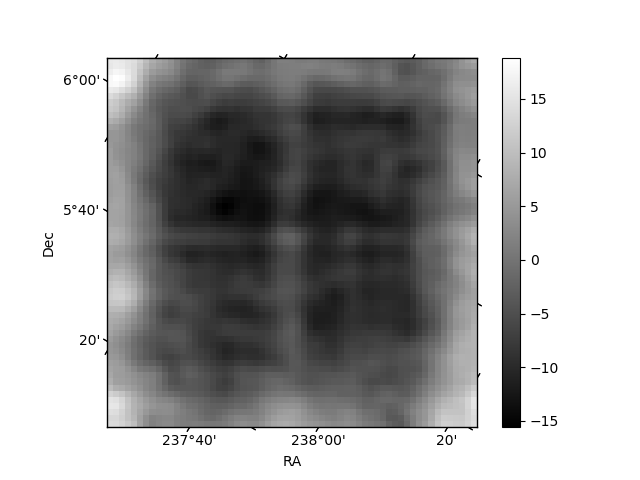
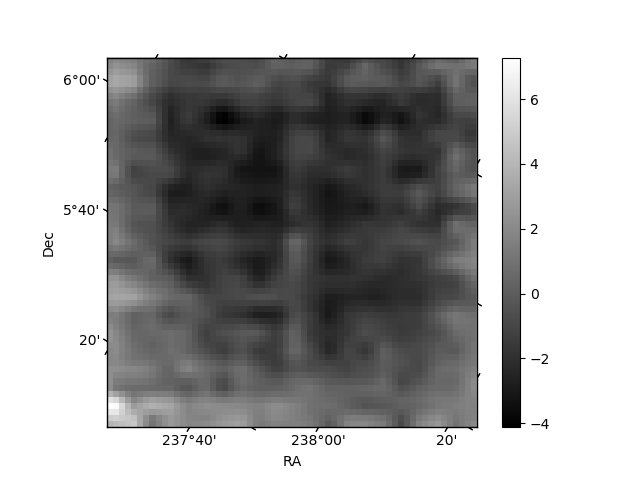
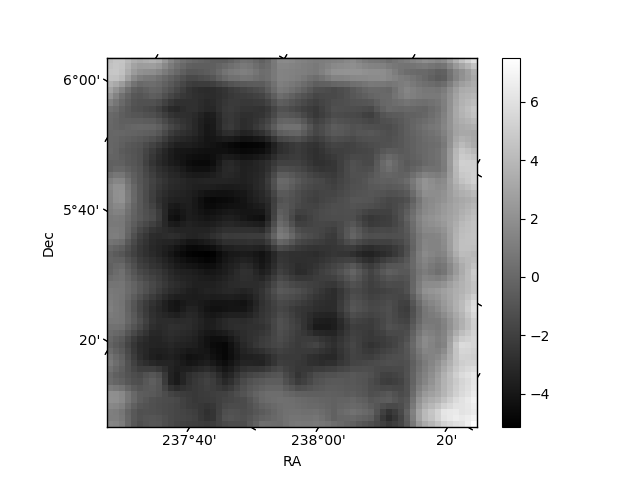
Histogram calculated using DETX and DETY for each event in the final _common_clean file
| Quadrant A | 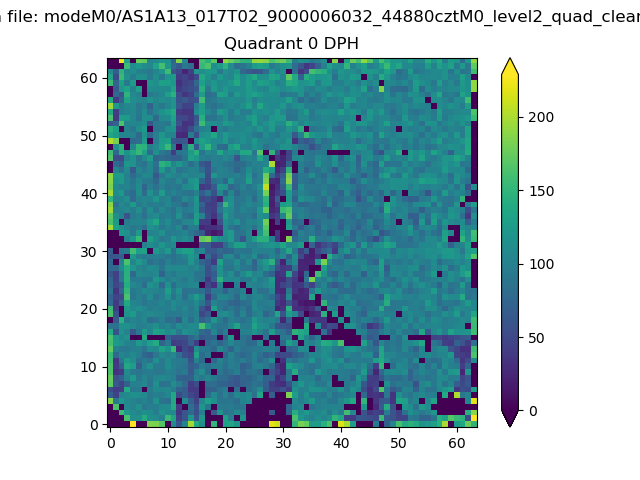 |
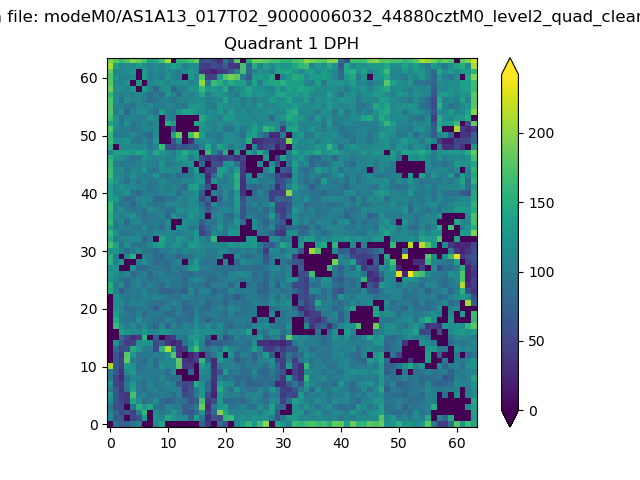 |
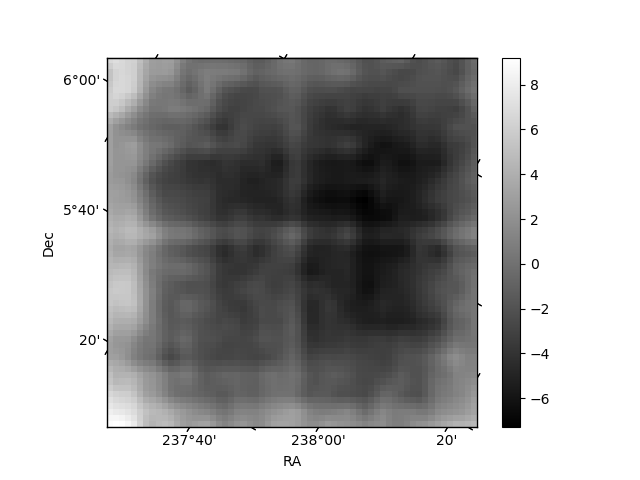
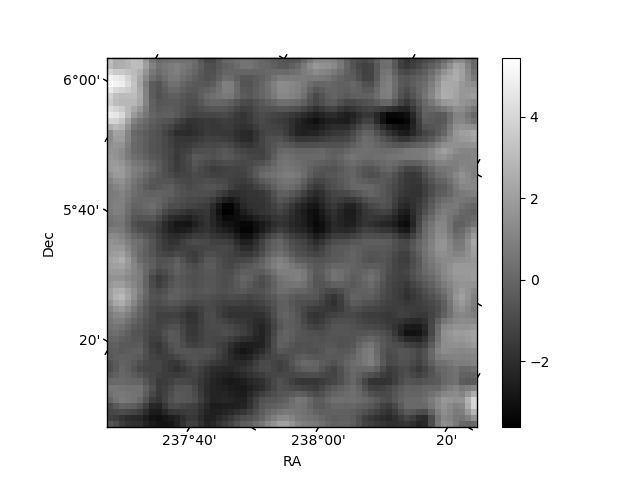
Quadrant B |
|---|---|---|---|
| Quadrant D | 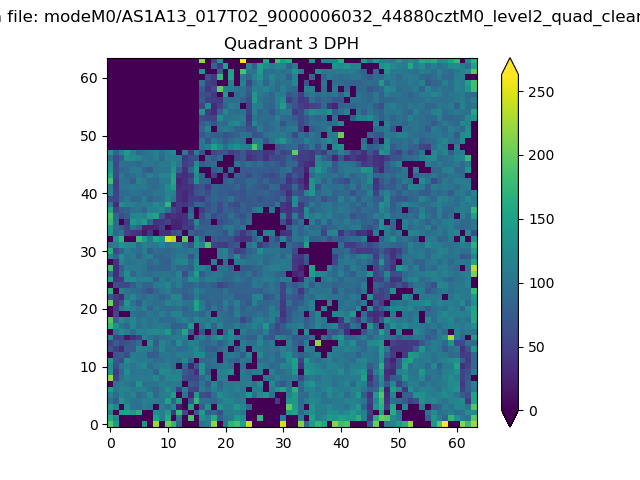 |
 |
Quadrant C |
| Plot type | Count rate plots | Images |
|---|---|---|
| Comparison with Poisson distribution Blue bars denote a histogram of data divided into 1 sec bins. Red curve is a Poisson curve with rate = median count rate of data. |
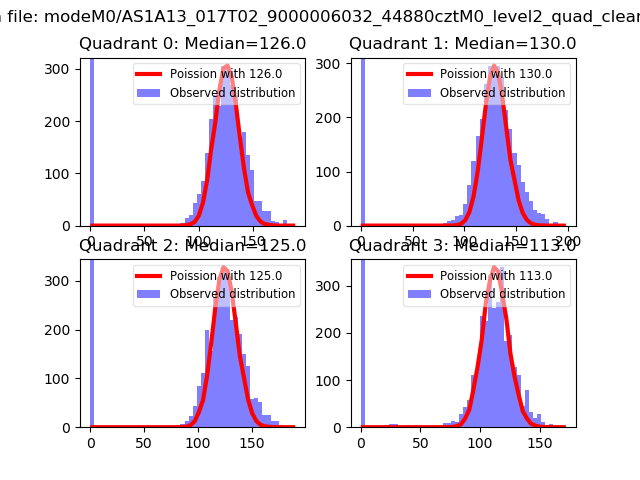 |
 |
| Quadrant-wise count rates Data is divided into 100 sec bins |
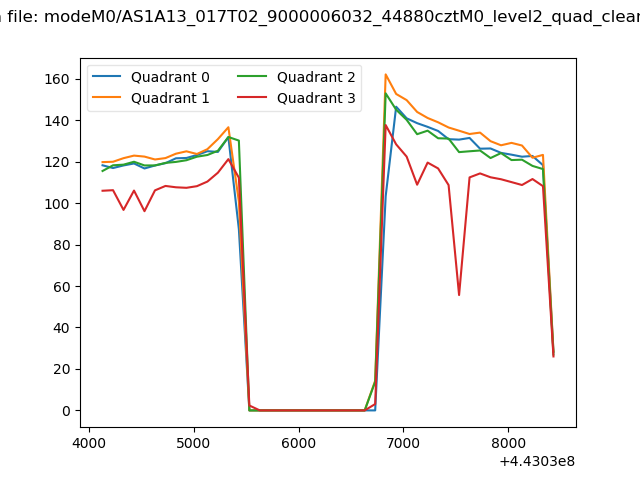 |
|
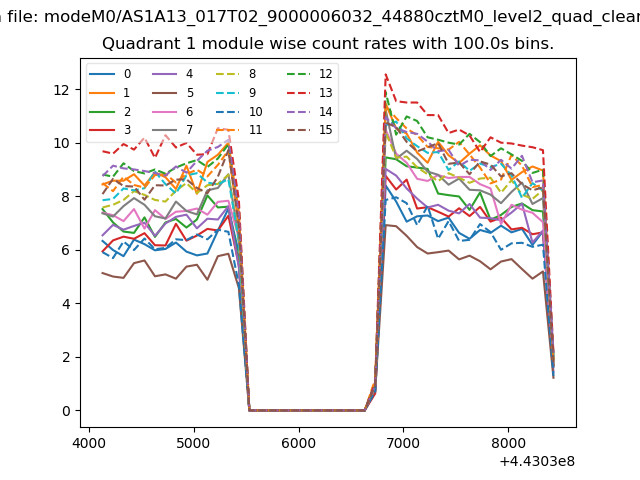
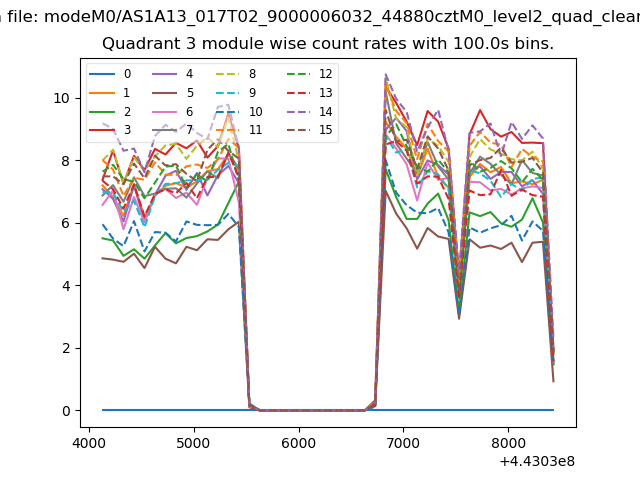
| Module-wise count rates for Quadrant A Data is divided into 100 sec bins |
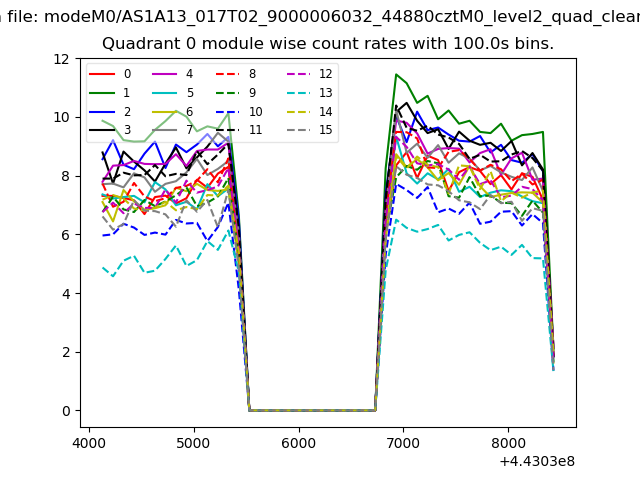 |
 |
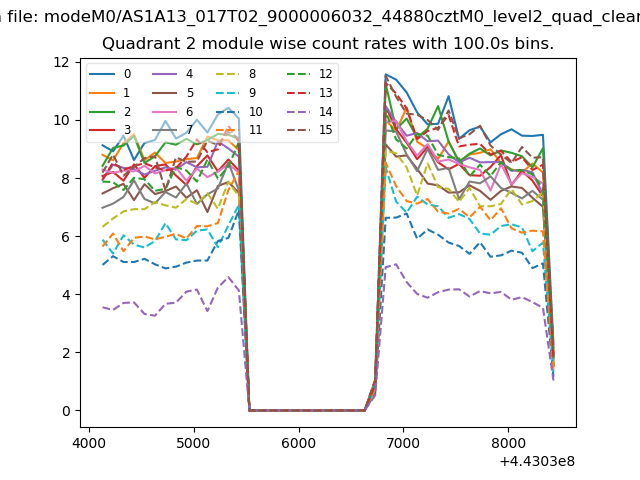
| Module-wise count rates for Quadrant B Data is divided into 100 sec bins |
 |
 |
| Module-wise count rates for Quadrant C Data is divided into 100 sec bins |
 |
 |
| Module-wise count rates for Quadrant D Data is divided into 100 sec bins |
 |
 |
| Parameter | Plot |
|---|---|
| CZT HV Monitor | 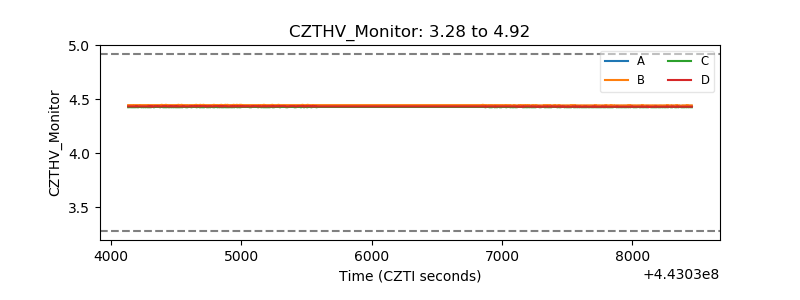 |
| D_VDD | 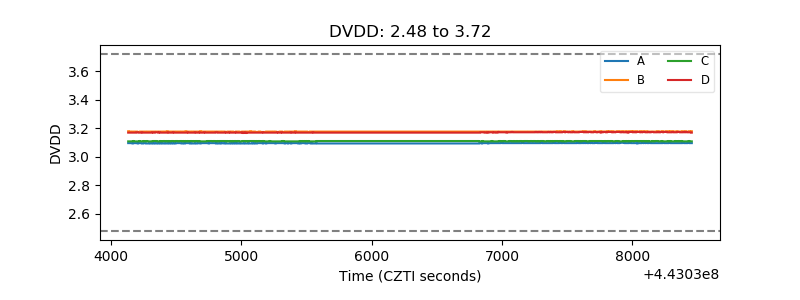 |
| Temperature 1 | 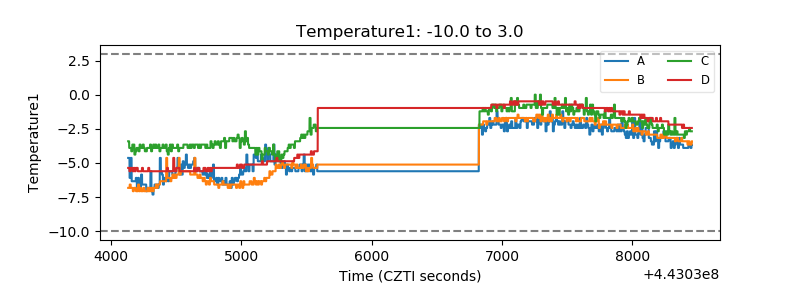 |
| Veto HV Monitor |  |
| Veto LLD | 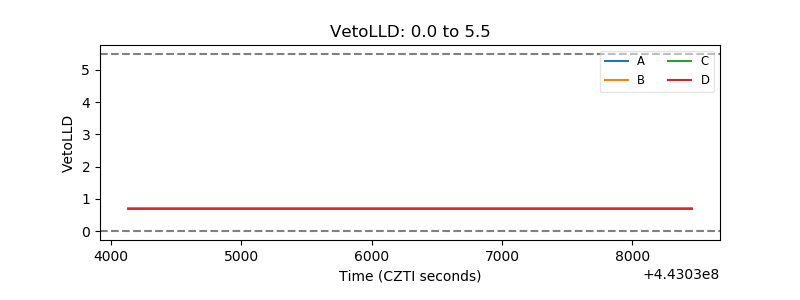 |
| Alpha Counter | 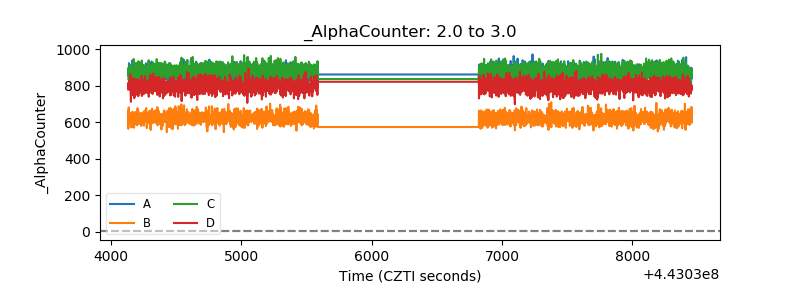 |
| _CPM_Rate | 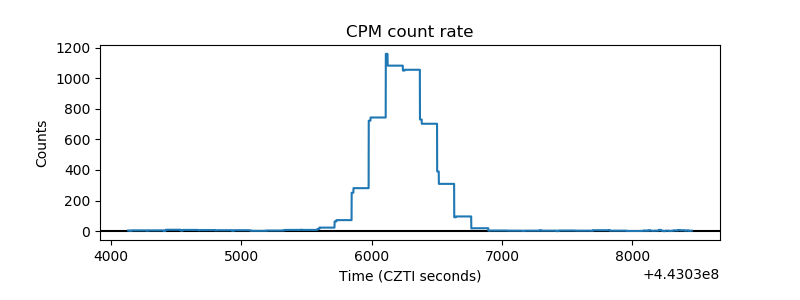 |
| CZT Counter | 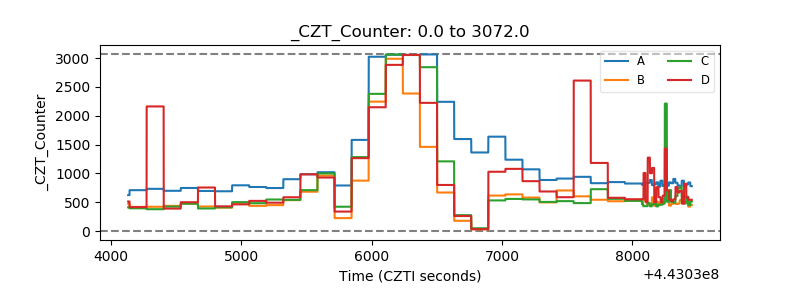 |
| +2.5 Volts monitor | 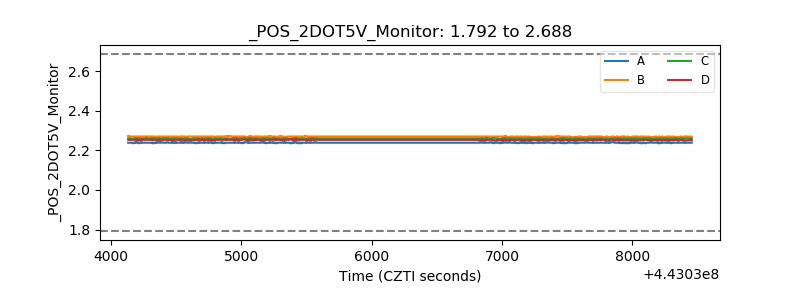 |
| +5 Volts monitor | 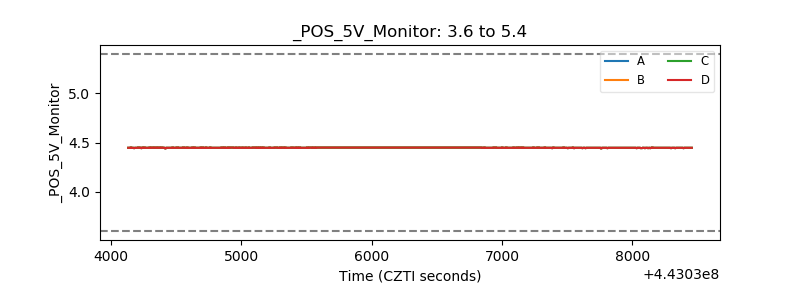 |
| _ROLL_ROT | 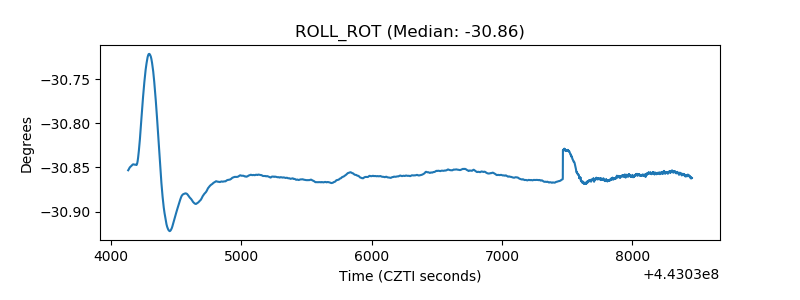 |
| _Roll_DEC | 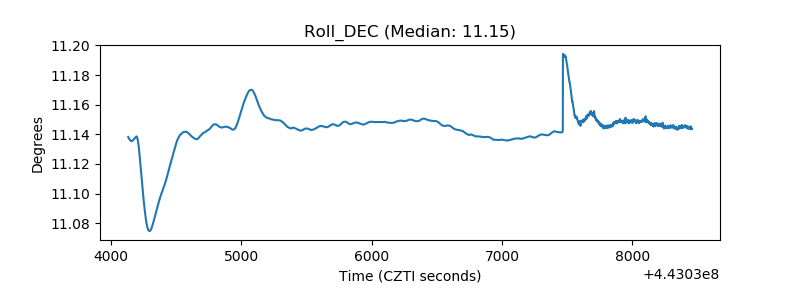 |
| _Roll_RA | 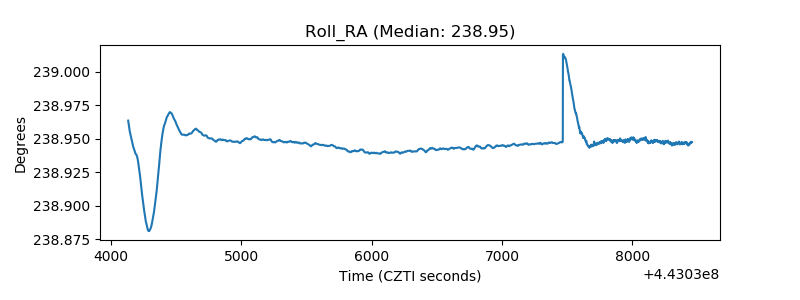 |
| Veto Counter | 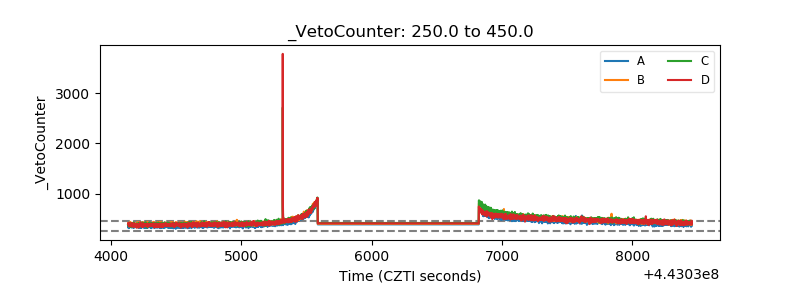 |