| Param | Original file | Final file |
|---|---|---|
| Filename | modeM0/AS1A13_017T02_9000006032_44882cztM0_level2.fits | modeM0/AS1A13_017T02_9000006032_44882cztM0_level2_quad_clean.evt |
| Size (bytes) | 502,922,880 | 112,524,480 |
| Size | 479.6 MB | 107.3 MB |
| Events in quadrant A | 6,063,884 | 733,064 |
| Events in quadrant B | 3,807,818 | 773,528 |
| Events in quadrant C | 3,383,741 | 757,806 |
| Events in quadrant D | 4,845,242 | 679,305 |
| Mode SS | |||
|---|---|---|---|
| Quadrant | BADHDUFLAG | Total packets | Discarded packets |
| A | 0 | 134 | 0 |
| B | 0 | 134 | 0 |
| C | 0 | 134 | 0 |
| D | 0 | 134 | 0 |
| Mode M0 | |||
|---|---|---|---|
| Quadrant | BADHDUFLAG | Total packets | Discarded packets |
| A | 0 | 22954 | 4 |
| B | 0 | 15705 | 2 |
| C | 0 | 14566 | 2 |
| D | 0 | 19025 | 2 |
| Mode M9 | |||
|---|---|---|---|
| Quadrant | BADHDUFLAG | Total packets | Discarded packets |
| A | 0 | 18 | 0 |
| B | 0 | 19 | 0 |
| C | 0 | 19 | 0 |
| D | 0 | 19 | 0 |
| Quadrant | Total seconds | Saturated seconds | Saturation percentage |
|---|---|---|---|
| A | 6651 | 408 | 6.134416% |
| B | 6651 | 219 | 3.292738% |
| C | 6651 | 79 | 1.187791% |
| D | 6651 | 278 | 4.179823% |
Noise dominated data is calculated using 1-second bins in cleaned event files. If a bin has >2000 counts, and if more than 50% of those come from <1% of pixels, then it is considered to be noise-dominated and hence unusable.
| Quadrant | # 1 sec bins | Bins with >0 counts | Bins with >2000 counts | High rate bins dominated by noise | Noise dominated (total time) | Noise dominated (detector-on time) | Marked lightcurve |
|---|---|---|---|---|---|---|---|
| A | 7626 | 6652 | 153 | 153 | 2.01% | 2.30% | 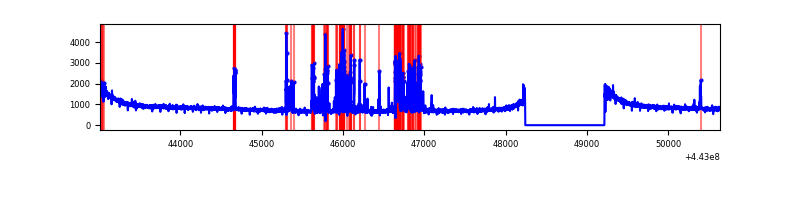 |
| B | 7626 | 6652 | 78 | 78 | 1.02% | 1.17% | 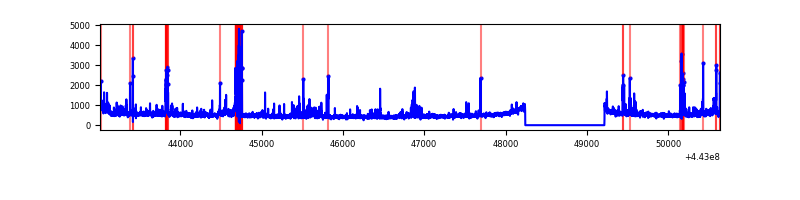 |
| C | 7626 | 6652 | 35 | 35 | 0.46% | 0.53% | 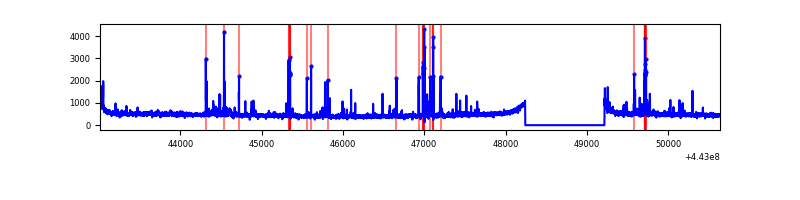 |
| D | 7626 | 6652 | 169 | 169 | 2.22% | 2.54% | 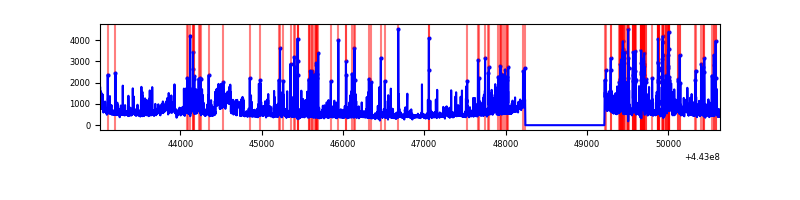 |
Top three noisy pixels from each quadrant. If the there are fewer than three noisy pixels in the level2.evt file, extra rows are filled as -1
| Pixel properties | Quadrant properties | ||||||
|---|---|---|---|---|---|---|---|
| Quadrant | DetID | PixID | Counts | Sigma | Mean | Median | Sigma |
| A | 10 | 83 | 2389084 | 14656.45 | 779 | 763 | 163.0 |
| A | 13 | 248 | 633458 | 3882.67 | 779 | 763 | 163.0 |
| A | 7 | 3 | 15924 | 93.04 | 779 | 763 | 163.0 |
| B | 0 | 155 | 156966 | 995.89 | 786 | 764 | 156.8 |
| B | 5 | 32 | 134756 | 854.29 | 786 | 764 | 156.8 |
| B | 5 | 255 | 98364 | 622.26 | 786 | 764 | 156.8 |
| C | 14 | 254 | 220910 | 1196.36 | 782 | 788 | 184.0 |
| C | 12 | 2 | 55462 | 297.15 | 782 | 788 | 184.0 |
| C | 1 | 3 | 29376 | 155.37 | 782 | 788 | 184.0 |
| D | 1 | 52 | 975920 | 5009.62 | 769 | 748 | 194.7 |
| D | 13 | 249 | 334015 | 1712.05 | 769 | 748 | 194.7 |
| D | 13 | 187 | 165284 | 845.25 | 769 | 748 | 194.7 |
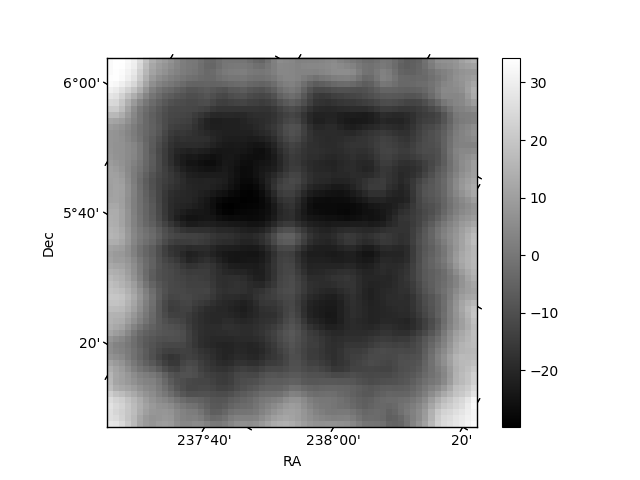
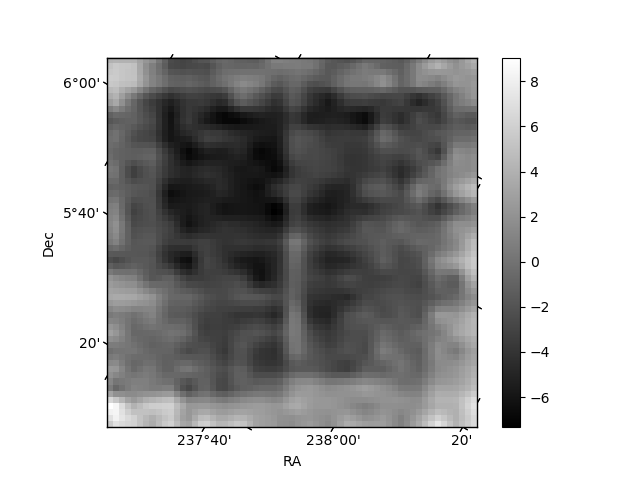
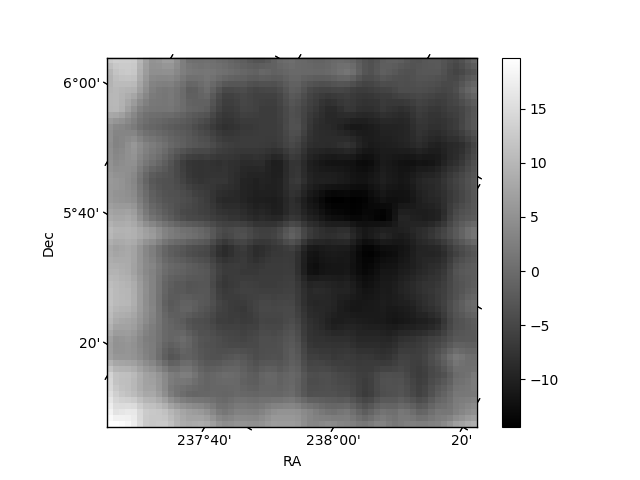
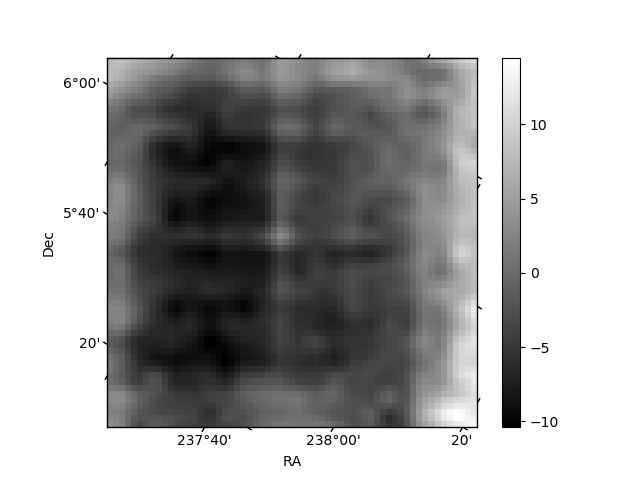
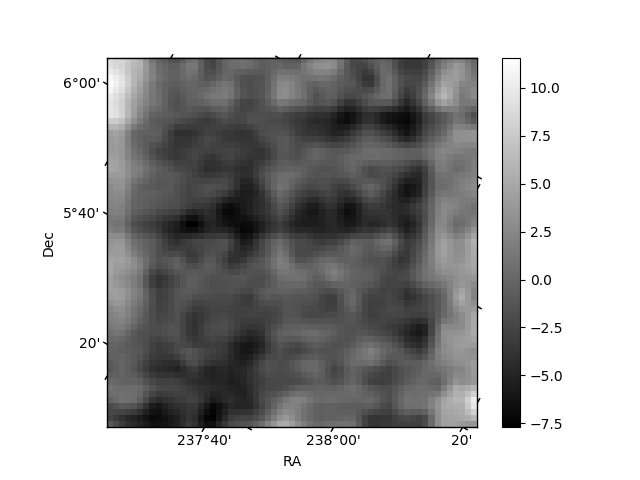
Histogram calculated using DETX and DETY for each event in the final _common_clean file
| Quadrant A | 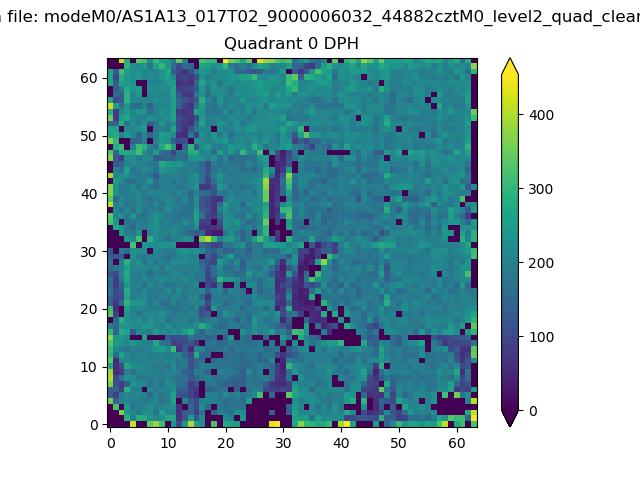 |
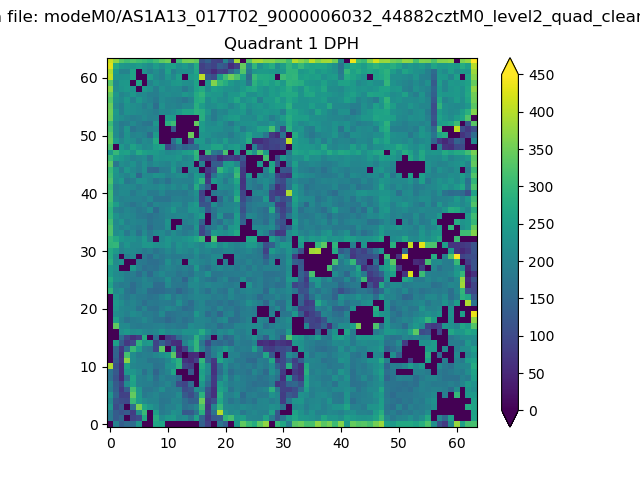 |
Quadrant B |
|---|---|---|---|
| Quadrant D | 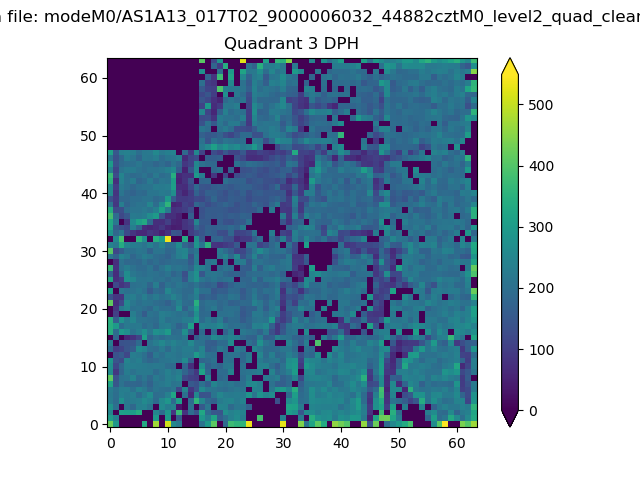 |
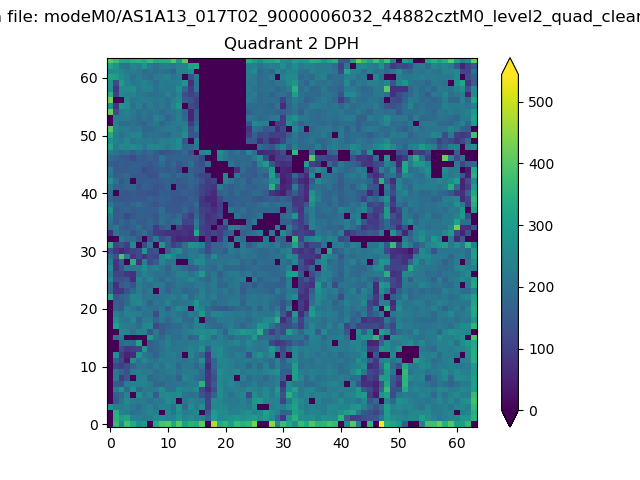 |
Quadrant C |
| Plot type | Count rate plots | Images |
|---|---|---|
| Comparison with Poisson distribution Blue bars denote a histogram of data divided into 1 sec bins. Red curve is a Poisson curve with rate = median count rate of data. |
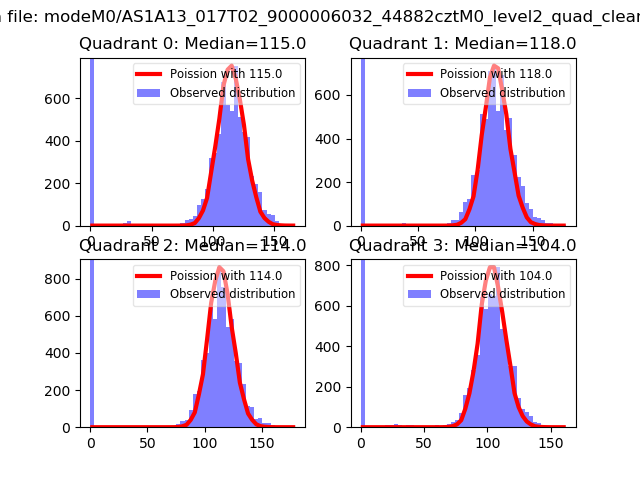 |
 |
| Quadrant-wise count rates Data is divided into 100 sec bins |
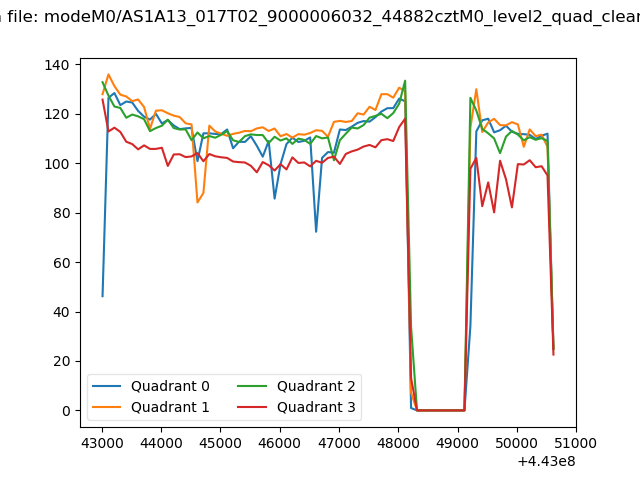 |
|
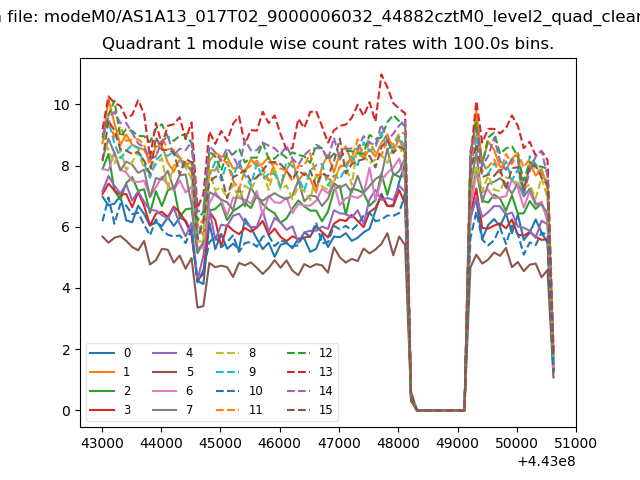
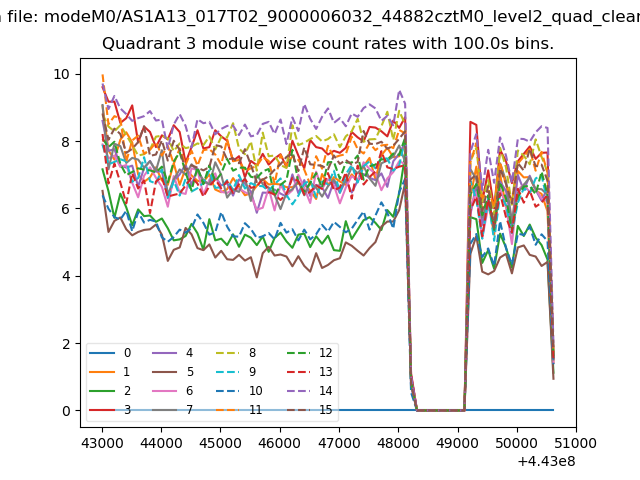
| Module-wise count rates for Quadrant A Data is divided into 100 sec bins |
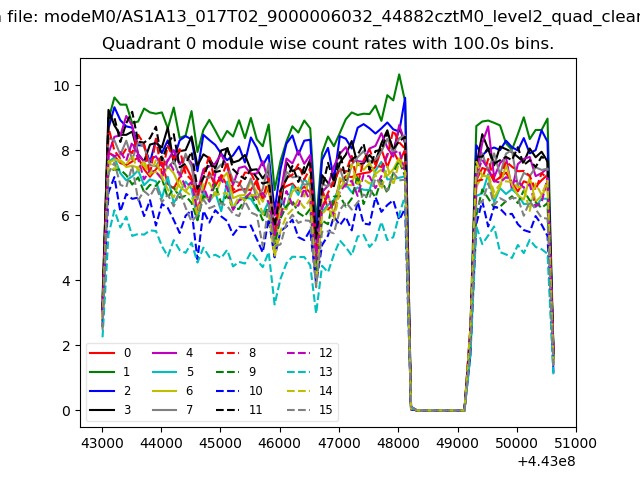 |
 |
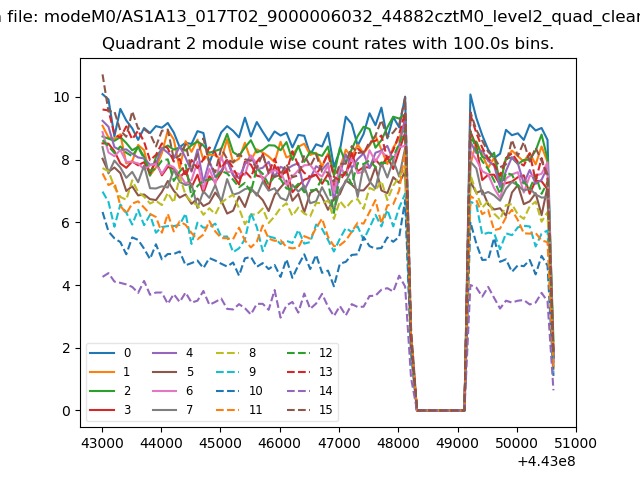
| Module-wise count rates for Quadrant B Data is divided into 100 sec bins |
 |
 |
| Module-wise count rates for Quadrant C Data is divided into 100 sec bins |
 |
 |
| Module-wise count rates for Quadrant D Data is divided into 100 sec bins |
 |
 |
| Parameter | Plot |
|---|---|
| CZT HV Monitor | 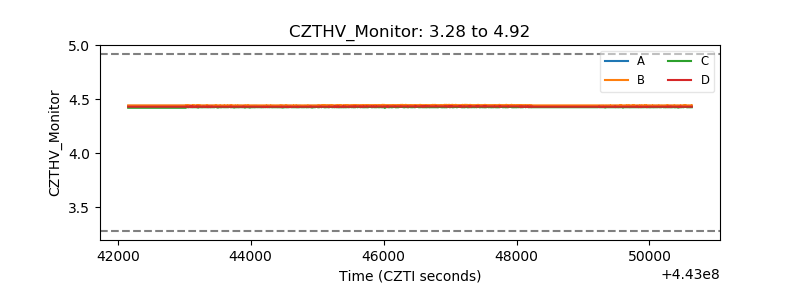 |
| D_VDD | 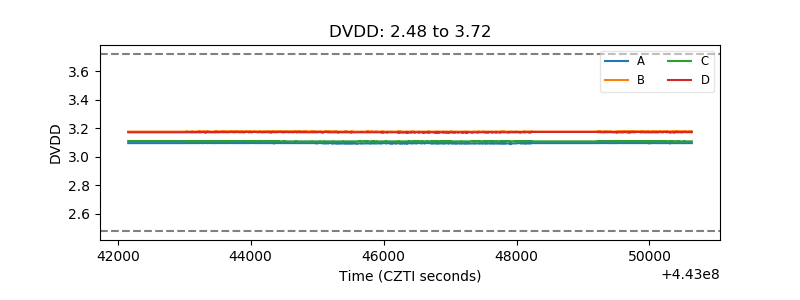 |
| Temperature 1 | 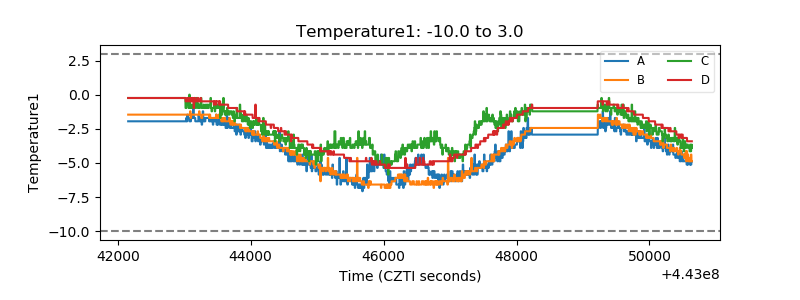 |
| Veto HV Monitor | 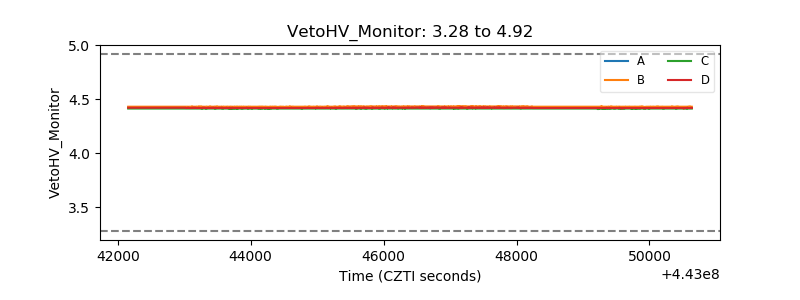 |
| Veto LLD | 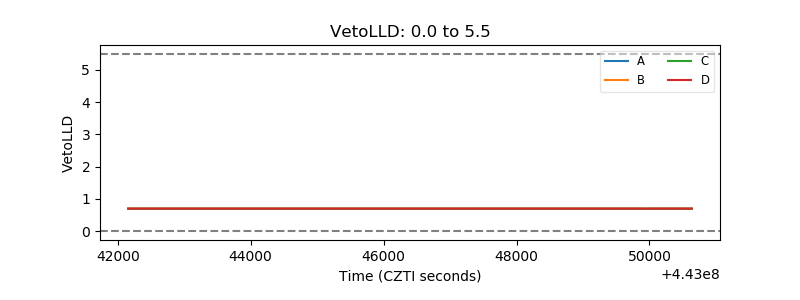 |
| Alpha Counter | 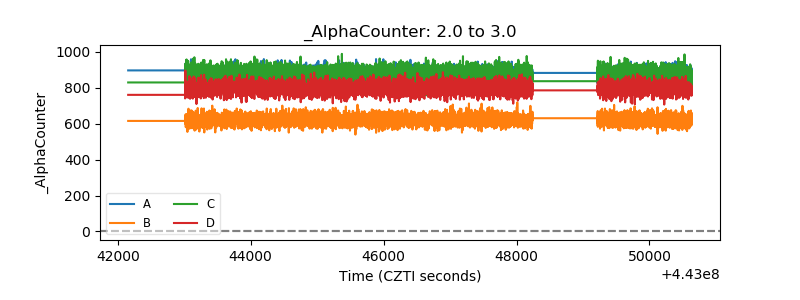 |
| _CPM_Rate | 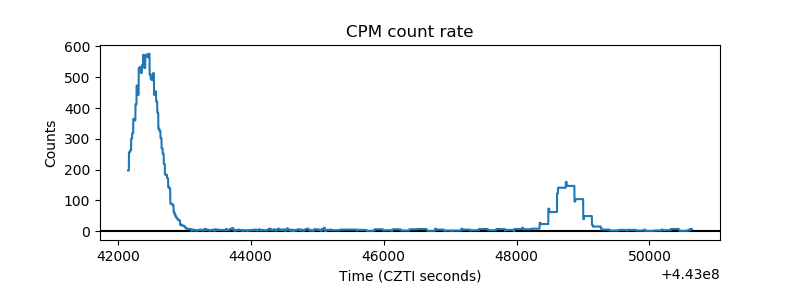 |
| CZT Counter | 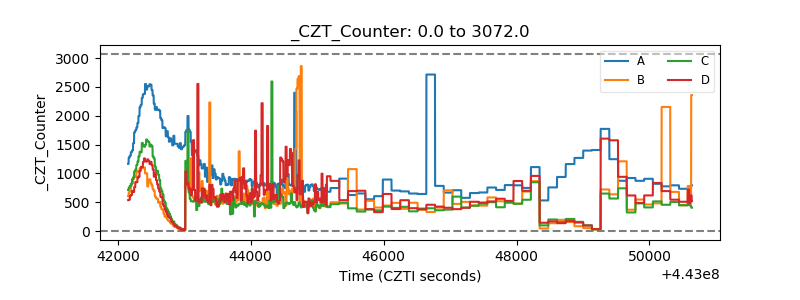 |
| +2.5 Volts monitor | 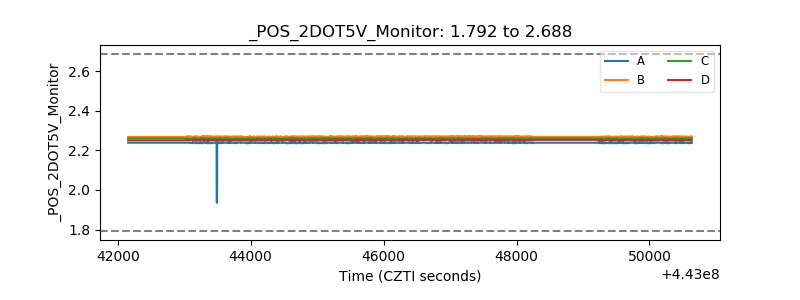 |
| +5 Volts monitor | 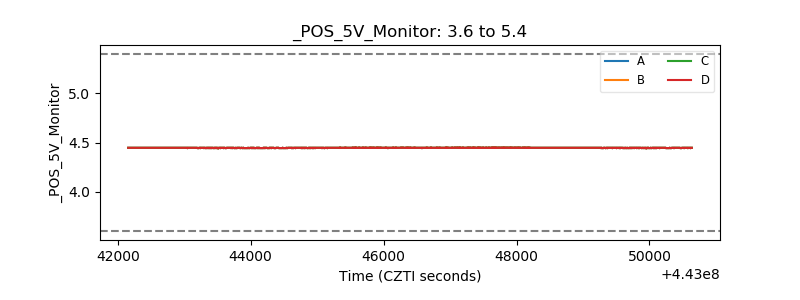 |
| _ROLL_ROT | 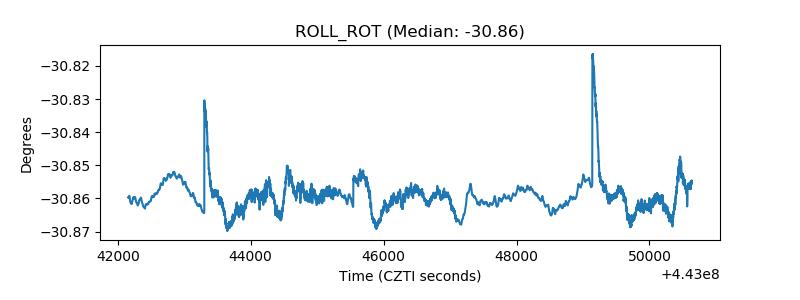 |
| _Roll_DEC |  |
| _Roll_RA | 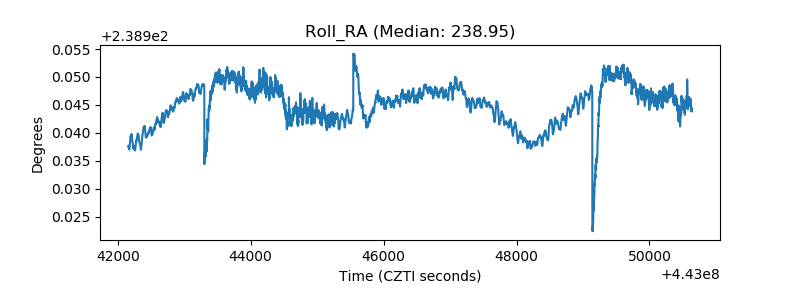 |
| Veto Counter | 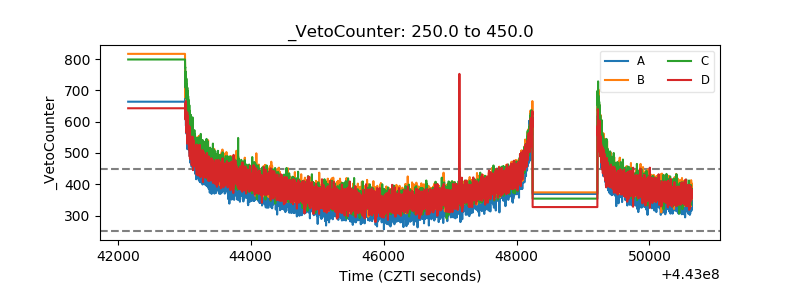 |