| Param | Original file | Final file |
|---|---|---|
| Filename | modeM0/AS1A13_017T02_9000006032_44883cztM0_level2.fits | modeM0/AS1A13_017T02_9000006032_44883cztM0_level2_quad_clean.evt |
| Size (bytes) | 559,555,200 | 121,950,720 |
| Size | 533.6 MB | 116.3 MB |
| Events in quadrant A | 6,203,699 | 798,387 |
| Events in quadrant B | 4,292,918 | 834,376 |
| Events in quadrant C | 3,609,458 | 825,232 |
| Events in quadrant D | 6,028,350 | 715,037 |
| Mode SS | |||
|---|---|---|---|
| Quadrant | BADHDUFLAG | Total packets | Discarded packets |
| A | 0 | 154 | 0 |
| B | 0 | 154 | 0 |
| C | 0 | 154 | 0 |
| D | 0 | 154 | 0 |
| Mode M0 | |||
|---|---|---|---|
| Quadrant | BADHDUFLAG | Total packets | Discarded packets |
| A | 0 | 24082 | 2 |
| B | 0 | 17878 | 2 |
| C | 0 | 15980 | 2 |
| D | 0 | 23054 | 5 |
| Mode M9 | |||
|---|---|---|---|
| Quadrant | BADHDUFLAG | Total packets | Discarded packets |
| A | 0 | 14 | 0 |
| B | 0 | 14 | 0 |
| C | 0 | 14 | 0 |
| D | 0 | 14 | 0 |
| Quadrant | Total seconds | Saturated seconds | Saturation percentage |
|---|---|---|---|
| A | 7460 | 397 | 5.321716% |
| B | 7460 | 292 | 3.914209% |
| C | 7460 | 94 | 1.260054% |
| D | 7458 | 564 | 7.562349% |
Noise dominated data is calculated using 1-second bins in cleaned event files. If a bin has >2000 counts, and if more than 50% of those come from <1% of pixels, then it is considered to be noise-dominated and hence unusable.
| Quadrant | # 1 sec bins | Bins with >0 counts | Bins with >2000 counts | High rate bins dominated by noise | Noise dominated (total time) | Noise dominated (detector-on time) | Marked lightcurve |
|---|---|---|---|---|---|---|---|
| A | 8855 | 7462 | 20 | 20 | 0.23% | 0.27% | 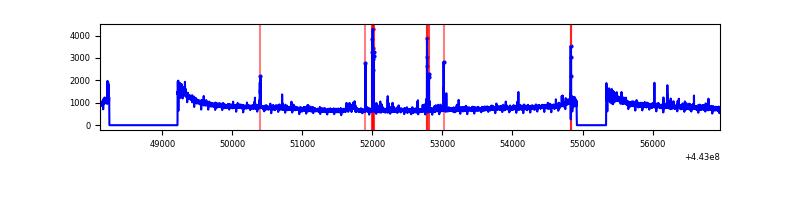 |
| B | 8855 | 7462 | 47 | 47 | 0.53% | 0.63% | 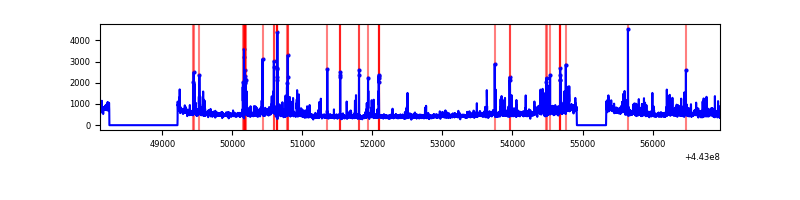 |
| C | 8855 | 7462 | 15 | 15 | 0.17% | 0.20% | 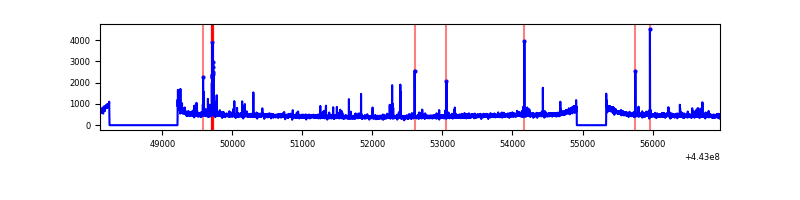 |
| D | 8854 | 7461 | 337 | 337 | 3.81% | 4.52% | 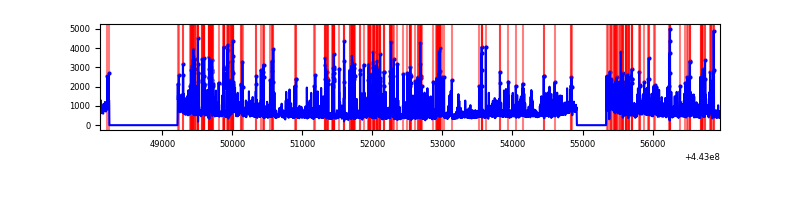 |
Top three noisy pixels from each quadrant. If the there are fewer than three noisy pixels in the level2.evt file, extra rows are filled as -1
| Pixel properties | Quadrant properties | ||||||
|---|---|---|---|---|---|---|---|
| Quadrant | DetID | PixID | Counts | Sigma | Mean | Median | Sigma |
| A | 10 | 83 | 2609061 | 14272.18 | 875 | 856 | 182.7 |
| A | 13 | 248 | 89534 | 485.25 | 875 | 856 | 182.7 |
| A | 10 | 248 | 82005 | 444.05 | 875 | 856 | 182.7 |
| B | 5 | 255 | 232789 | 1311.96 | 879 | 852 | 176.8 |
| B | 0 | 155 | 200461 | 1129.1 | 879 | 852 | 176.8 |
| B | 0 | 219 | 83212 | 465.87 | 879 | 852 | 176.8 |
| C | 14 | 254 | 70064 | 334.75 | 874 | 881 | 206.7 |
| C | 12 | 2 | 63210 | 301.59 | 874 | 881 | 206.7 |
| C | 2 | 14 | 32421 | 152.61 | 874 | 881 | 206.7 |
| D | 1 | 52 | 1407021 | 6508.84 | 850 | 823 | 216.0 |
| D | 13 | 249 | 546845 | 2527.36 | 850 | 823 | 216.0 |
| D | 11 | 176 | 220967 | 1018.97 | 850 | 823 | 216.0 |
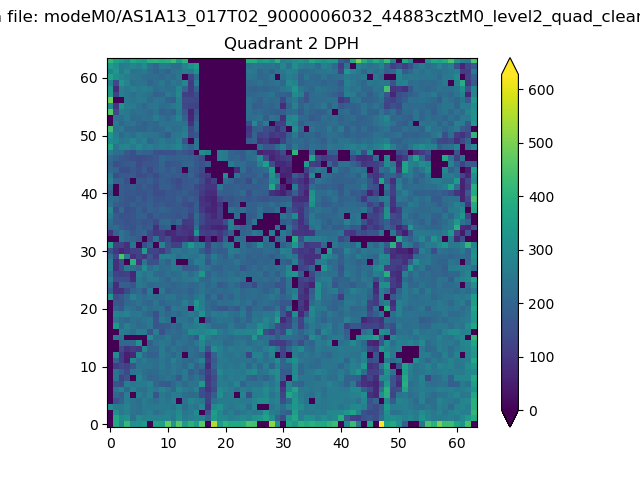
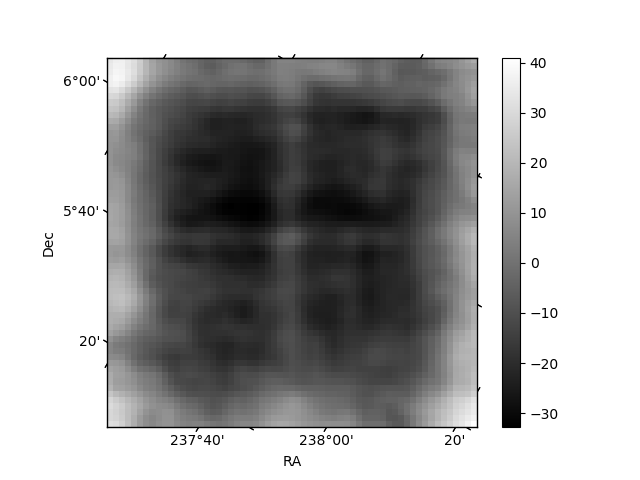
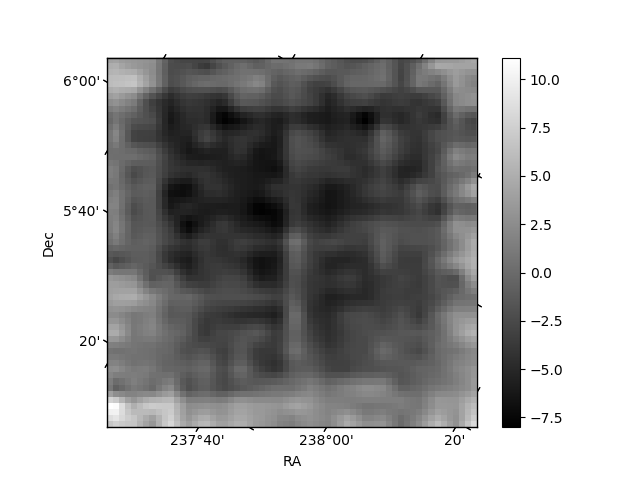
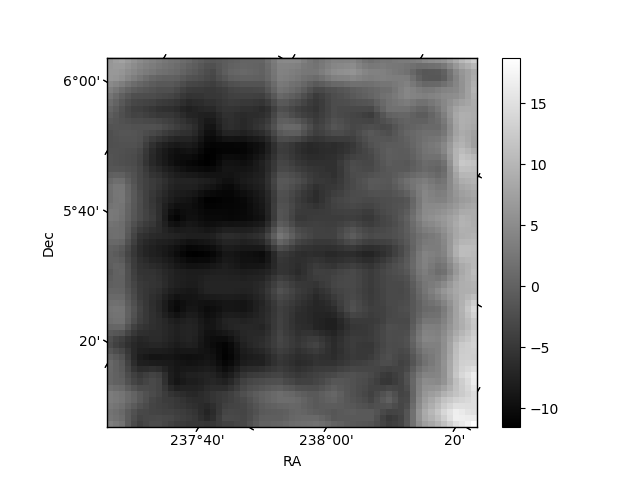
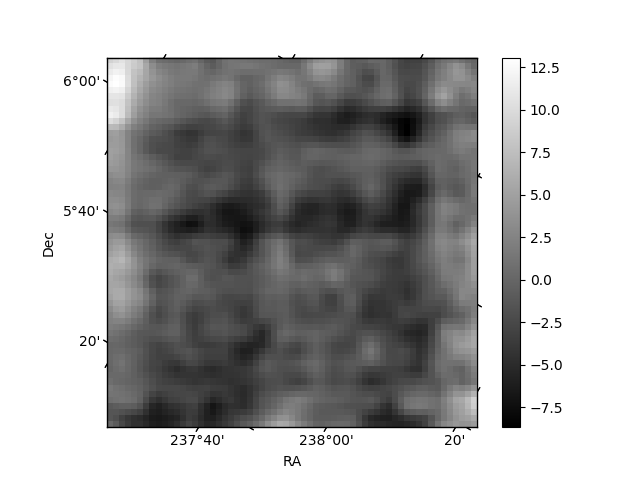
Histogram calculated using DETX and DETY for each event in the final _common_clean file
| Quadrant A | 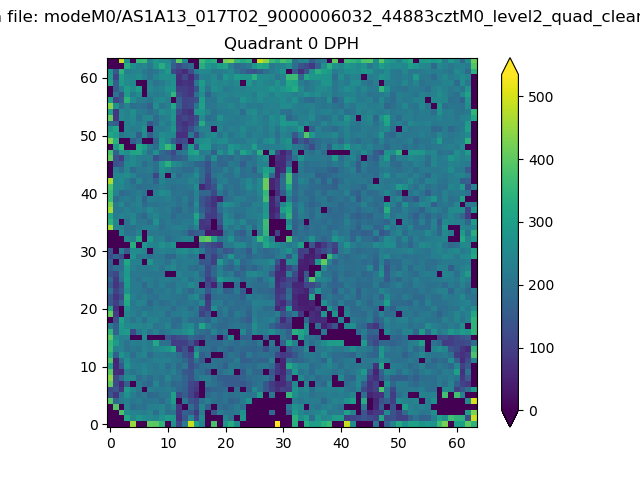 |
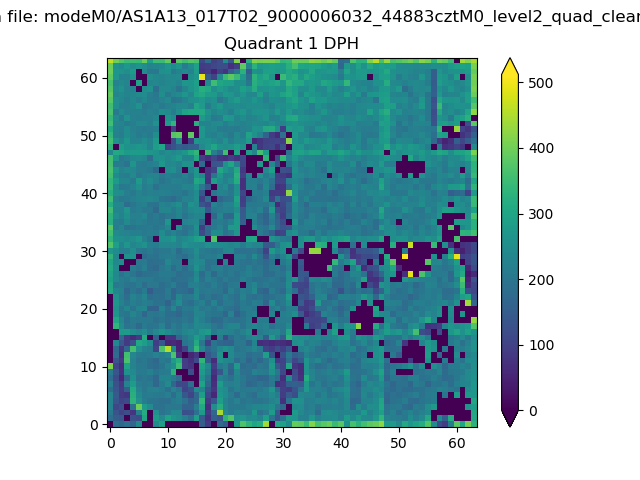 |
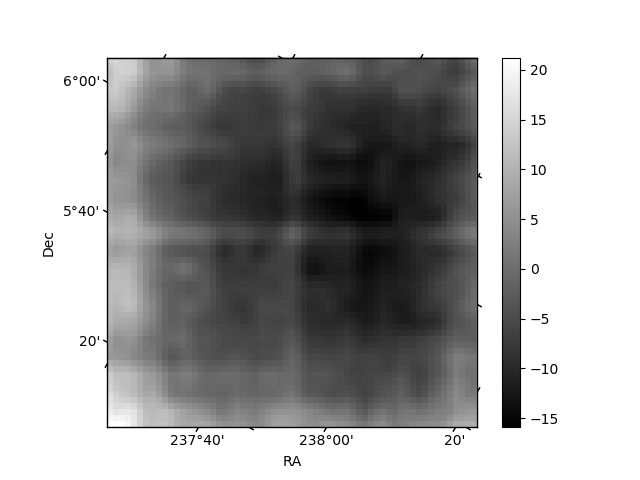
Quadrant B |
|---|---|---|---|
| Quadrant D | 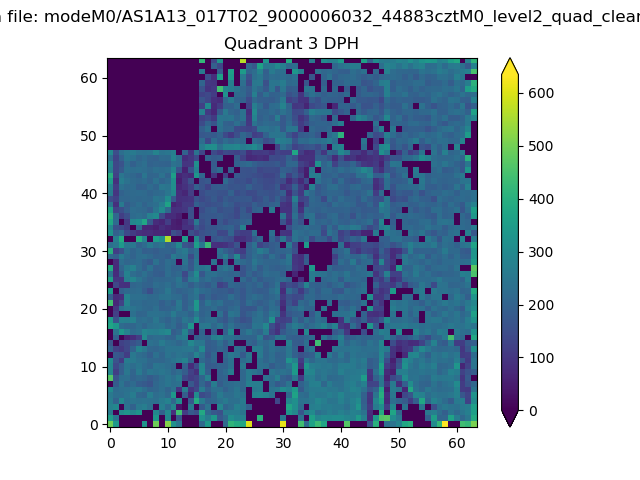 |
 |
Quadrant C |
| Plot type | Count rate plots | Images |
|---|---|---|
| Comparison with Poisson distribution Blue bars denote a histogram of data divided into 1 sec bins. Red curve is a Poisson curve with rate = median count rate of data. |
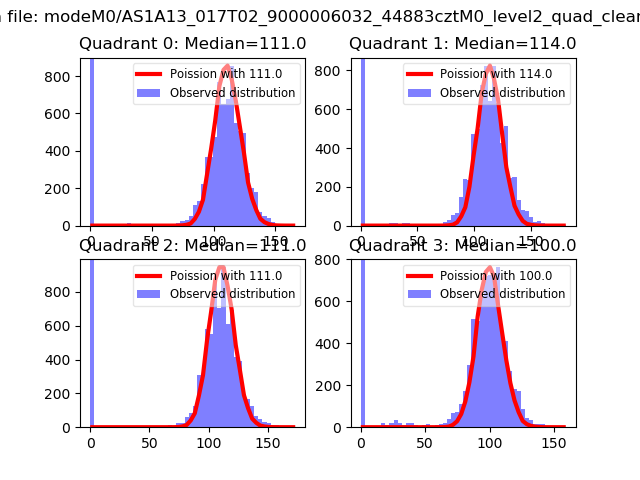 |
 |
| Quadrant-wise count rates Data is divided into 100 sec bins |
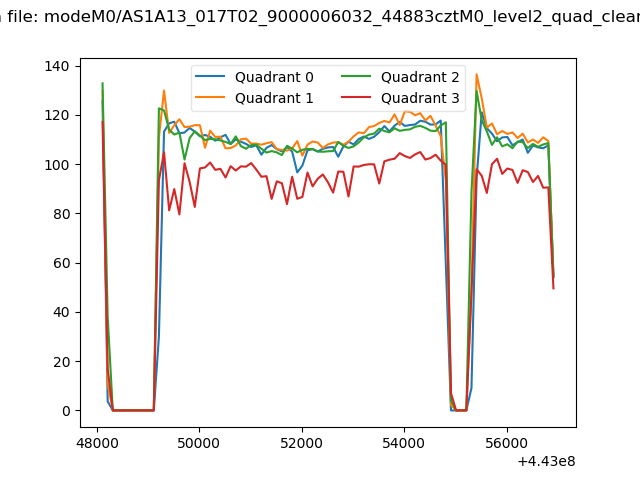 |
|
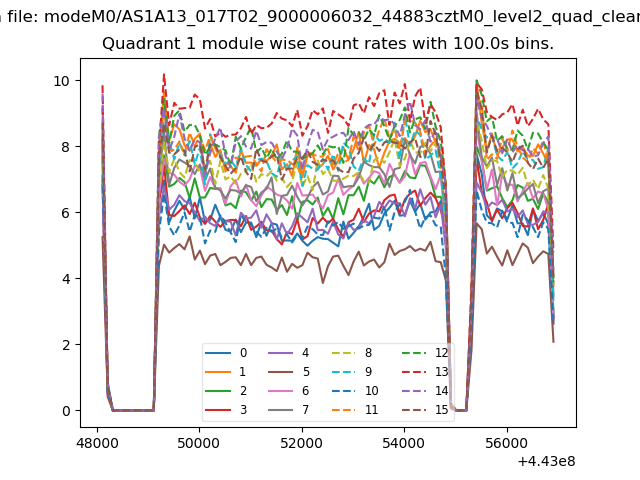
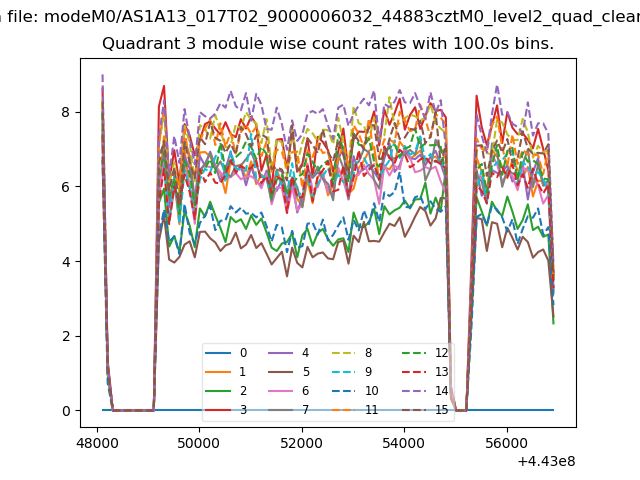
| Module-wise count rates for Quadrant A Data is divided into 100 sec bins |
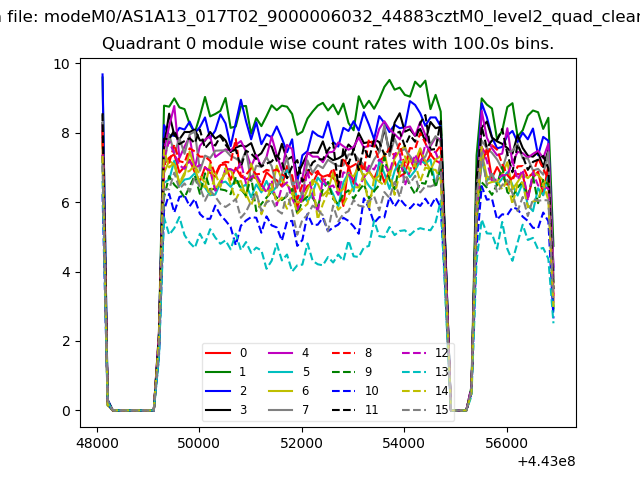 |
 |
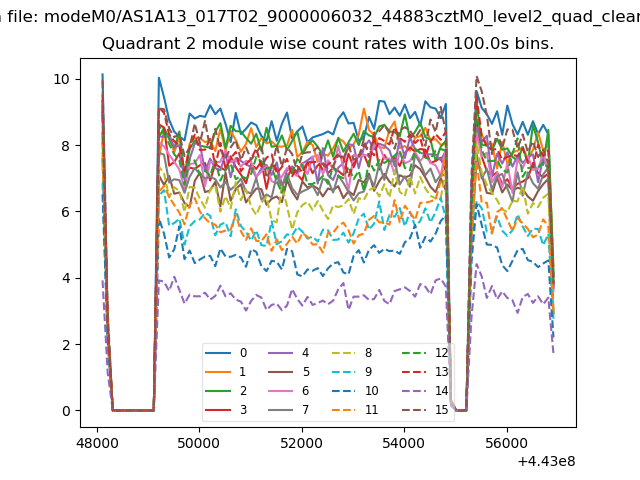
| Module-wise count rates for Quadrant B Data is divided into 100 sec bins |
 |
 |
| Module-wise count rates for Quadrant C Data is divided into 100 sec bins |
 |
 |
| Module-wise count rates for Quadrant D Data is divided into 100 sec bins |
 |
 |
| Parameter | Plot |
|---|---|
| CZT HV Monitor | 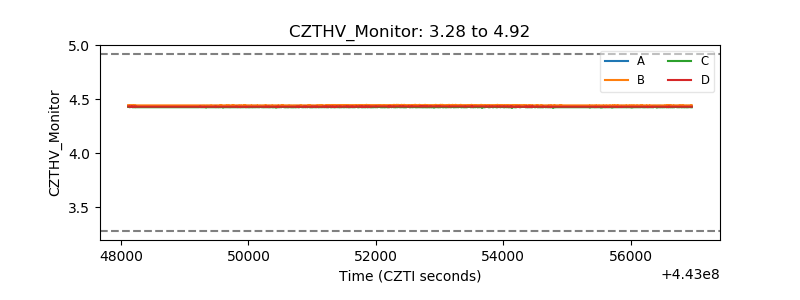 |
| D_VDD | 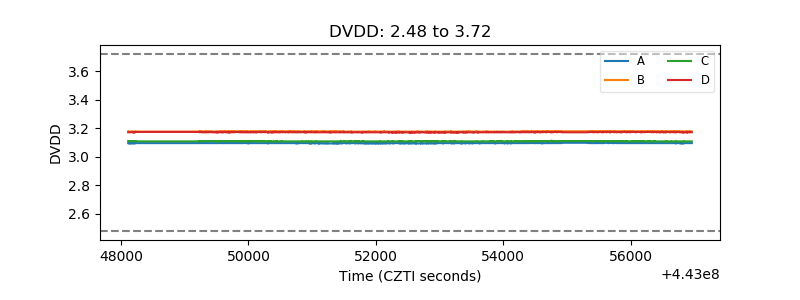 |
| Temperature 1 | 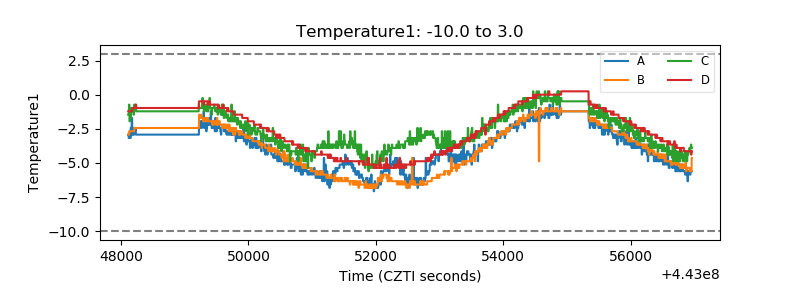 |
| Veto HV Monitor | 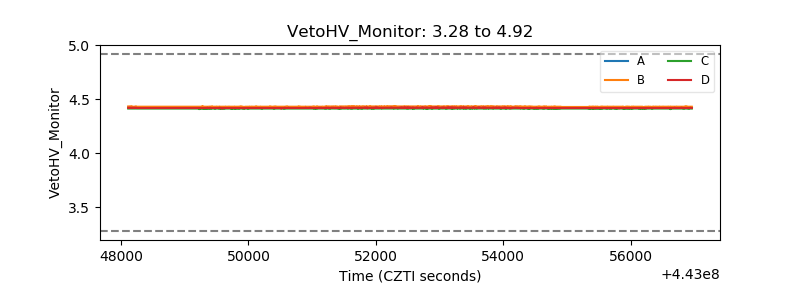 |
| Veto LLD | 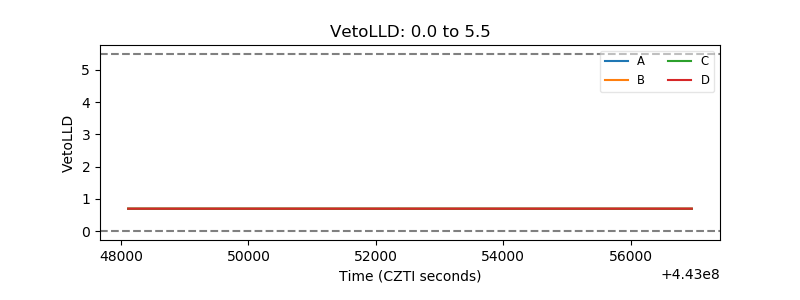 |
| Alpha Counter |  |
| _CPM_Rate | 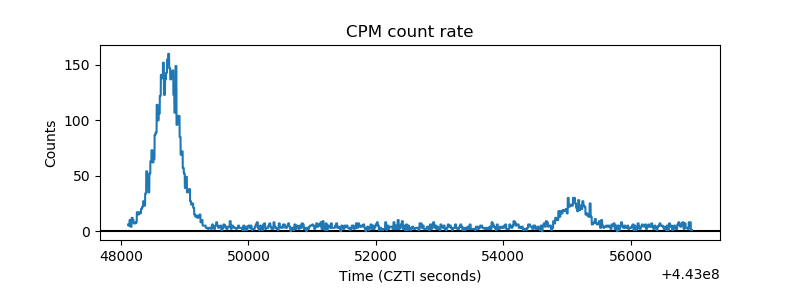 |
| CZT Counter | 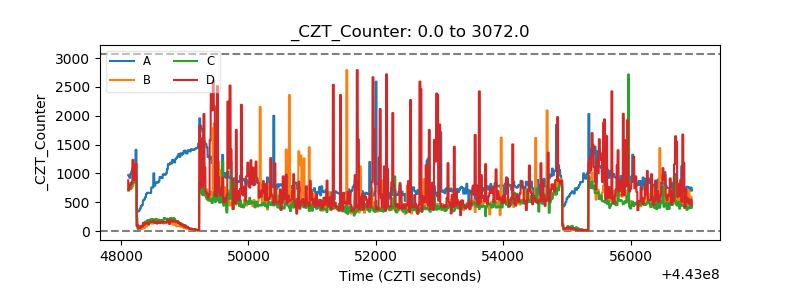 |
| +2.5 Volts monitor | 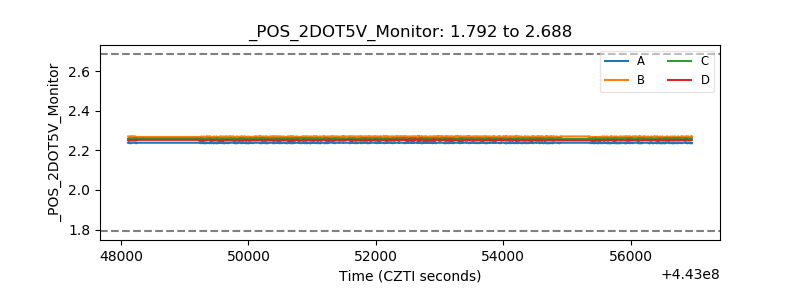 |
| +5 Volts monitor | 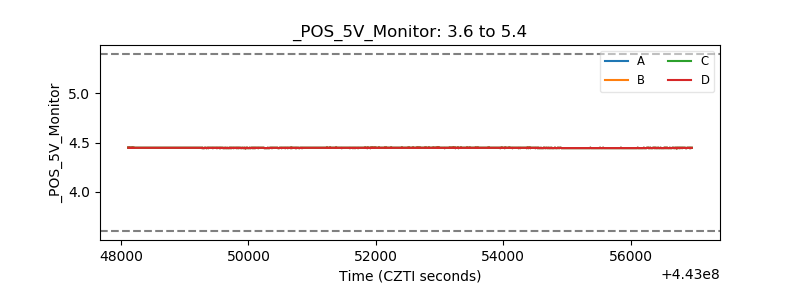 |
| _ROLL_ROT | 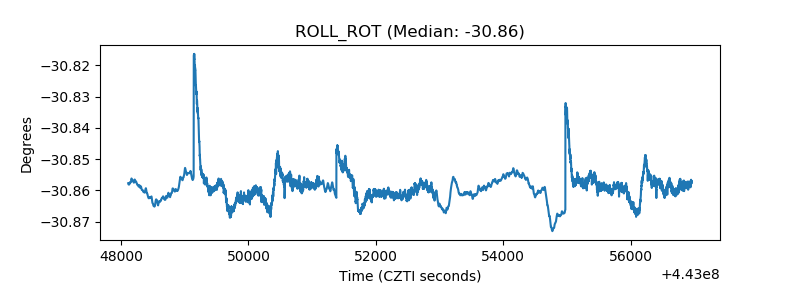 |
| _Roll_DEC | 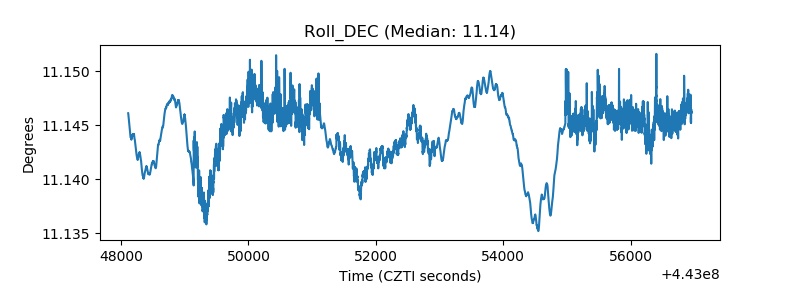 |
| _Roll_RA | 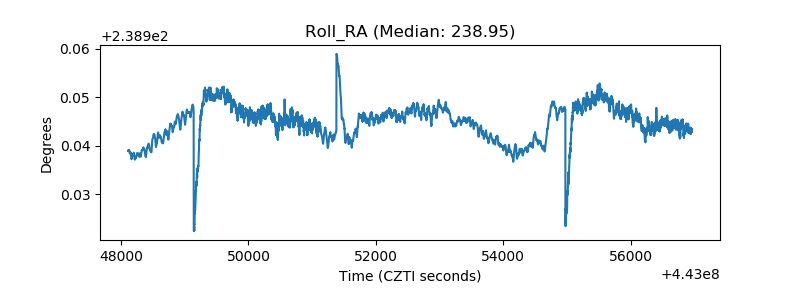 |
| Veto Counter | 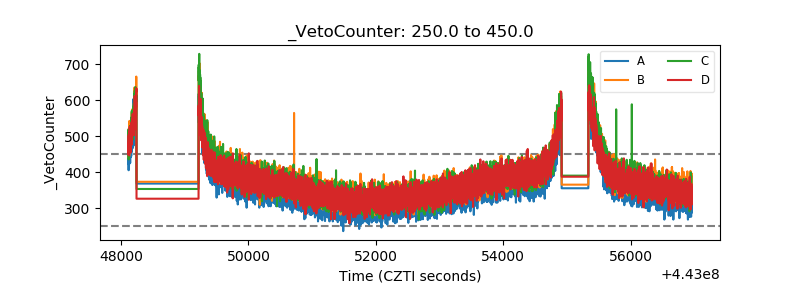 |