| Param | Original file | Final file |
|---|---|---|
| Filename | modeM0/AS1A13_017T02_9000006032_44884cztM0_level2.fits | modeM0/AS1A13_017T02_9000006032_44884cztM0_level2_quad_clean.evt |
| Size (bytes) | 567,616,320 | 128,275,200 |
| Size | 541.3 MB | 122.3 MB |
| Events in quadrant A | 6,227,314 | 858,230 |
| Events in quadrant B | 4,464,204 | 874,410 |
| Events in quadrant C | 3,599,096 | 858,761 |
| Events in quadrant D | 6,111,100 | 745,670 |
| Mode SS | |||
|---|---|---|---|
| Quadrant | BADHDUFLAG | Total packets | Discarded packets |
| A | 0 | 158 | 0 |
| B | 0 | 158 | 0 |
| C | 0 | 158 | 0 |
| D | 0 | 158 | 0 |
| Mode M0 | |||
|---|---|---|---|
| Quadrant | BADHDUFLAG | Total packets | Discarded packets |
| A | 0 | 24650 | 0 |
| B | 0 | 18646 | 0 |
| C | 0 | 16380 | 1 |
| D | 0 | 23556 | 5 |
| Quadrant | Total seconds | Saturated seconds | Saturation percentage |
|---|---|---|---|
| A | 7863 | 145 | 1.844080% |
| B | 7863 | 192 | 2.441816% |
| C | 7862 | 21 | 0.267108% |
| D | 7861 | 507 | 6.449561% |
Noise dominated data is calculated using 1-second bins in cleaned event files. If a bin has >2000 counts, and if more than 50% of those come from <1% of pixels, then it is considered to be noise-dominated and hence unusable.
| Quadrant | # 1 sec bins | Bins with >0 counts | Bins with >2000 counts | High rate bins dominated by noise | Noise dominated (total time) | Noise dominated (detector-on time) | Marked lightcurve |
|---|---|---|---|---|---|---|---|
| A | 7863 | 7863 | 26 | 26 | 0.33% | 0.33% | 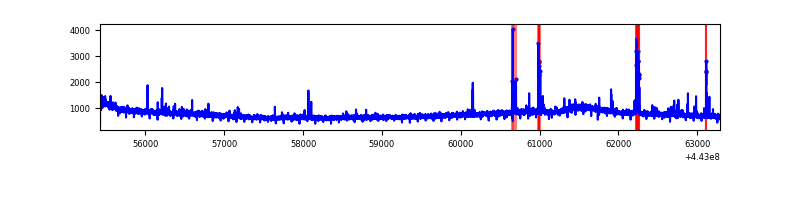 |
| B | 7863 | 7863 | 95 | 95 | 1.21% | 1.21% | 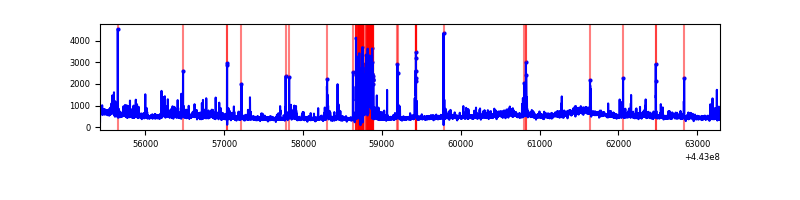 |
| C | 7863 | 7863 | 3 | 3 | 0.04% | 0.04% | 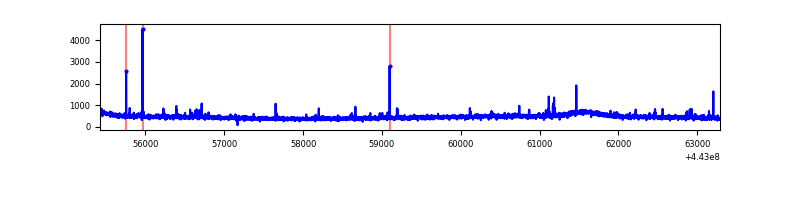 |
| D | 7863 | 7862 | 339 | 339 | 4.31% | 4.31% | 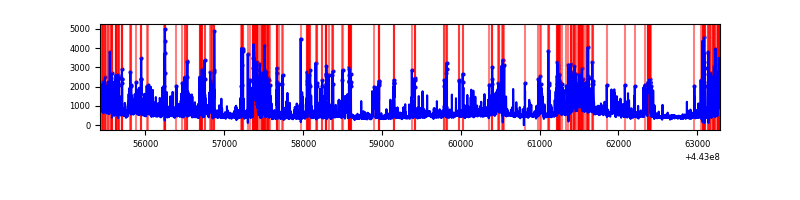 |
Top three noisy pixels from each quadrant. If the there are fewer than three noisy pixels in the level2.evt file, extra rows are filled as -1
| Pixel properties | Quadrant properties | ||||||
|---|---|---|---|---|---|---|---|
| Quadrant | DetID | PixID | Counts | Sigma | Mean | Median | Sigma |
| A | 10 | 83 | 2507677 | 13185.32 | 907 | 890 | 190.1 |
| A | 13 | 248 | 106370 | 554.81 | 907 | 890 | 190.1 |
| A | 10 | 248 | 70554 | 366.42 | 907 | 890 | 190.1 |
| B | 0 | 219 | 413988 | 2297.45 | 903 | 875 | 179.8 |
| B | 5 | 255 | 148486 | 820.91 | 903 | 875 | 179.8 |
| B | 0 | 155 | 94814 | 522.42 | 903 | 875 | 179.8 |
| C | 14 | 254 | 58370 | 271.05 | 896 | 901 | 212.0 |
| C | 3 | 233 | 13328 | 58.61 | 896 | 901 | 212.0 |
| C | 15 | 208 | 11873 | 51.75 | 896 | 901 | 212.0 |
| D | 1 | 52 | 1125304 | 5148.05 | 873 | 848 | 218.4 |
| D | 2 | 249 | 349917 | 1598.13 | 873 | 848 | 218.4 |
| D | 13 | 249 | 297836 | 1359.69 | 873 | 848 | 218.4 |
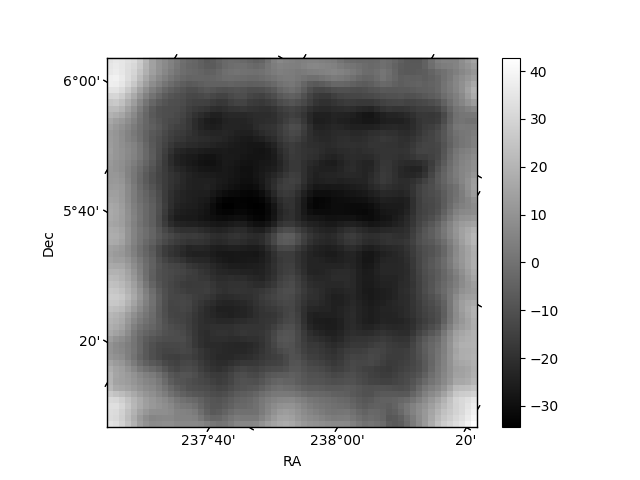
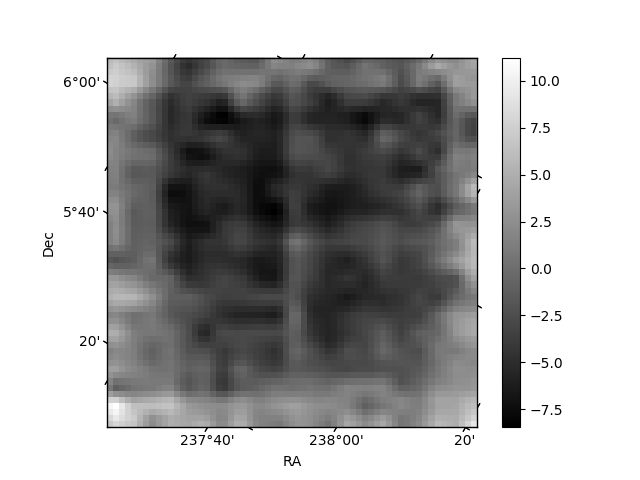
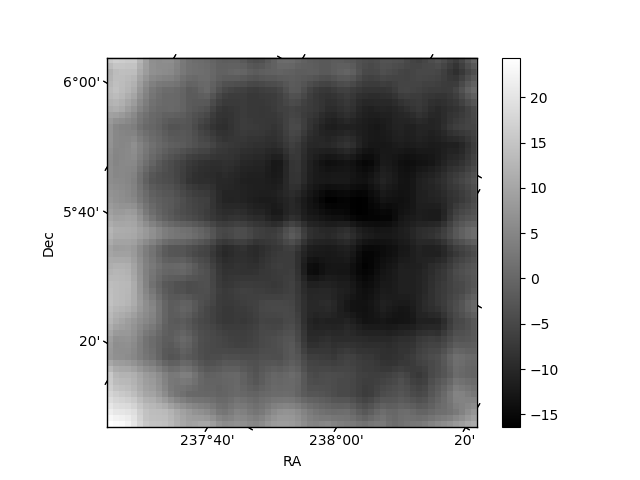
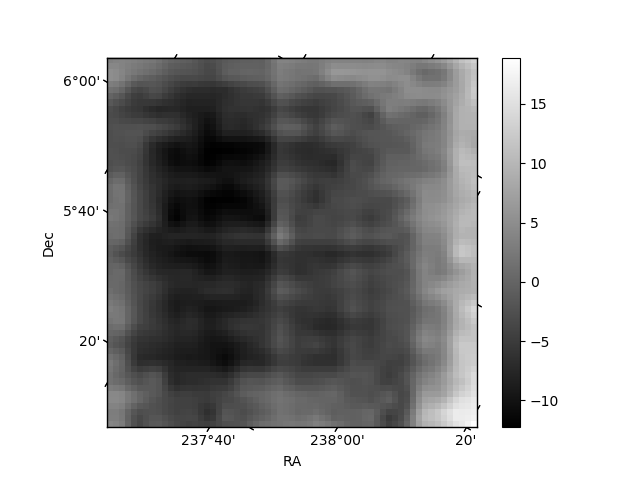
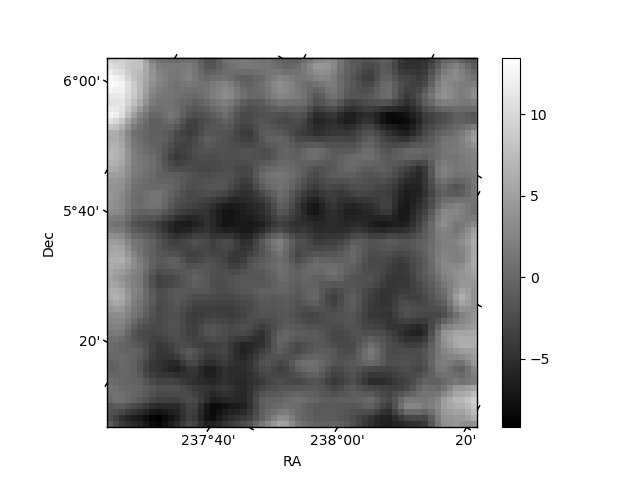
Histogram calculated using DETX and DETY for each event in the final _common_clean file
| Quadrant A | 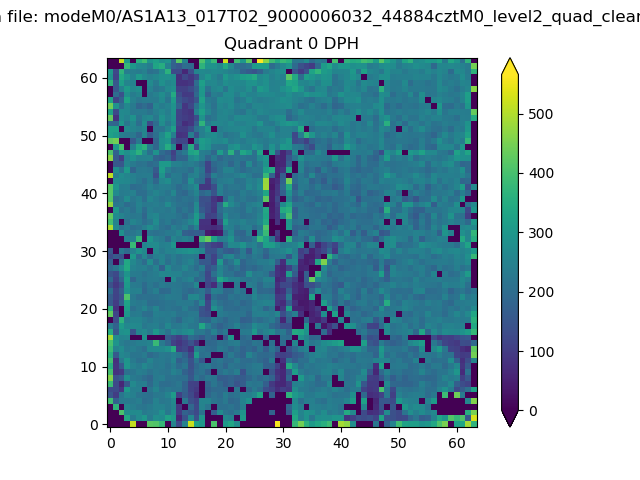 |
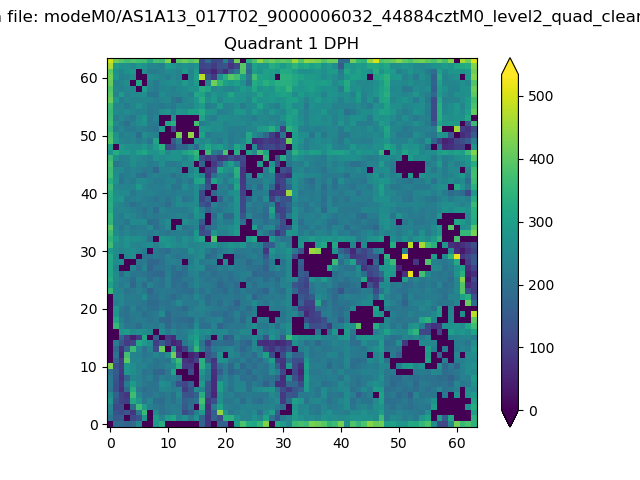 |
Quadrant B |
|---|---|---|---|
| Quadrant D | 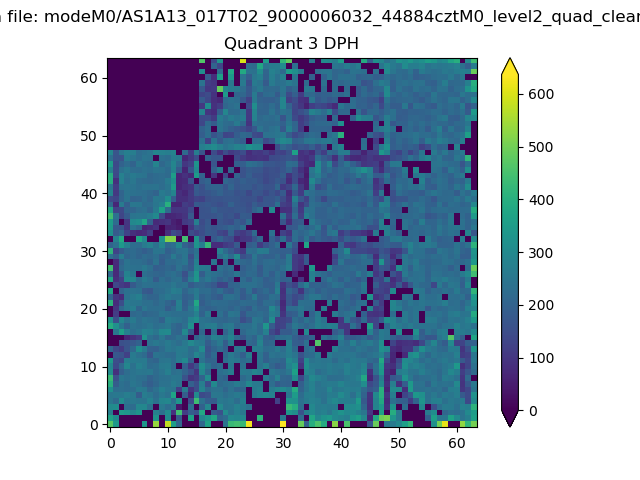 |
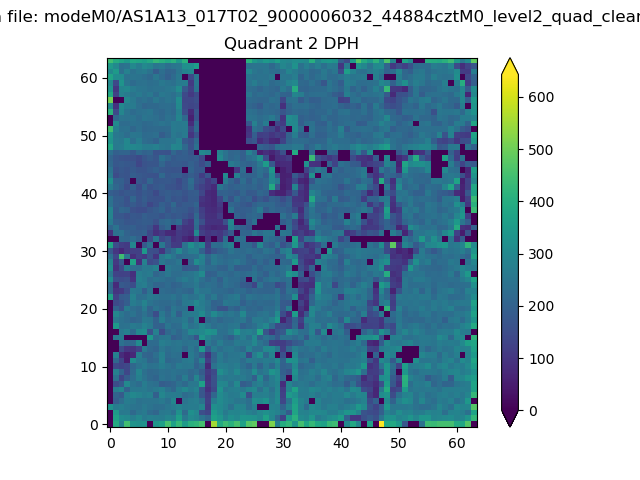 |
Quadrant C |
| Plot type | Count rate plots | Images |
|---|---|---|
| Comparison with Poisson distribution Blue bars denote a histogram of data divided into 1 sec bins. Red curve is a Poisson curve with rate = median count rate of data. |
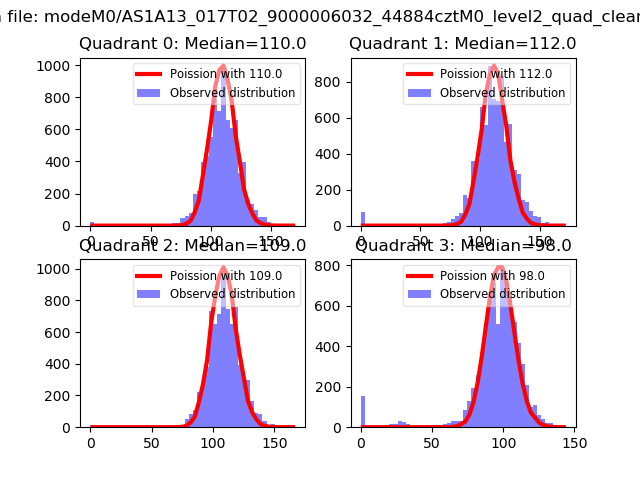 |
 |
| Quadrant-wise count rates Data is divided into 100 sec bins |
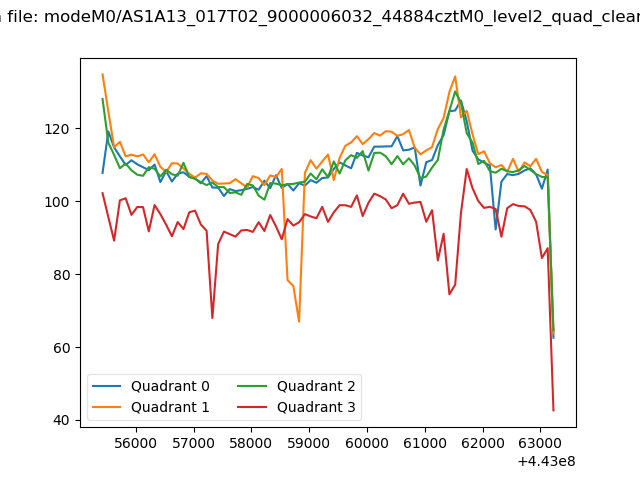 |
|
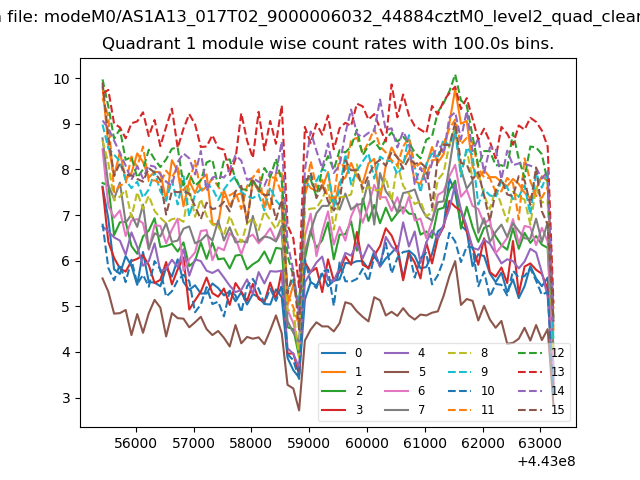
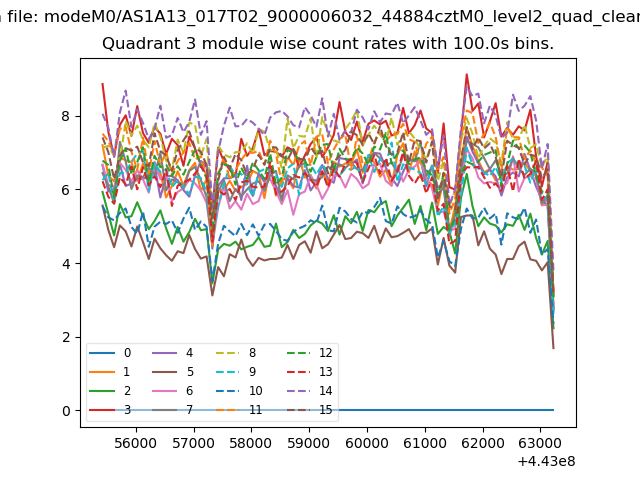
| Module-wise count rates for Quadrant A Data is divided into 100 sec bins |
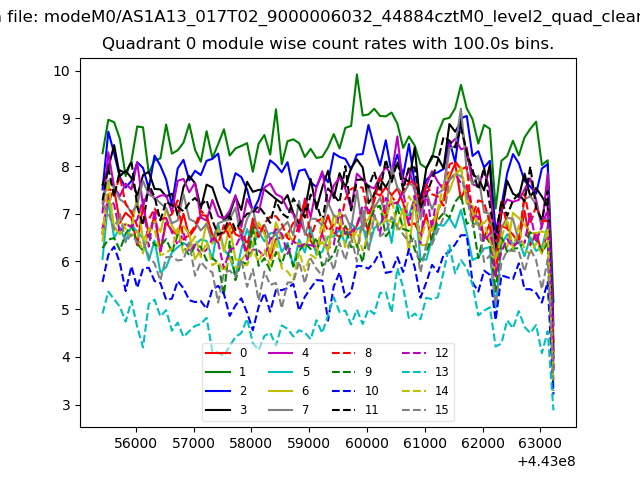 |
 |
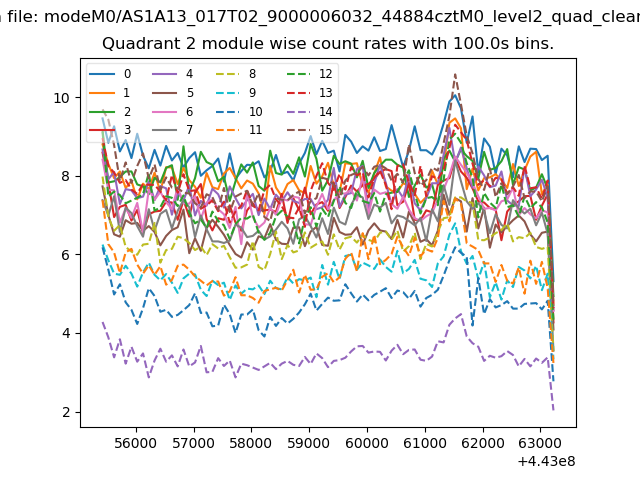
| Module-wise count rates for Quadrant B Data is divided into 100 sec bins |
 |
 |
| Module-wise count rates for Quadrant C Data is divided into 100 sec bins |
 |
 |
| Module-wise count rates for Quadrant D Data is divided into 100 sec bins |
 |
 |
| Parameter | Plot |
|---|---|
| CZT HV Monitor | 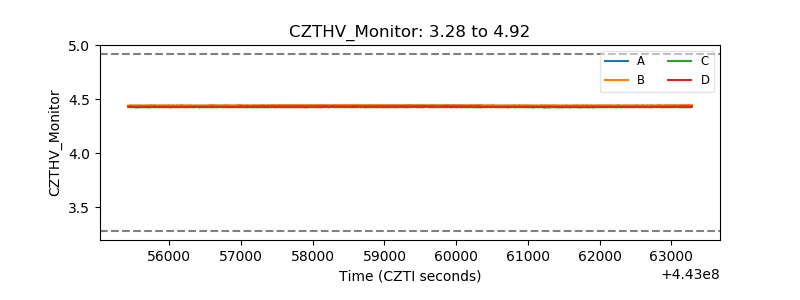 |
| D_VDD | 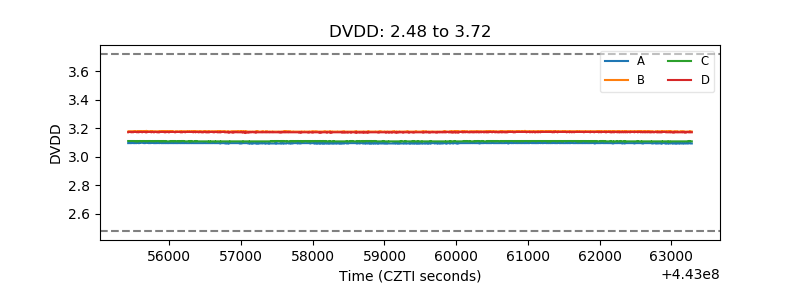 |
| Temperature 1 | 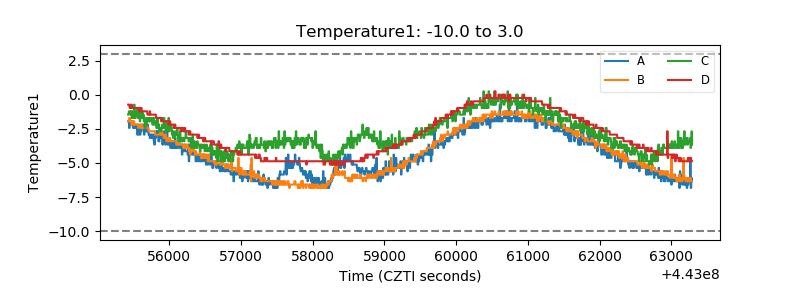 |
| Veto HV Monitor |  |
| Veto LLD | 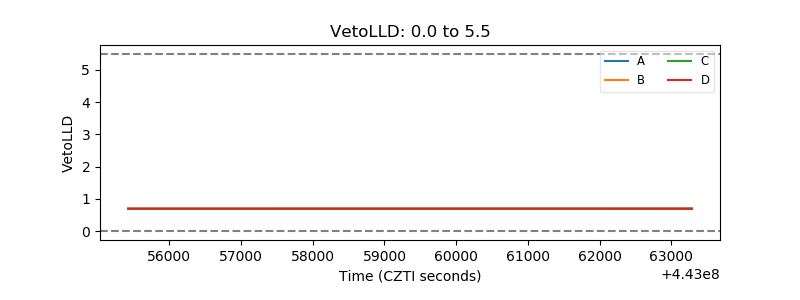 |
| Alpha Counter | 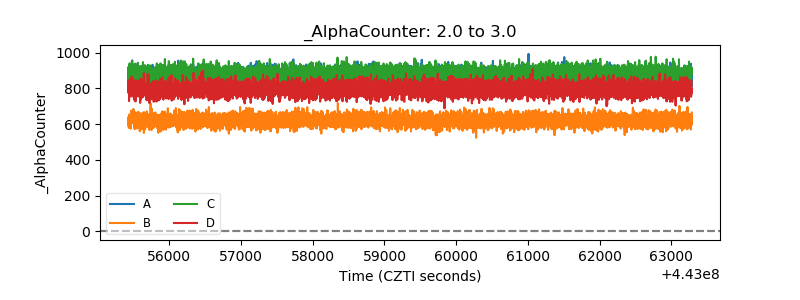 |
| _CPM_Rate | 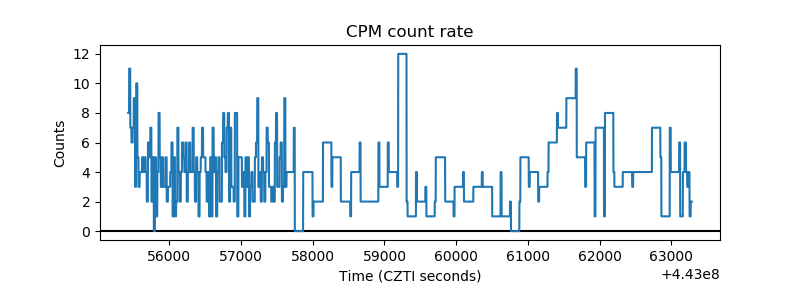 |
| CZT Counter | 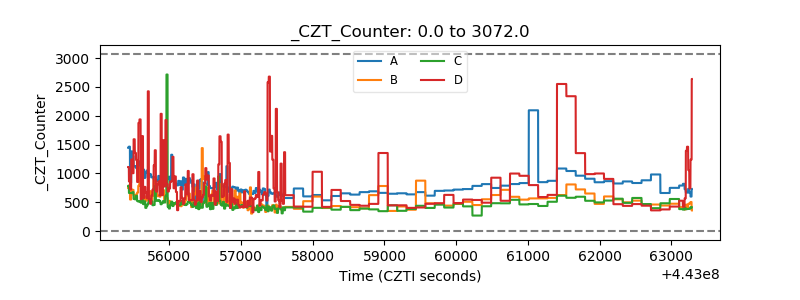 |
| +2.5 Volts monitor | 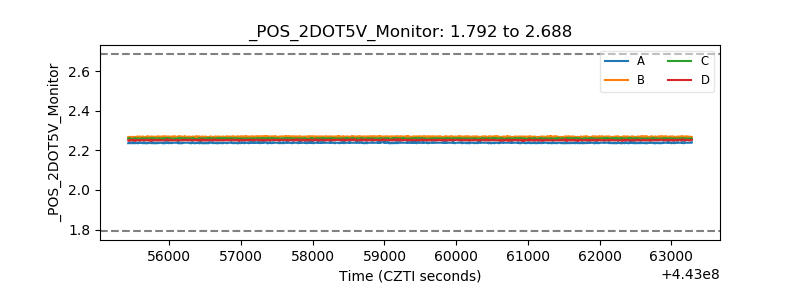 |
| +5 Volts monitor | 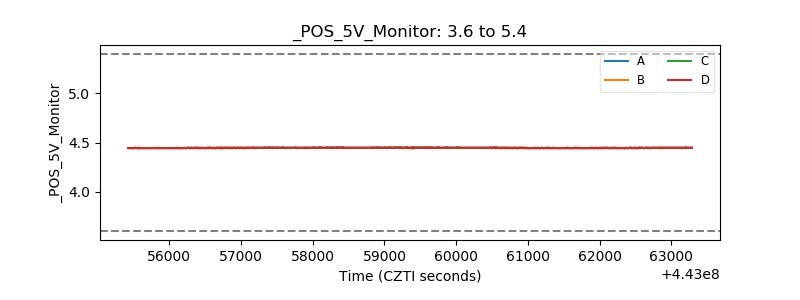 |
| _ROLL_ROT | 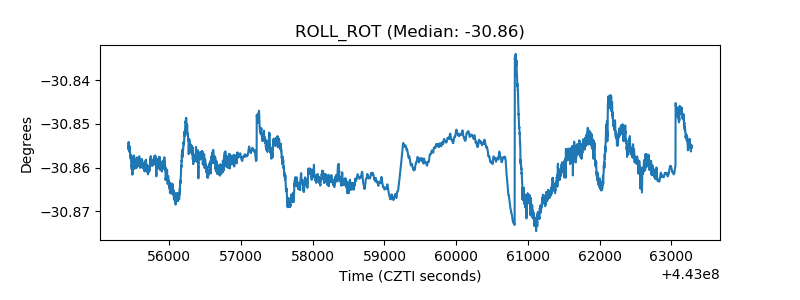 |
| _Roll_DEC | 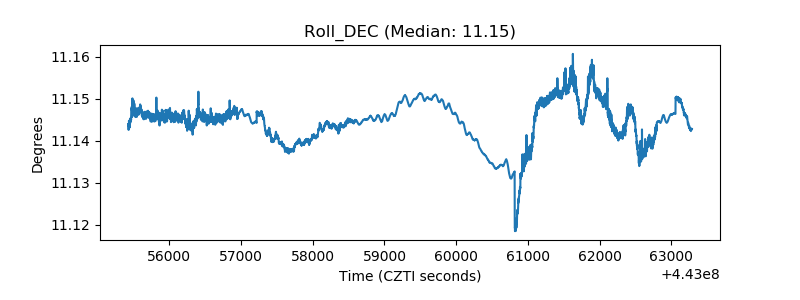 |
| _Roll_RA | 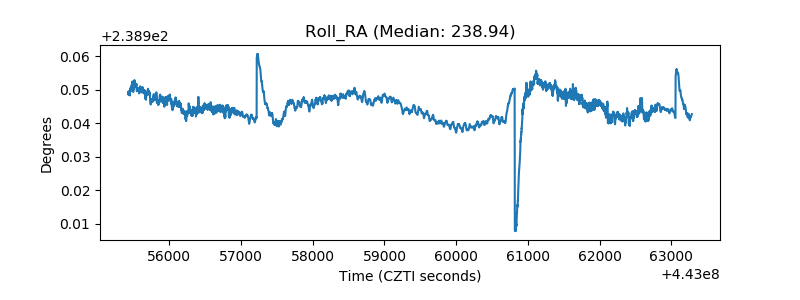 |
| Veto Counter | 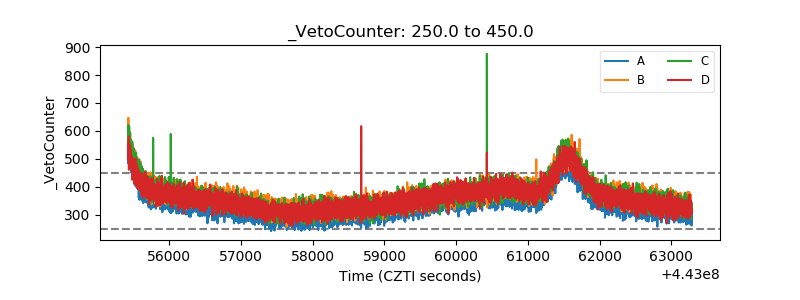 |