| Param | Original file | Final file |
|---|---|---|
| Filename | modeM0/AS1A13_017T02_9000006032_44888cztM0_level2.fits | modeM0/AS1A13_017T02_9000006032_44888cztM0_level2_quad_clean.evt |
| Size (bytes) | 1,971,308,160 | 418,196,160 |
| Size | 1.8 GB | 398.8 MB |
| Events in quadrant A | 20,089,294 | 2,793,942 |
| Events in quadrant B | 13,630,242 | 2,880,675 |
| Events in quadrant C | 11,841,845 | 2,811,254 |
| Events in quadrant D | 25,387,160 | 2,373,186 |
| Mode SS | |||
|---|---|---|---|
| Quadrant | BADHDUFLAG | Total packets | Discarded packets |
| A | 0 | 526 | 0 |
| B | 0 | 526 | 0 |
| C | 0 | 526 | 0 |
| D | 0 | 526 | 0 |
| Mode M0 | |||
|---|---|---|---|
| Quadrant | BADHDUFLAG | Total packets | Discarded packets |
| A | 0 | 80737 | 3 |
| B | 0 | 58792 | 13 |
| C | 0 | 54568 | 6 |
| D | 0 | 93803 | 9 |
| Mode M9 | |||
|---|---|---|---|
| Quadrant | BADHDUFLAG | Total packets | Discarded packets |
| A | 0 | 12 | 0 |
| B | 0 | 12 | 0 |
| C | 0 | 12 | 0 |
| D | 0 | 12 | 0 |
| Quadrant | Total seconds | Saturated seconds | Saturation percentage |
|---|---|---|---|
| A | 26211 | 524 | 1.999161% |
| B | 26205 | 572 | 2.182790% |
| C | 26209 | 83 | 0.316685% |
| D | 26210 | 2687 | 10.251812% |
Noise dominated data is calculated using 1-second bins in cleaned event files. If a bin has >2000 counts, and if more than 50% of those come from <1% of pixels, then it is considered to be noise-dominated and hence unusable.
| Quadrant | # 1 sec bins | Bins with >0 counts | Bins with >2000 counts | High rate bins dominated by noise | Noise dominated (total time) | Noise dominated (detector-on time) | Marked lightcurve |
|---|---|---|---|---|---|---|---|
| A | 27336 | 26214 | 56 | 56 | 0.20% | 0.21% | 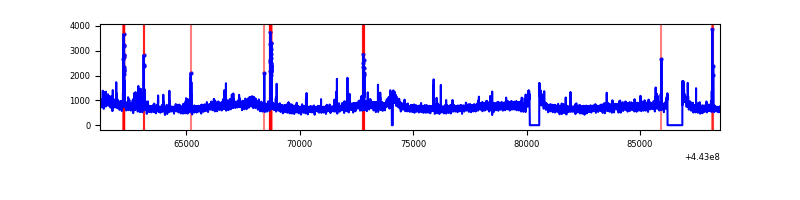 |
| B | 27336 | 26212 | 131 | 131 | 0.48% | 0.50% | 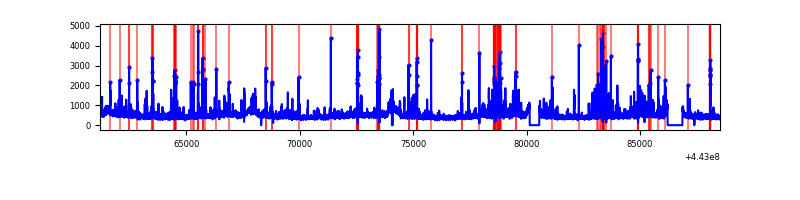 |
| C | 27336 | 26213 | 11 | 11 | 0.04% | 0.04% | 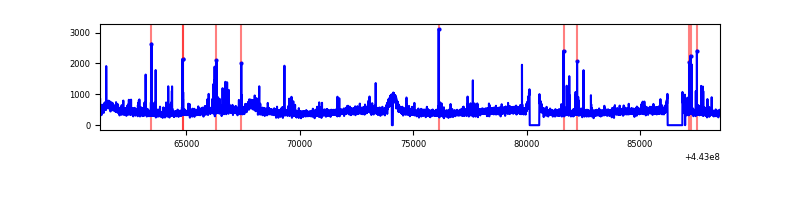 |
| D | 27336 | 26214 | 1895 | 1895 | 6.93% | 7.23% | 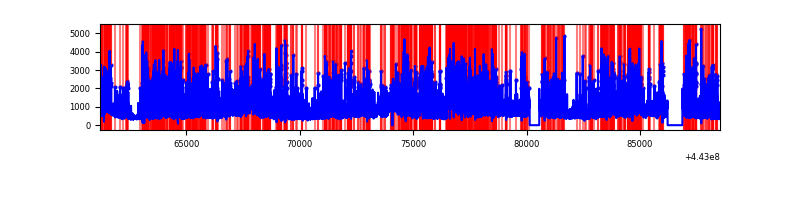 |
Top three noisy pixels from each quadrant. If the there are fewer than three noisy pixels in the level2.evt file, extra rows are filled as -1
| Pixel properties | Quadrant properties | ||||||
|---|---|---|---|---|---|---|---|
| Quadrant | DetID | PixID | Counts | Sigma | Mean | Median | Sigma |
| A | 10 | 83 | 8092402 | 12984.95 | 2991 | 2925 | 623.0 |
| A | 13 | 248 | 154632 | 243.51 | 2991 | 2925 | 623.0 |
| A | 10 | 248 | 140909 | 221.49 | 2991 | 2925 | 623.0 |
| B | 5 | 255 | 589135 | 989.56 | 2986 | 2890 | 592.4 |
| B | 0 | 219 | 329267 | 550.91 | 2986 | 2890 | 592.4 |
| B | 0 | 190 | 192223 | 319.59 | 2986 | 2890 | 592.4 |
| C | 14 | 254 | 128500 | 181.04 | 2946 | 2963 | 693.4 |
| C | 2 | 14 | 91284 | 127.37 | 2946 | 2963 | 693.4 |
| C | 3 | 233 | 62350 | 85.64 | 2946 | 2963 | 693.4 |
| D | 1 | 52 | 6320624 | 8757.26 | 2842 | 2758 | 721.4 |
| D | 13 | 174 | 1765666 | 2443.59 | 2842 | 2758 | 721.4 |
| D | 2 | 249 | 1520585 | 2103.88 | 2842 | 2758 | 721.4 |
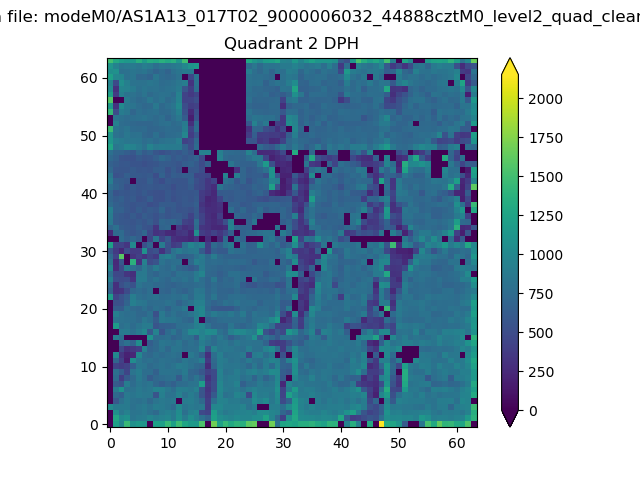
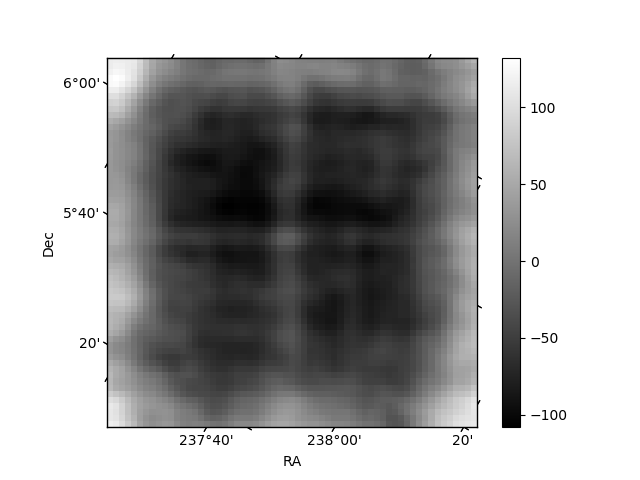
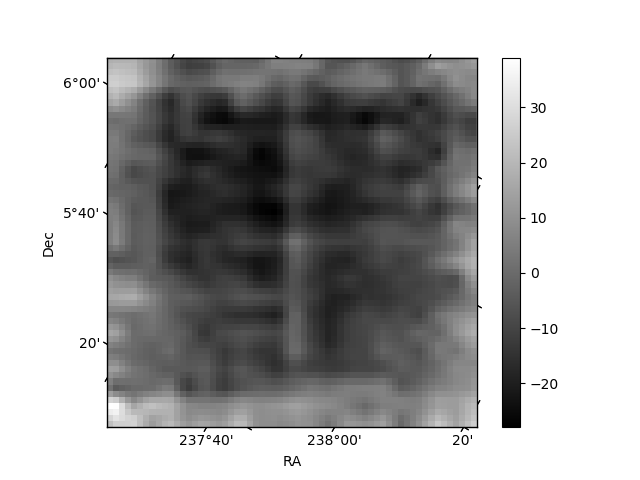
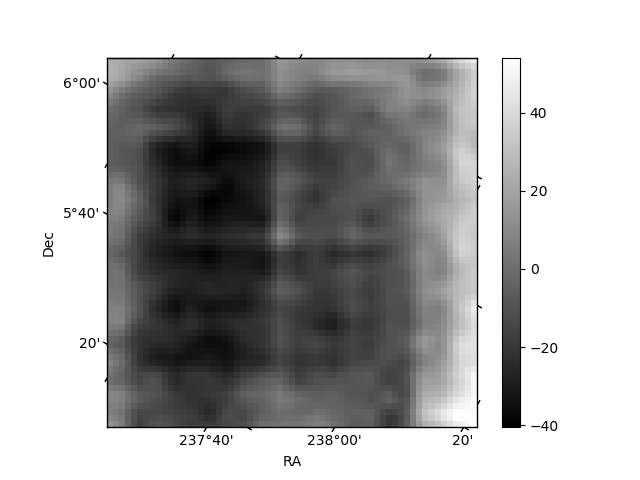
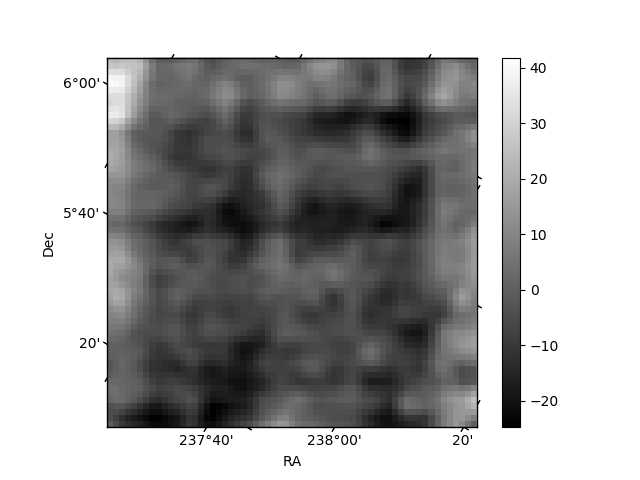
Histogram calculated using DETX and DETY for each event in the final _common_clean file
| Quadrant A | 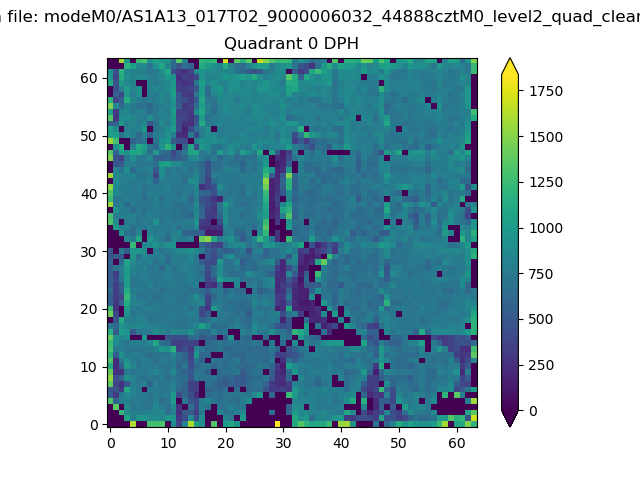 |
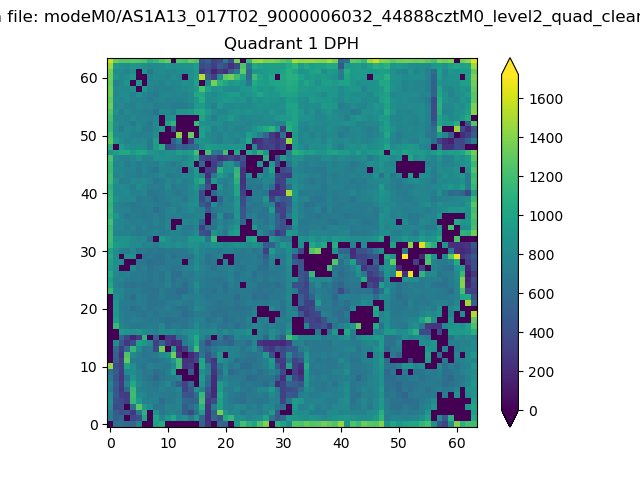 |
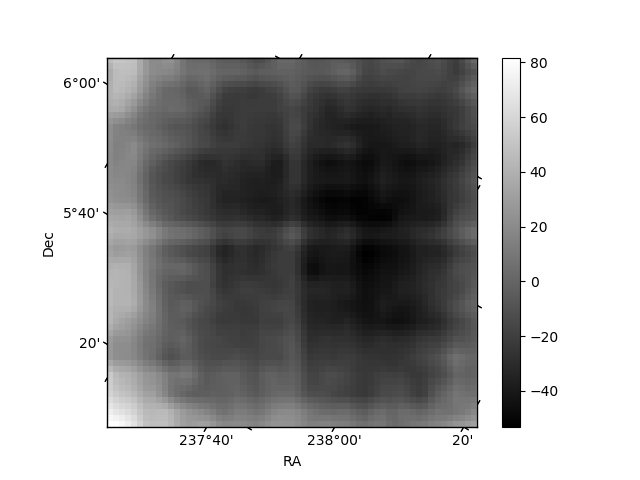
Quadrant B |
|---|---|---|---|
| Quadrant D | 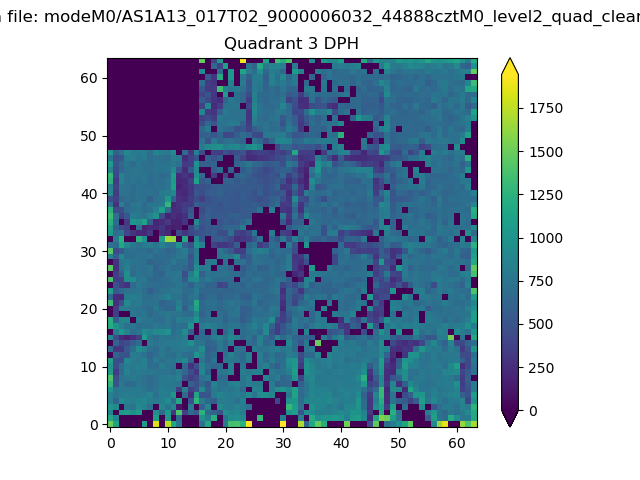 |
 |
Quadrant C |
| Plot type | Count rate plots | Images |
|---|---|---|
| Comparison with Poisson distribution Blue bars denote a histogram of data divided into 1 sec bins. Red curve is a Poisson curve with rate = median count rate of data. |
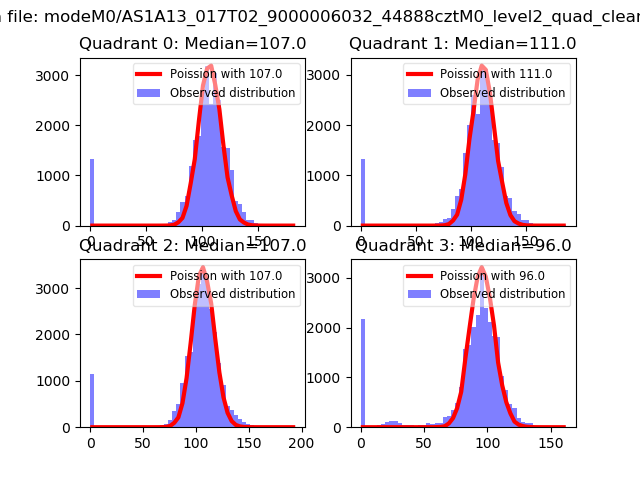 |
 |
| Quadrant-wise count rates Data is divided into 100 sec bins |
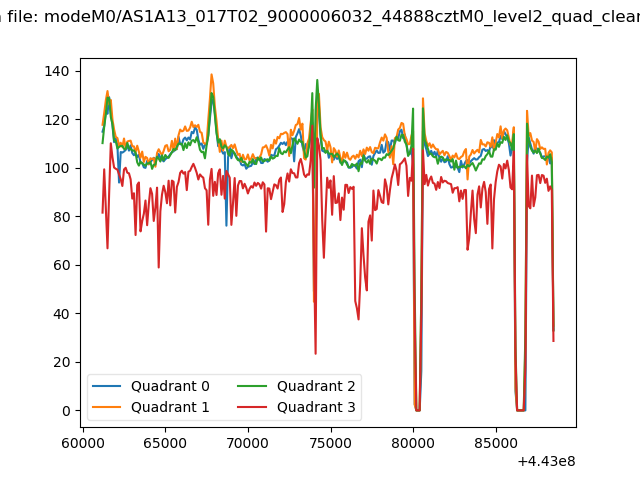 |
|
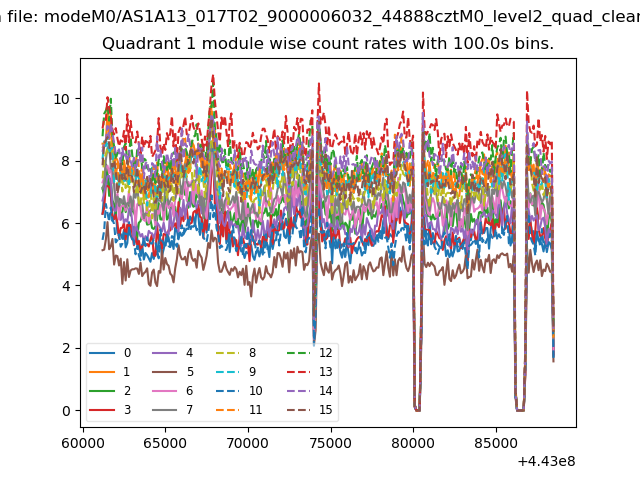
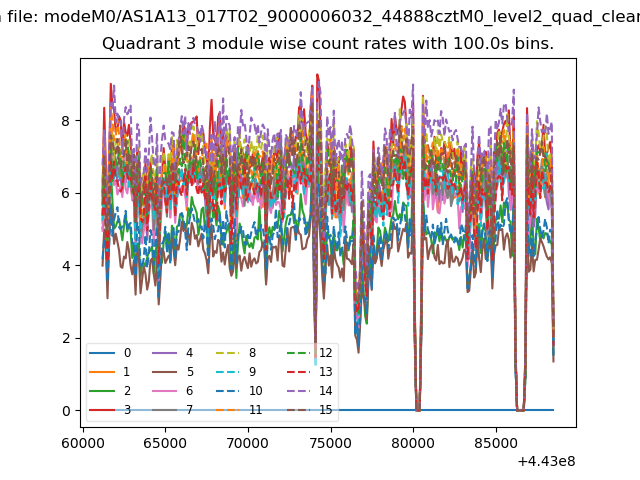
| Module-wise count rates for Quadrant A Data is divided into 100 sec bins |
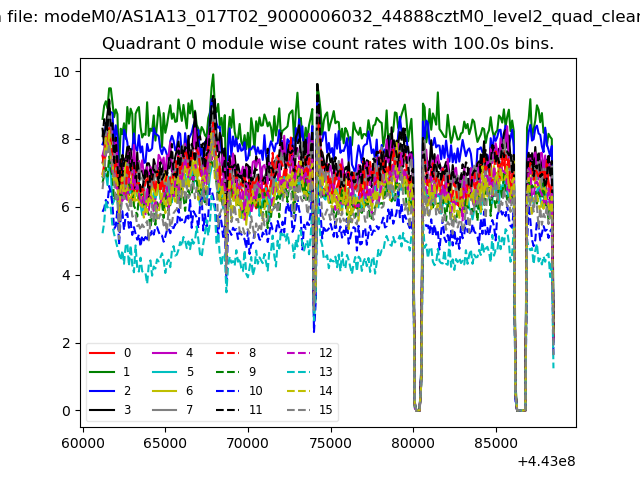 |
 |
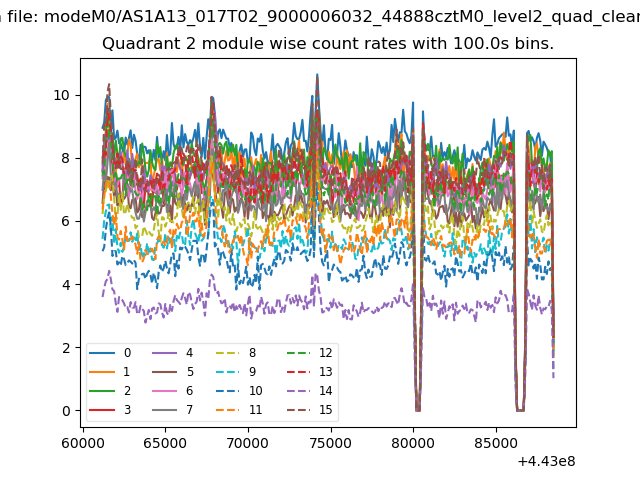
| Module-wise count rates for Quadrant B Data is divided into 100 sec bins |
 |
 |
| Module-wise count rates for Quadrant C Data is divided into 100 sec bins |
 |
 |
| Module-wise count rates for Quadrant D Data is divided into 100 sec bins |
 |
 |
| Parameter | Plot |
|---|---|
| CZT HV Monitor | 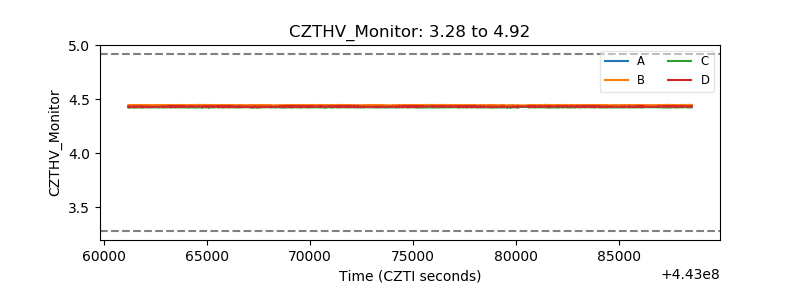 |
| D_VDD | 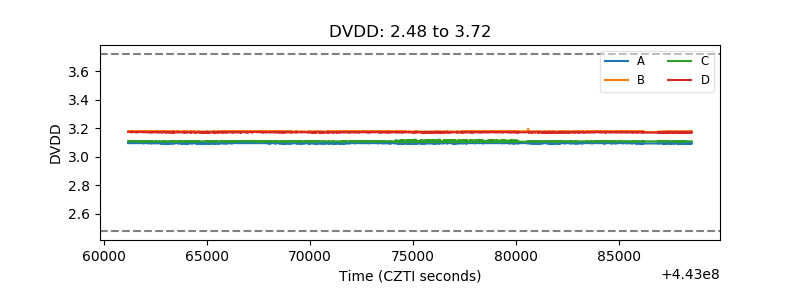 |
| Temperature 1 | 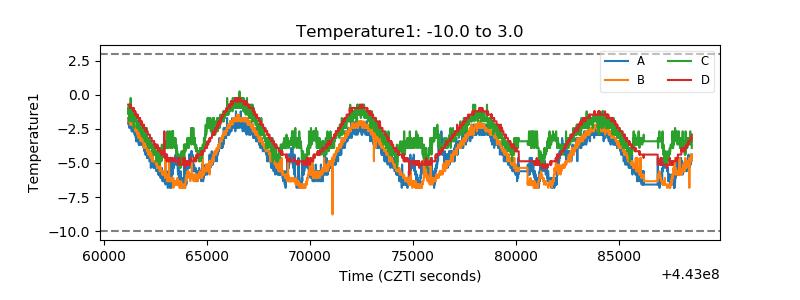 |
| Veto HV Monitor | 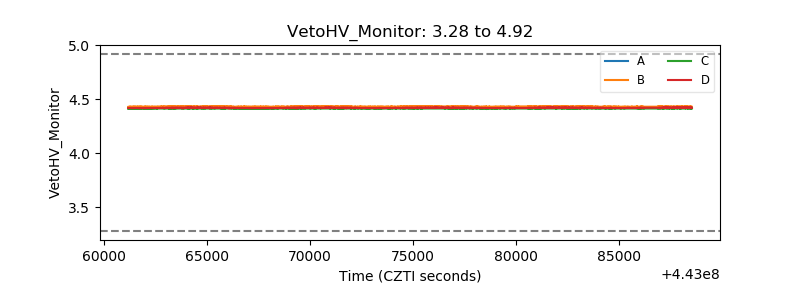 |
| Veto LLD |  |
| Alpha Counter |  |
| _CPM_Rate | 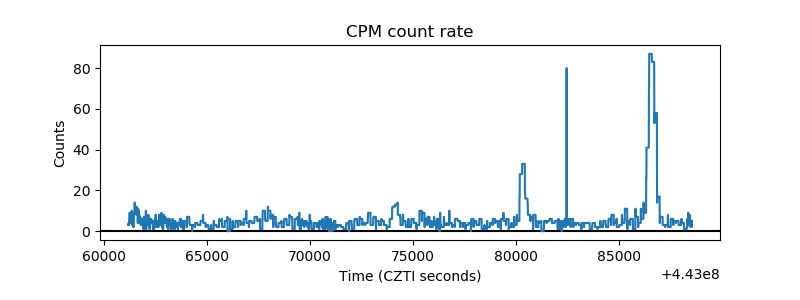 |
| CZT Counter | 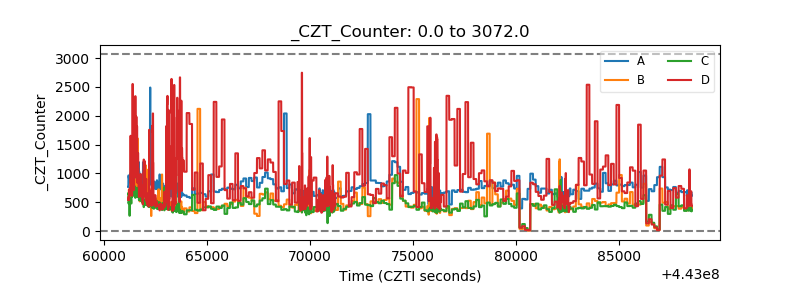 |
| +2.5 Volts monitor | 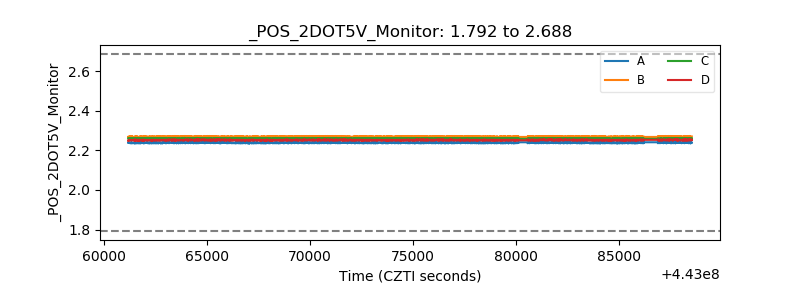 |
| +5 Volts monitor |  |
| _ROLL_ROT | 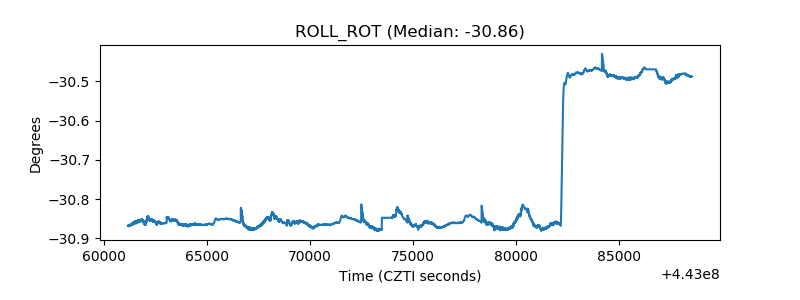 |
| _Roll_DEC | 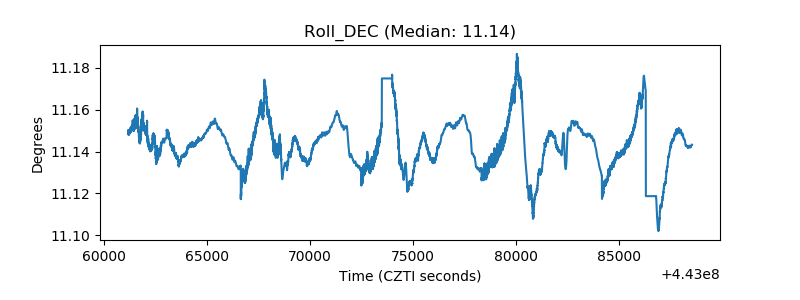 |
| _Roll_RA | 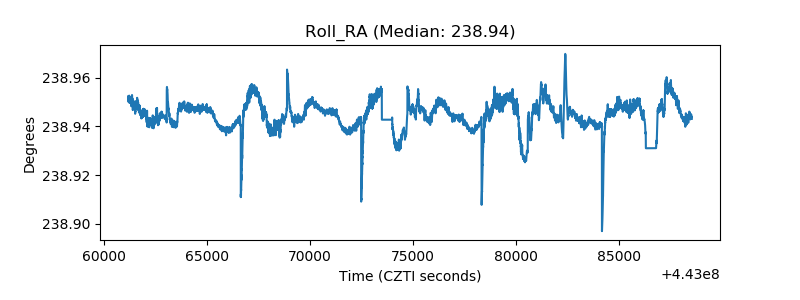 |
| Veto Counter | 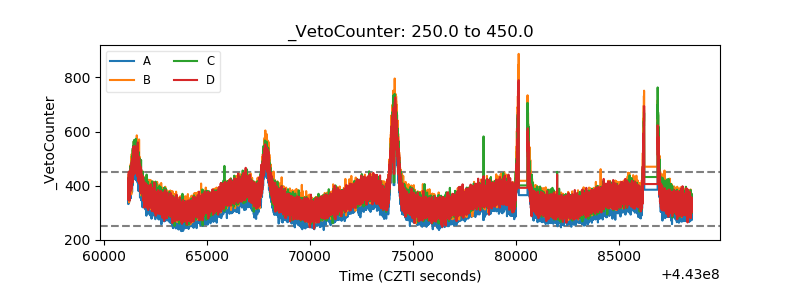 |