| Param | Original file | Final file |
|---|---|---|
| Filename | modeM0/AS1A13_017T02_9000006032_44889cztM0_level2.fits | modeM0/AS1A13_017T02_9000006032_44889cztM0_level2_quad_clean.evt |
| Size (bytes) | 449,377,920 | 99,023,040 |
| Size | 428.6 MB | 94.4 MB |
| Events in quadrant A | 4,708,953 | 658,358 |
| Events in quadrant B | 3,014,011 | 683,056 |
| Events in quadrant C | 2,755,057 | 660,598 |
| Events in quadrant D | 5,670,796 | 559,362 |
| Mode SS | |||
|---|---|---|---|
| Quadrant | BADHDUFLAG | Total packets | Discarded packets |
| A | 0 | 128 | 0 |
| B | 0 | 128 | 0 |
| C | 0 | 128 | 0 |
| D | 0 | 128 | 0 |
| Mode M0 | |||
|---|---|---|---|
| Quadrant | BADHDUFLAG | Total packets | Discarded packets |
| A | 0 | 19159 | 1 |
| B | 0 | 13205 | 1 |
| C | 0 | 12825 | 1 |
| D | 0 | 21123 | 1 |
| Mode M9 | |||
|---|---|---|---|
| Quadrant | BADHDUFLAG | Total packets | Discarded packets |
| A | 0 | 8 | 0 |
| B | 0 | 8 | 0 |
| C | 0 | 8 | 0 |
| D | 0 | 8 | 0 |
| Quadrant | Total seconds | Saturated seconds | Saturation percentage |
|---|---|---|---|
| A | 6253 | 109 | 1.743163% |
| B | 6254 | 97 | 1.551007% |
| C | 6253 | 42 | 0.671678% |
| D | 6253 | 607 | 9.707340% |
Noise dominated data is calculated using 1-second bins in cleaned event files. If a bin has >2000 counts, and if more than 50% of those come from <1% of pixels, then it is considered to be noise-dominated and hence unusable.
| Quadrant | # 1 sec bins | Bins with >0 counts | Bins with >2000 counts | High rate bins dominated by noise | Noise dominated (total time) | Noise dominated (detector-on time) | Marked lightcurve |
|---|---|---|---|---|---|---|---|
| A | 7088 | 6254 | 8 | 8 | 0.11% | 0.13% | 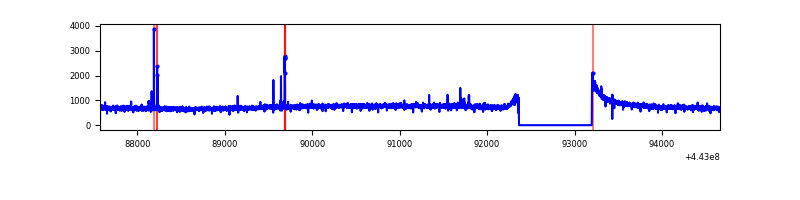 |
| B | 7089 | 6255 | 33 | 33 | 0.47% | 0.53% | 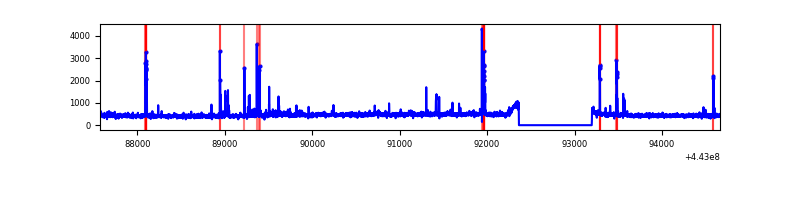 |
| C | 7088 | 6254 | 9 | 9 | 0.13% | 0.14% | 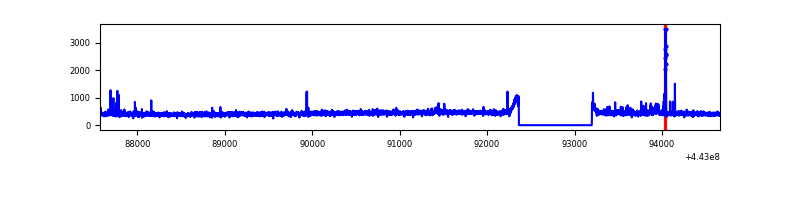 |
| D | 7088 | 6254 | 461 | 461 | 6.50% | 7.37% | 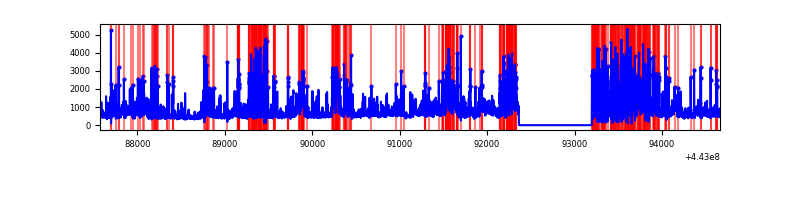 |
Top three noisy pixels from each quadrant. If the there are fewer than three noisy pixels in the level2.evt file, extra rows are filled as -1
| Pixel properties | Quadrant properties | ||||||
|---|---|---|---|---|---|---|---|
| Quadrant | DetID | PixID | Counts | Sigma | Mean | Median | Sigma |
| A | 10 | 83 | 1964643 | 13542.99 | 693 | 680 | 145.0 |
| A | 7 | 3 | 30005 | 202.22 | 693 | 680 | 145.0 |
| A | 10 | 248 | 21017 | 140.24 | 693 | 680 | 145.0 |
| B | 5 | 255 | 123366 | 883.34 | 691 | 668 | 138.9 |
| B | 0 | 219 | 47330 | 335.93 | 691 | 668 | 138.9 |
| B | 0 | 183 | 45422 | 322.19 | 691 | 668 | 138.9 |
| C | 14 | 254 | 47624 | 289.52 | 683 | 687 | 162.1 |
| C | 9 | 54 | 18519 | 109.99 | 683 | 687 | 162.1 |
| C | 1 | 3 | 11351 | 65.78 | 683 | 687 | 162.1 |
| D | 1 | 52 | 860762 | 5244.35 | 651 | 630 | 164.0 |
| D | 2 | 249 | 774082 | 4715.85 | 651 | 630 | 164.0 |
| D | 13 | 174 | 457027 | 2782.72 | 651 | 630 | 164.0 |
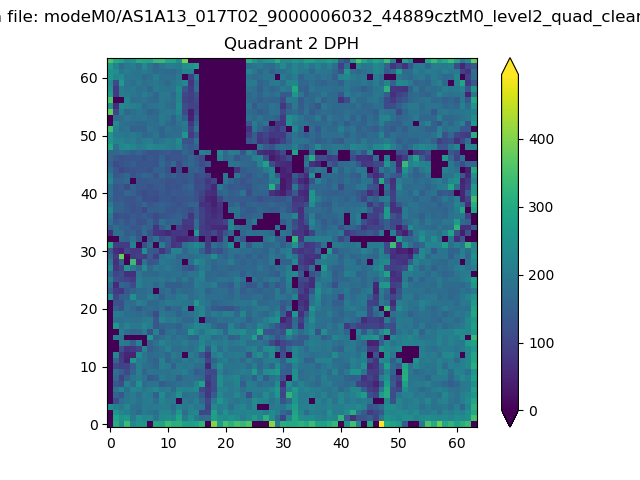
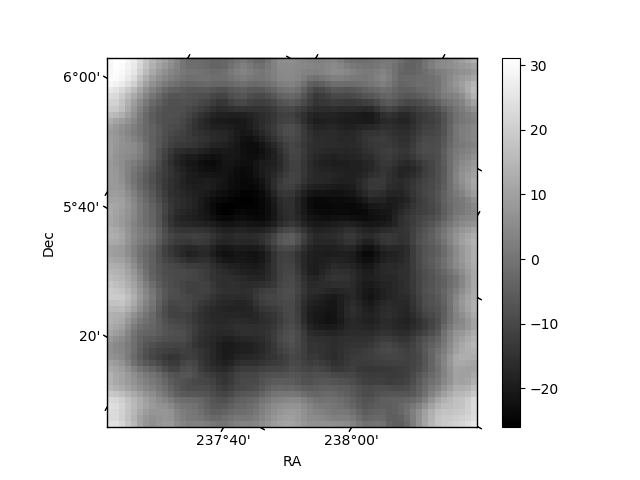
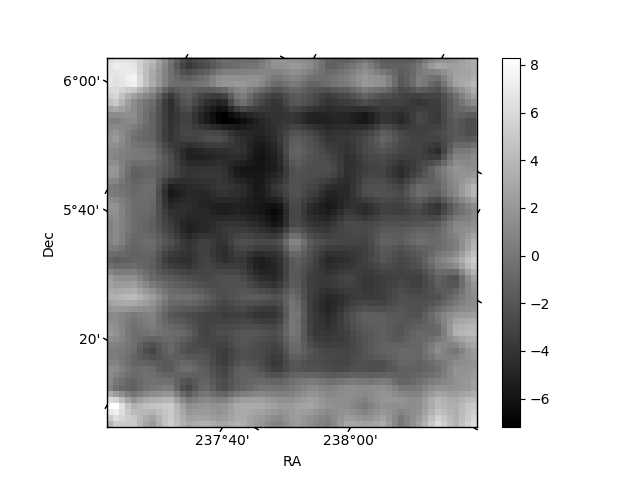
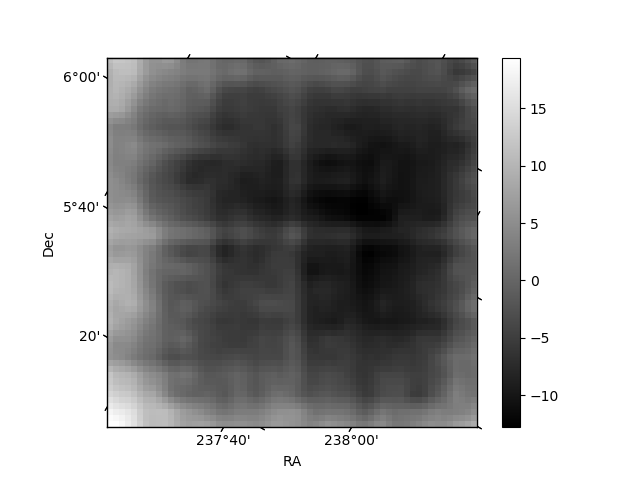
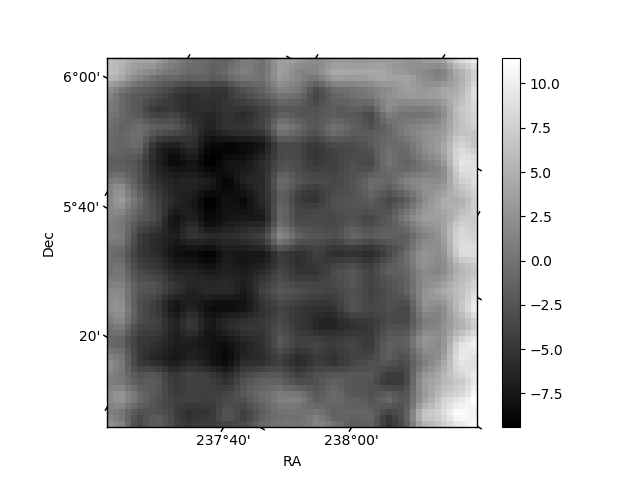
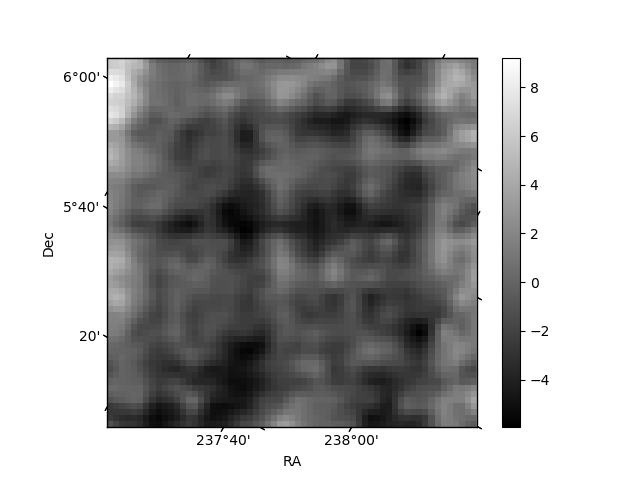
Histogram calculated using DETX and DETY for each event in the final _common_clean file
| Quadrant A | 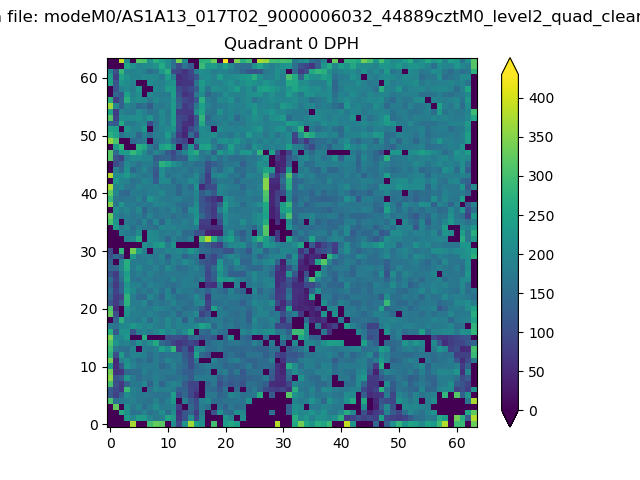 |
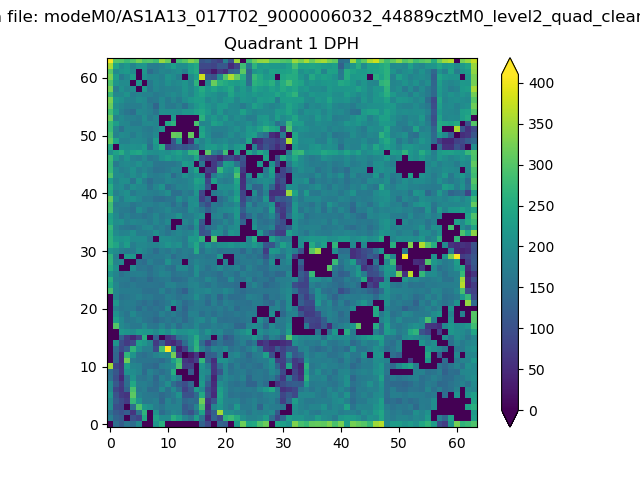 |
Quadrant B |
|---|---|---|---|
| Quadrant D | 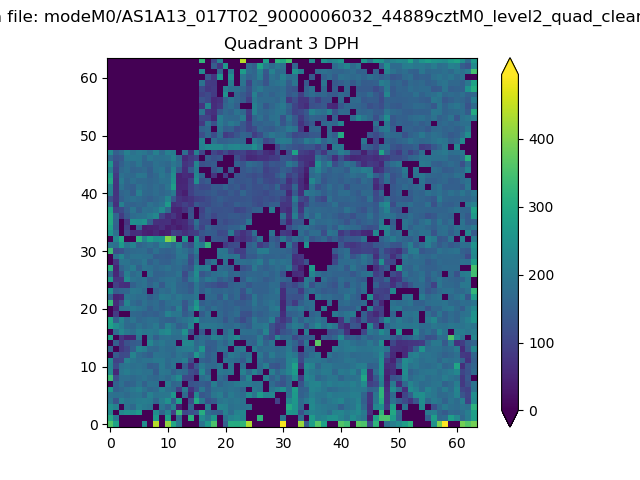 |
 |
Quadrant C |
| Plot type | Count rate plots | Images |
|---|---|---|
| Comparison with Poisson distribution Blue bars denote a histogram of data divided into 1 sec bins. Red curve is a Poisson curve with rate = median count rate of data. |
 |
 |
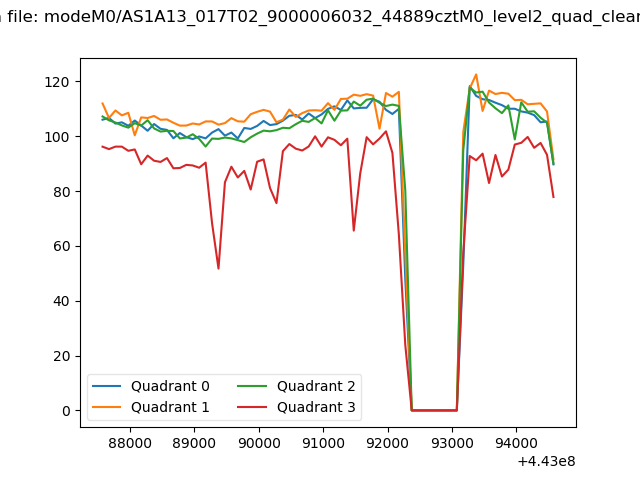
| Quadrant-wise count rates Data is divided into 100 sec bins |
 |
|
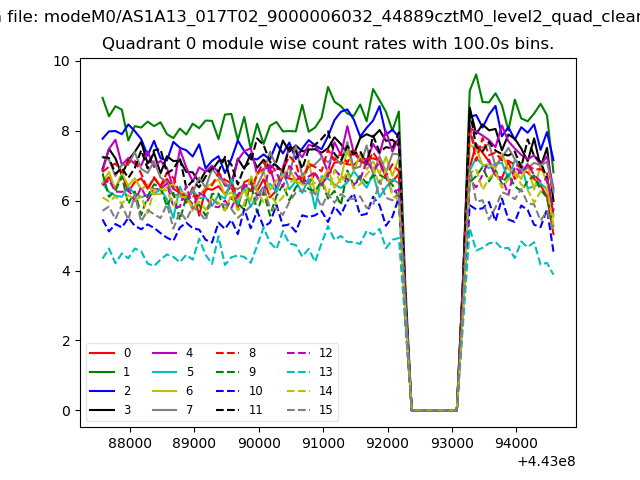
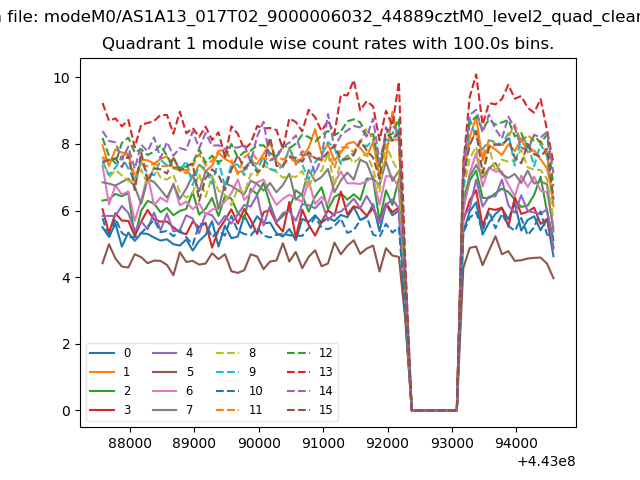
| Module-wise count rates for Quadrant A Data is divided into 100 sec bins |
 |
 |
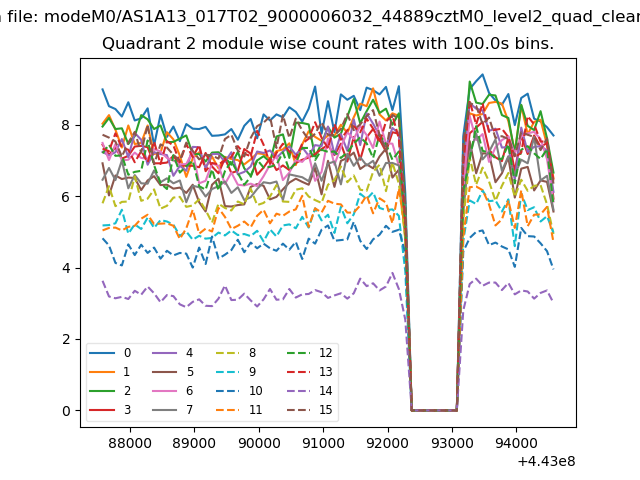
| Module-wise count rates for Quadrant B Data is divided into 100 sec bins |
 |
 |
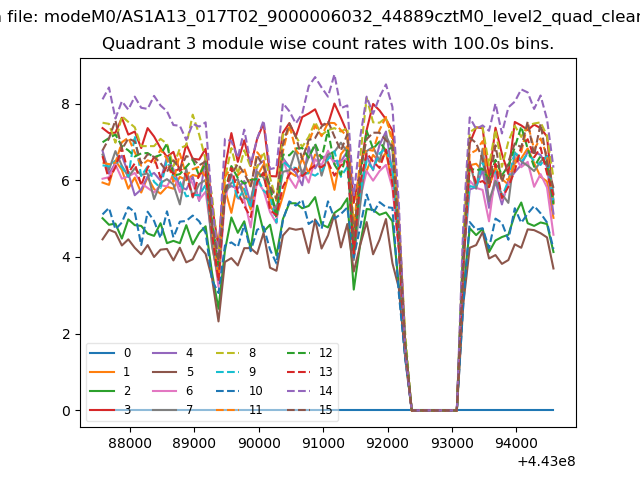
| Module-wise count rates for Quadrant C Data is divided into 100 sec bins |
 |
 |
| Module-wise count rates for Quadrant D Data is divided into 100 sec bins |
 |
 |
| Parameter | Plot |
|---|---|
| CZT HV Monitor | 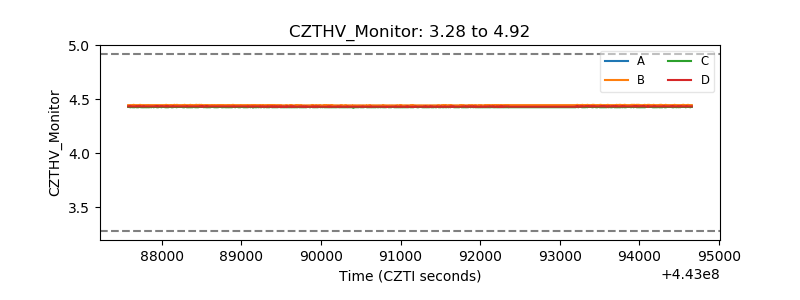 |
| D_VDD | 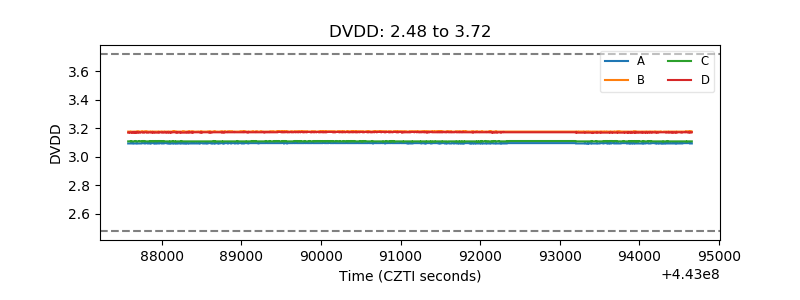 |
| Temperature 1 | 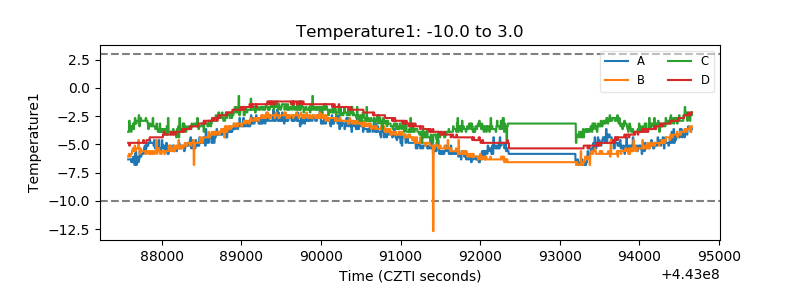 |
| Veto HV Monitor | 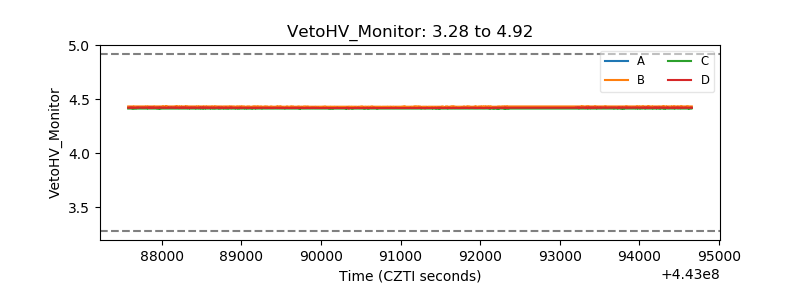 |
| Veto LLD | 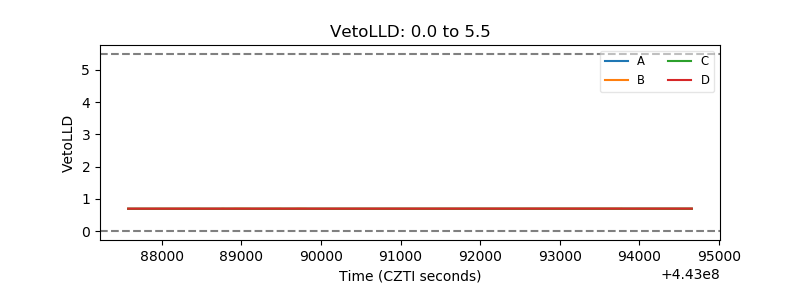 |
| Alpha Counter | 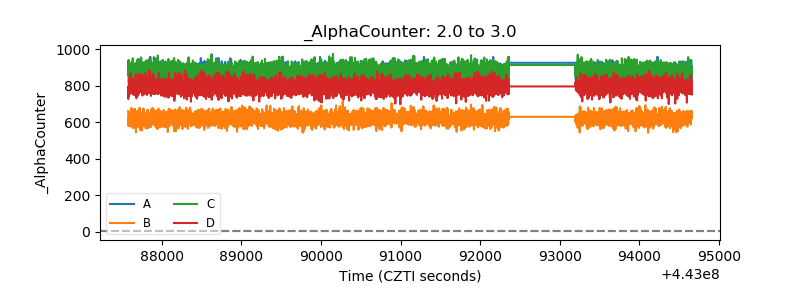 |
| _CPM_Rate | 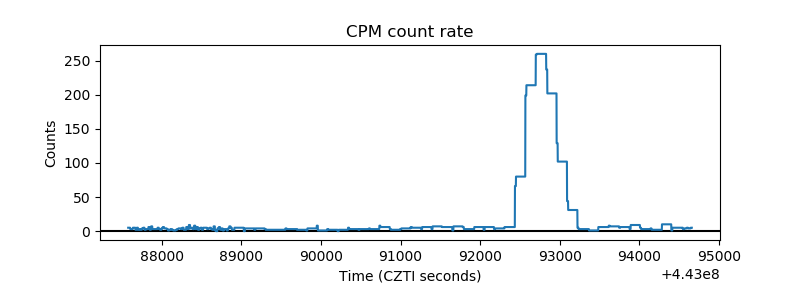 |
| CZT Counter | 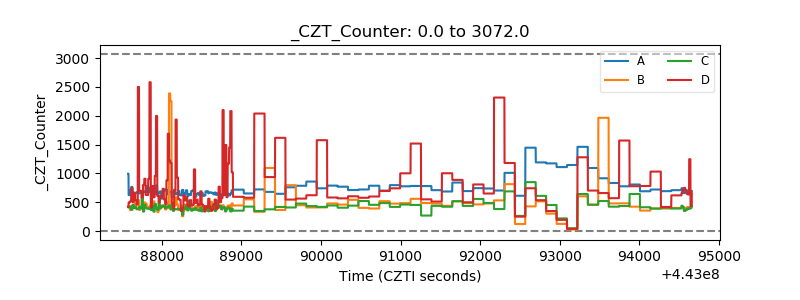 |
| +2.5 Volts monitor | 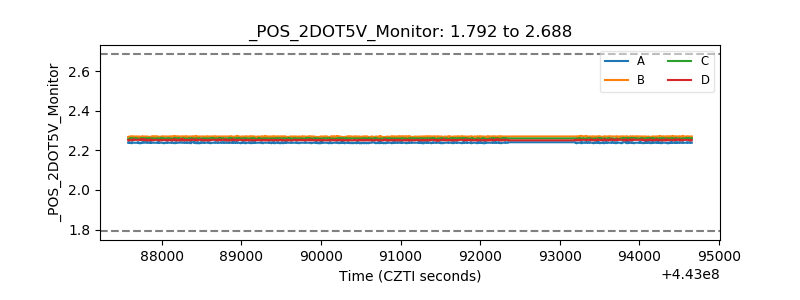 |
| +5 Volts monitor | 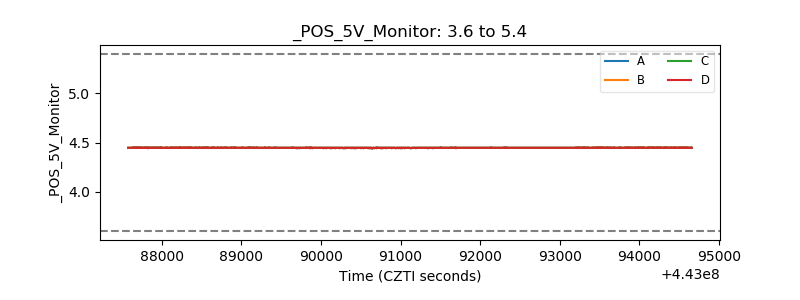 |
| _ROLL_ROT | 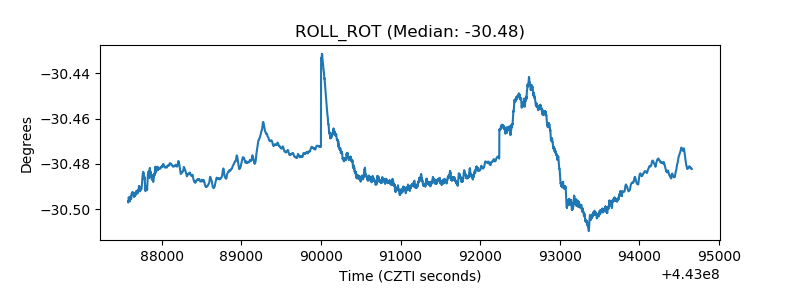 |
| _Roll_DEC | 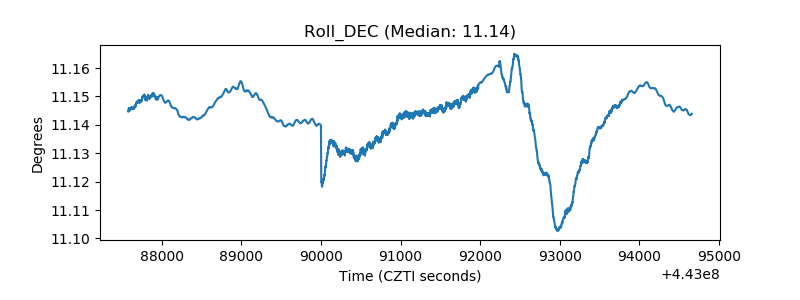 |
| _Roll_RA | 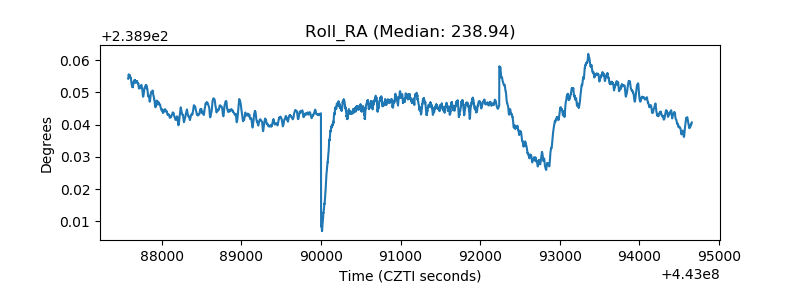 |
| Veto Counter | 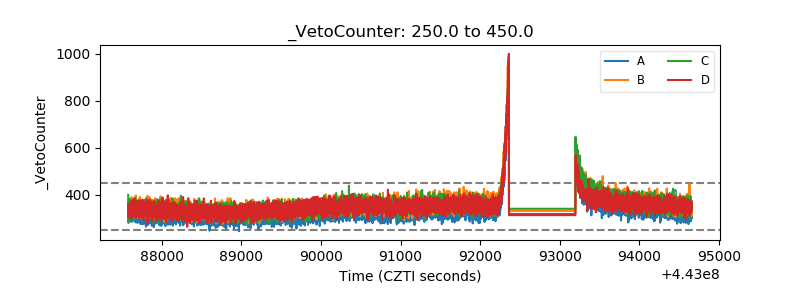 |