| Param | Original file | Final file |
|---|---|---|
| Filename | modeM0/AS1A13_017T02_9000006032_44890cztM0_level2.fits | modeM0/AS1A13_017T02_9000006032_44890cztM0_level2_quad_clean.evt |
| Size (bytes) | 494,735,040 | 99,901,440 |
| Size | 471.8 MB | 95.3 MB |
| Events in quadrant A | 4,812,714 | 673,868 |
| Events in quadrant B | 3,174,352 | 697,388 |
| Events in quadrant C | 2,806,039 | 676,060 |
| Events in quadrant D | 7,037,829 | 543,576 |
| Mode SS | |||
|---|---|---|---|
| Quadrant | BADHDUFLAG | Total packets | Discarded packets |
| A | 0 | 126 | 0 |
| B | 0 | 126 | 0 |
| C | 0 | 126 | 0 |
| D | 0 | 126 | 0 |
| Mode M0 | |||
|---|---|---|---|
| Quadrant | BADHDUFLAG | Total packets | Discarded packets |
| A | 0 | 19190 | 1 |
| B | 0 | 13522 | 1 |
| C | 0 | 12767 | 1 |
| D | 0 | 25310 | 1 |
| Mode M9 | |||
|---|---|---|---|
| Quadrant | BADHDUFLAG | Total packets | Discarded packets |
| A | 0 | 10 | 0 |
| B | 0 | 10 | 0 |
| C | 0 | 10 | 0 |
| D | 0 | 10 | 0 |
| Quadrant | Total seconds | Saturated seconds | Saturation percentage |
|---|---|---|---|
| A | 6218 | 115 | 1.849469% |
| B | 6218 | 121 | 1.945963% |
| C | 6219 | 57 | 0.916546% |
| D | 6219 | 994 | 15.983277% |
Noise dominated data is calculated using 1-second bins in cleaned event files. If a bin has >2000 counts, and if more than 50% of those come from <1% of pixels, then it is considered to be noise-dominated and hence unusable.
| Quadrant | # 1 sec bins | Bins with >0 counts | Bins with >2000 counts | High rate bins dominated by noise | Noise dominated (total time) | Noise dominated (detector-on time) | Marked lightcurve |
|---|---|---|---|---|---|---|---|
| A | 7198 | 6219 | 0 | 0 | 0.00% | 0.00% | 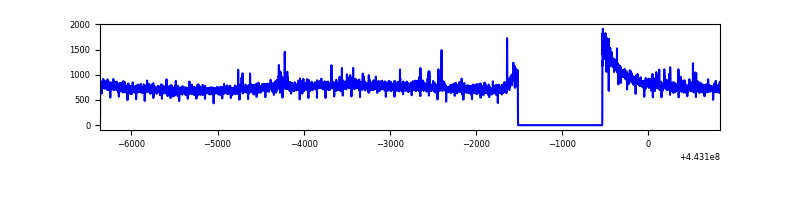 |
| B | 7198 | 6219 | 40 | 40 | 0.56% | 0.64% | 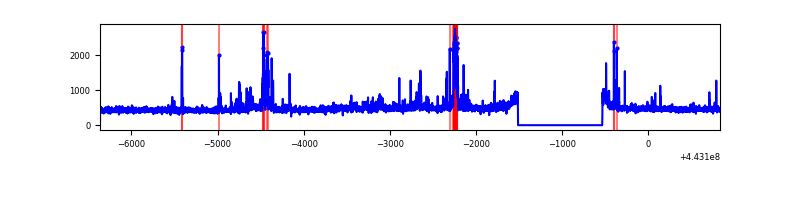 |
| C | 7199 | 6220 | 9 | 9 | 0.13% | 0.14% | 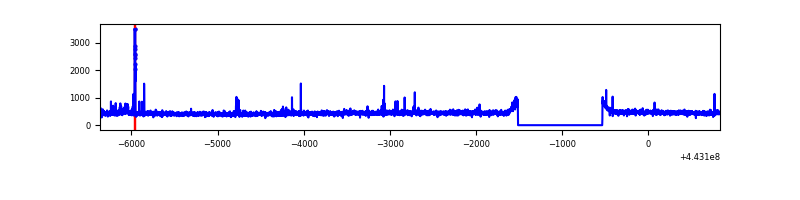 |
| D | 7199 | 6220 | 765 | 765 | 10.63% | 12.30% | 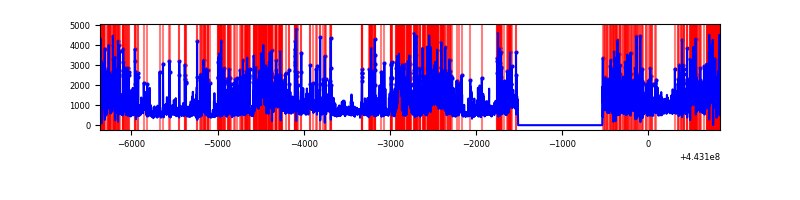 |
Top three noisy pixels from each quadrant. If the there are fewer than three noisy pixels in the level2.evt file, extra rows are filled as -1
| Pixel properties | Quadrant properties | ||||||
|---|---|---|---|---|---|---|---|
| Quadrant | DetID | PixID | Counts | Sigma | Mean | Median | Sigma |
| A | 10 | 83 | 2016433 | 13844.25 | 704 | 688 | 145.6 |
| A | 10 | 255 | 38817 | 261.87 | 704 | 688 | 145.6 |
| A | 10 | 248 | 18585 | 122.92 | 704 | 688 | 145.6 |
| B | 0 | 168 | 197789 | 1395.21 | 703 | 680 | 141.3 |
| B | 0 | 183 | 60635 | 424.38 | 703 | 680 | 141.3 |
| B | 5 | 255 | 35666 | 247.64 | 703 | 680 | 141.3 |
| C | 14 | 254 | 45280 | 273.16 | 695 | 701 | 163.2 |
| C | 9 | 54 | 19641 | 116.05 | 695 | 701 | 163.2 |
| C | 1 | 3 | 12273 | 70.91 | 695 | 701 | 163.2 |
| D | 1 | 52 | 965918 | 5883.22 | 650 | 629 | 164.1 |
| D | 2 | 249 | 926451 | 5642.67 | 650 | 629 | 164.1 |
| D | 13 | 174 | 920930 | 5609.03 | 650 | 629 | 164.1 |
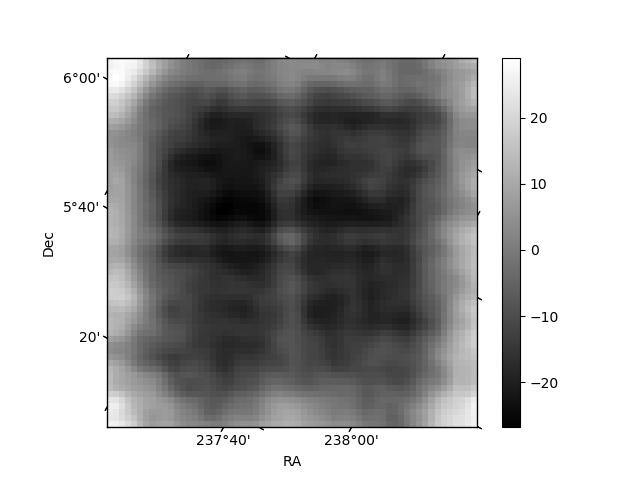
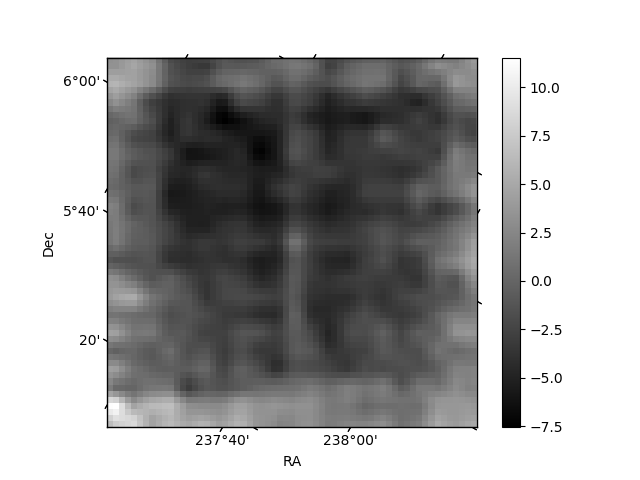
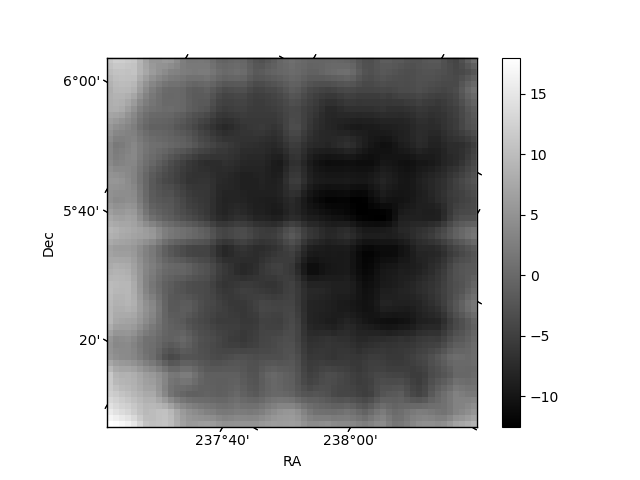
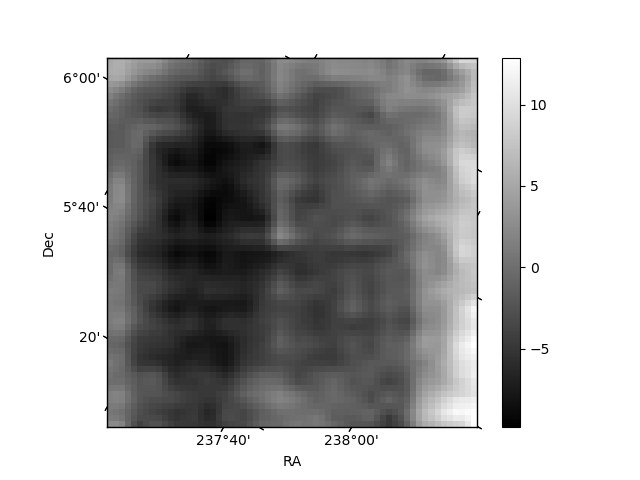
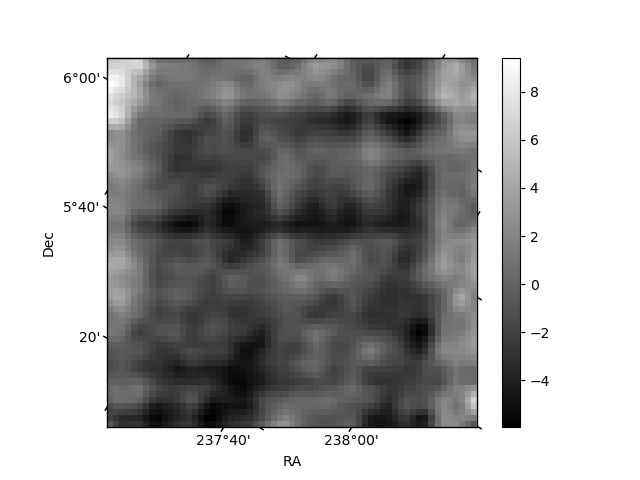
Histogram calculated using DETX and DETY for each event in the final _common_clean file
| Quadrant A | 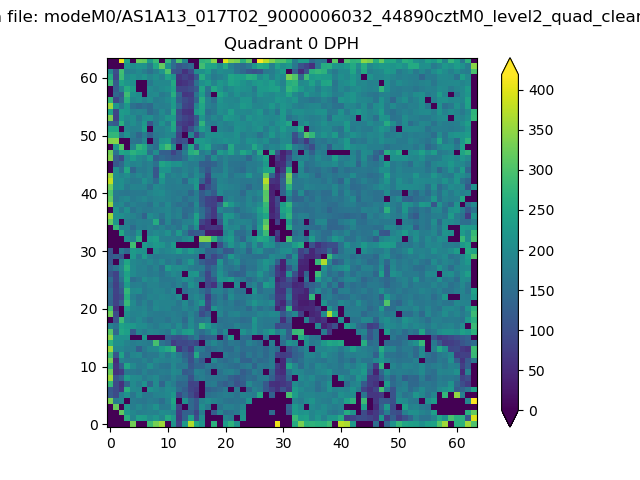 |
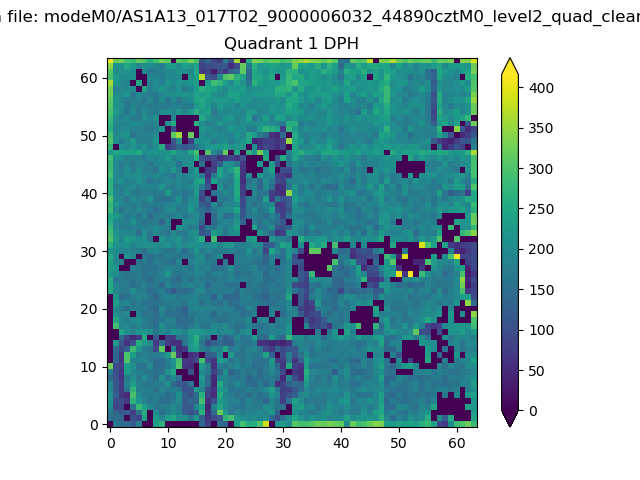 |
Quadrant B |
|---|---|---|---|
| Quadrant D | 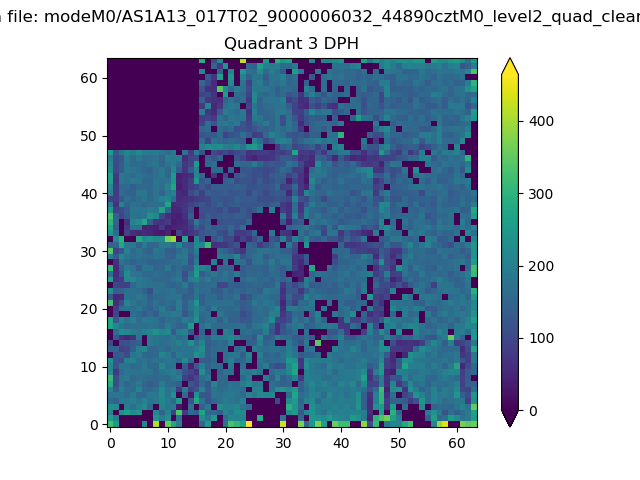 |
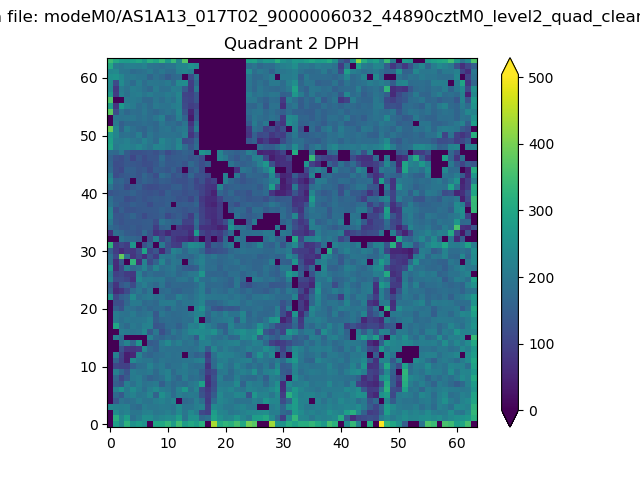 |
Quadrant C |
| Plot type | Count rate plots | Images |
|---|---|---|
| Comparison with Poisson distribution Blue bars denote a histogram of data divided into 1 sec bins. Red curve is a Poisson curve with rate = median count rate of data. |
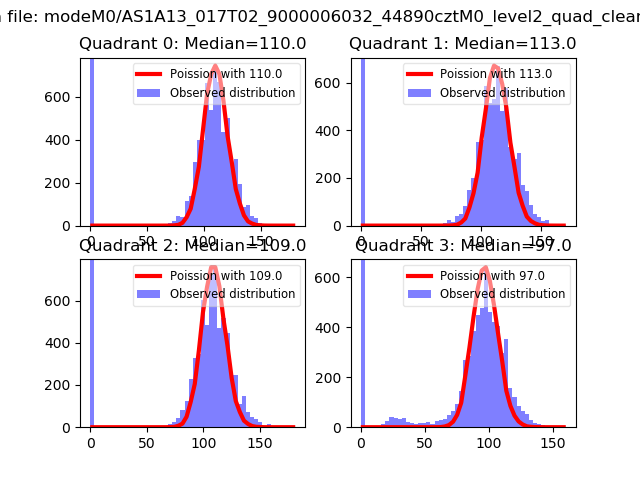 |
 |
| Quadrant-wise count rates Data is divided into 100 sec bins |
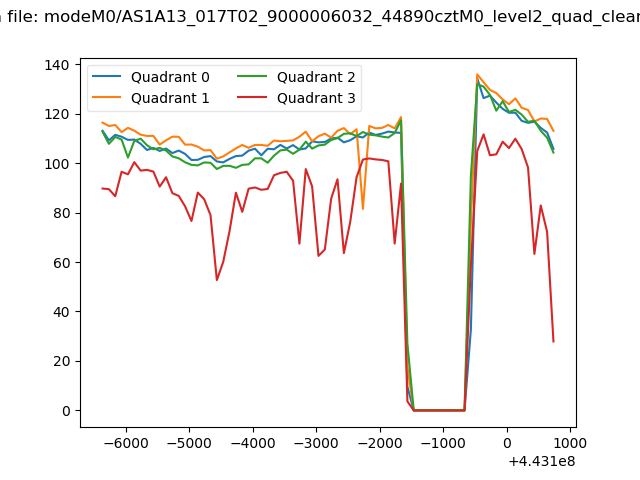 |
|
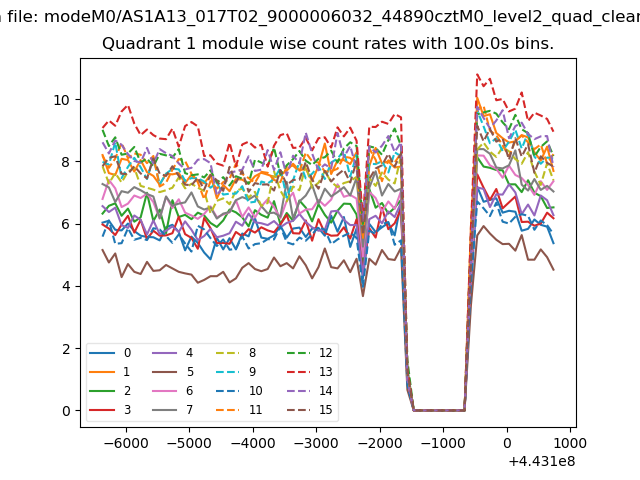
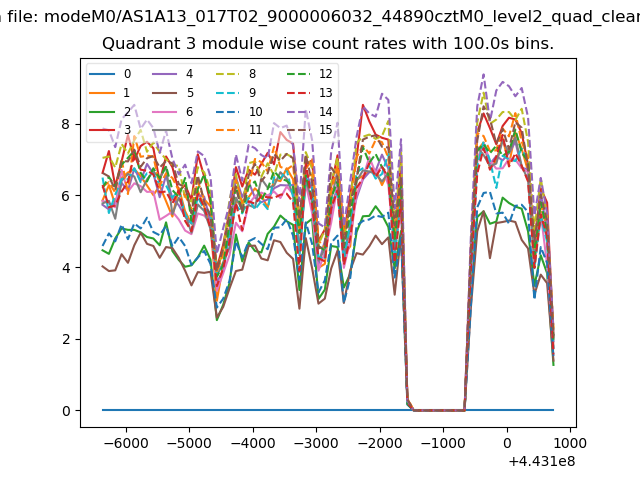
| Module-wise count rates for Quadrant A Data is divided into 100 sec bins |
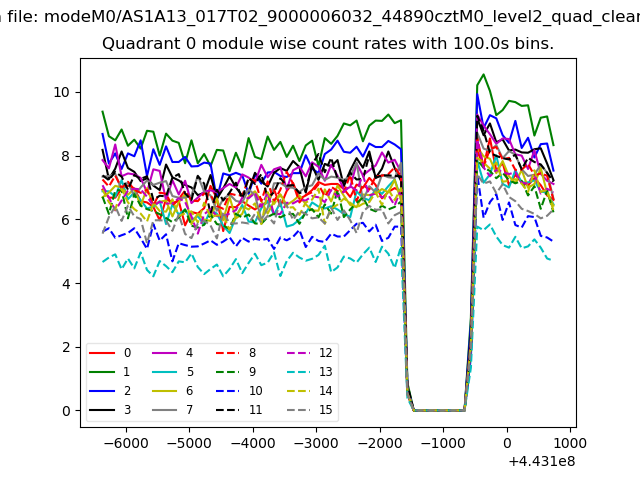 |
 |
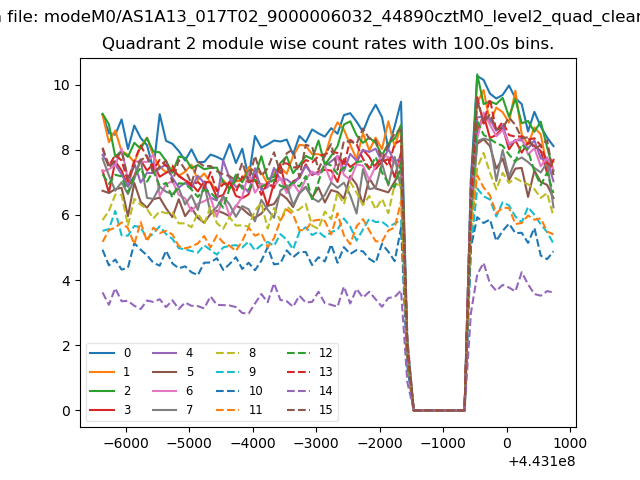
| Module-wise count rates for Quadrant B Data is divided into 100 sec bins |
 |
 |
| Module-wise count rates for Quadrant C Data is divided into 100 sec bins |
 |
 |
| Module-wise count rates for Quadrant D Data is divided into 100 sec bins |
 |
 |
| Parameter | Plot |
|---|---|
| CZT HV Monitor | 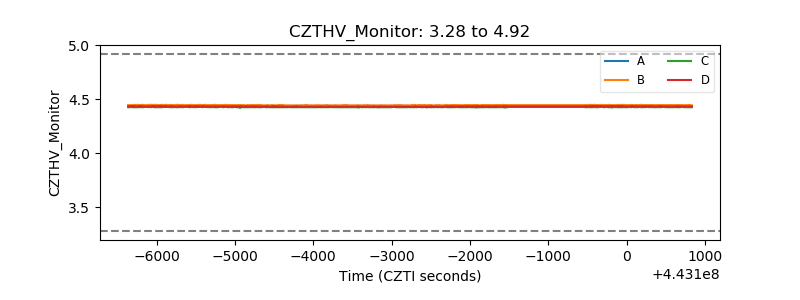 |
| D_VDD | 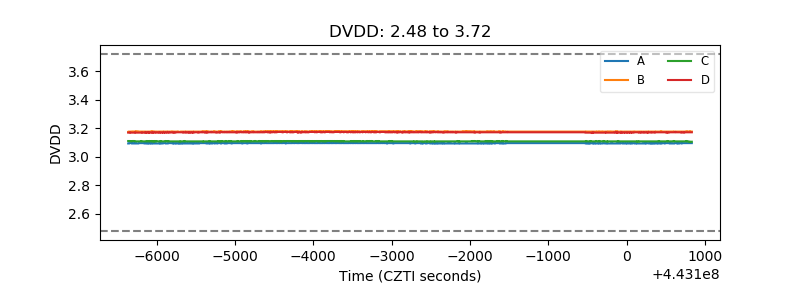 |
| Temperature 1 | 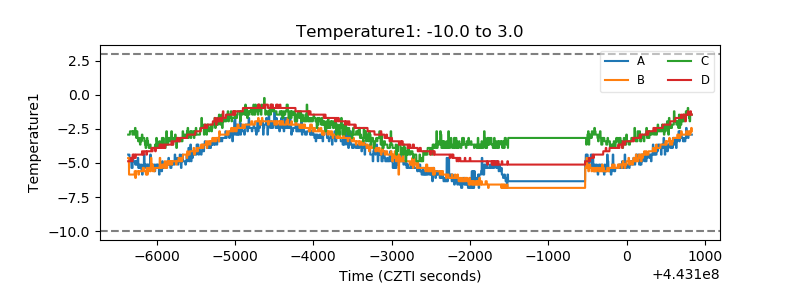 |
| Veto HV Monitor | 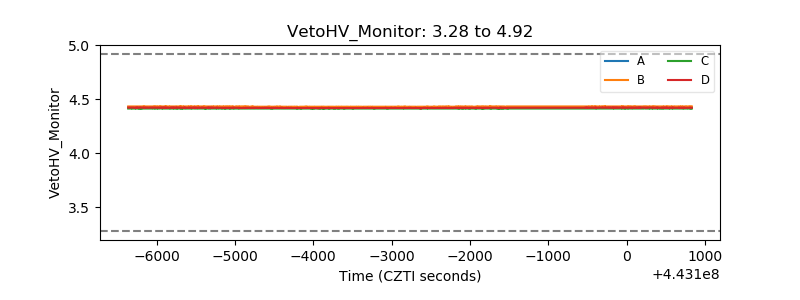 |
| Veto LLD | 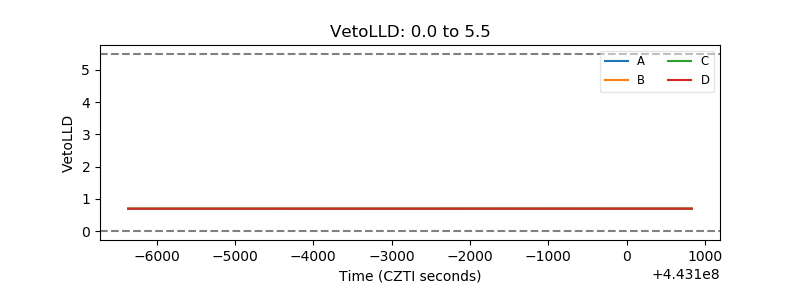 |
| Alpha Counter | 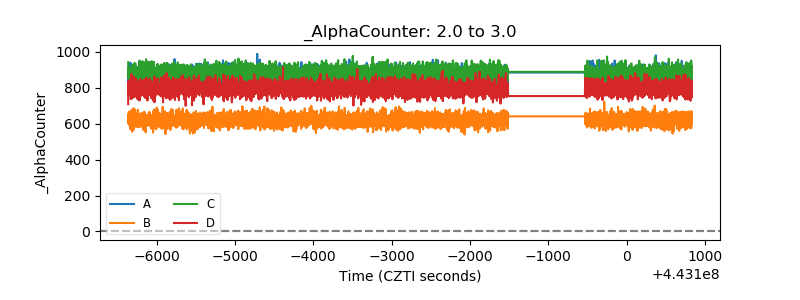 |
| _CPM_Rate | 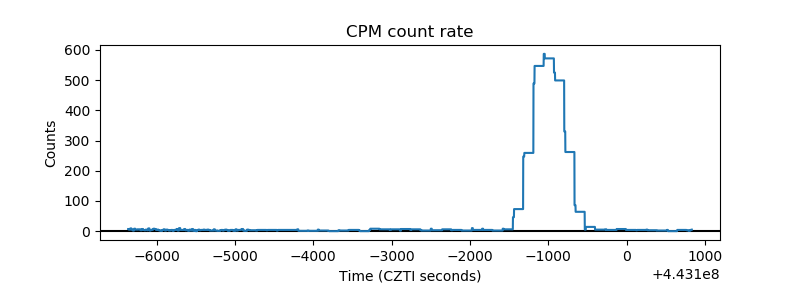 |
| CZT Counter | 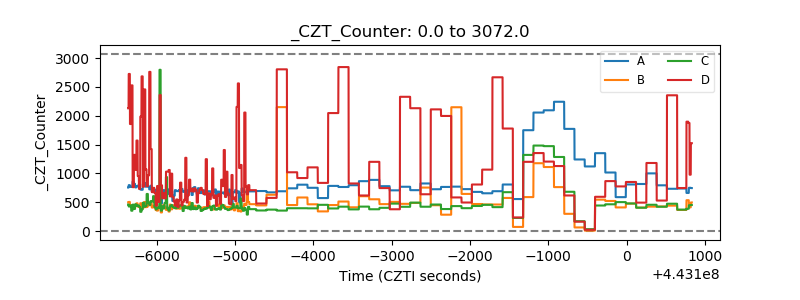 |
| +2.5 Volts monitor | 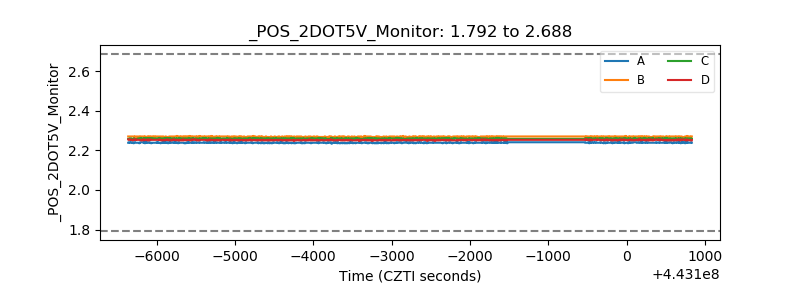 |
| +5 Volts monitor | 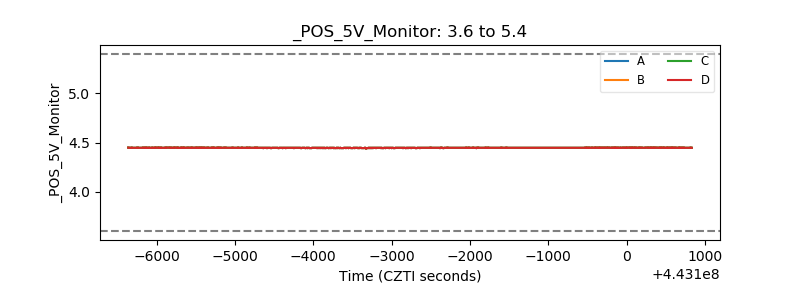 |
| _ROLL_ROT | 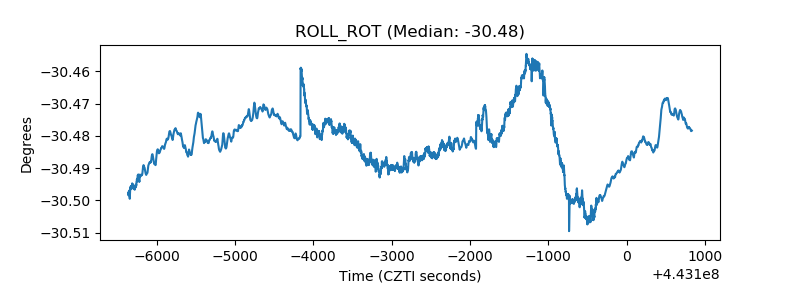 |
| _Roll_DEC | 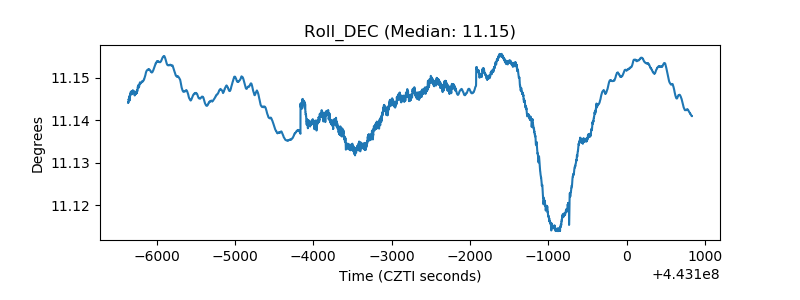 |
| _Roll_RA | 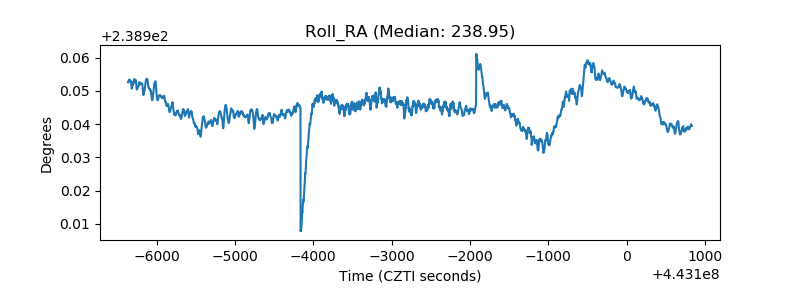 |
| Veto Counter | 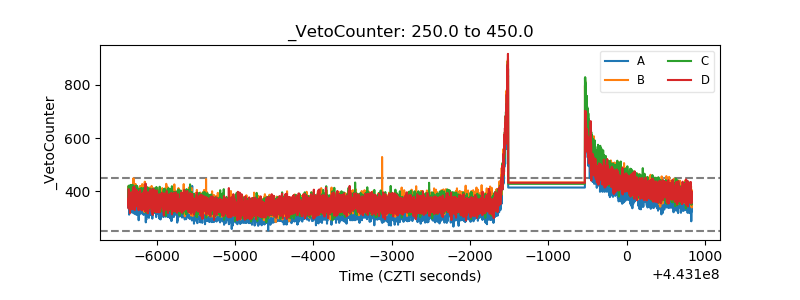 |