| Param | Original file | Final file |
|---|---|---|
| Filename | modeM0/AS1A13_017T02_9000006032_44892cztM0_level2.fits | modeM0/AS1A13_017T02_9000006032_44892cztM0_level2_quad_clean.evt |
| Size (bytes) | 551,911,680 | 103,896,000 |
| Size | 526.3 MB | 99.1 MB |
| Events in quadrant A | 5,040,394 | 714,211 |
| Events in quadrant B | 3,394,171 | 740,467 |
| Events in quadrant C | 2,943,859 | 714,566 |
| Events in quadrant D | 8,568,404 | 540,601 |
| Mode SS | |||
|---|---|---|---|
| Quadrant | BADHDUFLAG | Total packets | Discarded packets |
| A | 0 | 130 | 0 |
| B | 0 | 130 | 0 |
| C | 0 | 130 | 0 |
| D | 0 | 130 | 0 |
| Mode M0 | |||
|---|---|---|---|
| Quadrant | BADHDUFLAG | Total packets | Discarded packets |
| A | 0 | 19590 | 3 |
| B | 0 | 14034 | 1 |
| C | 0 | 12929 | 1 |
| D | 0 | 29850 | 8 |
| Mode M9 | |||
|---|---|---|---|
| Quadrant | BADHDUFLAG | Total packets | Discarded packets |
| A | 0 | 10 | 0 |
| B | 0 | 10 | 0 |
| C | 0 | 10 | 0 |
| D | 0 | 10 | 0 |
| Quadrant | Total seconds | Saturated seconds | Saturation percentage |
|---|---|---|---|
| A | 6234 | 149 | 2.390119% |
| B | 6236 | 118 | 1.892239% |
| C | 6236 | 79 | 1.266838% |
| D | 6235 | 1364 | 21.876504% |
Noise dominated data is calculated using 1-second bins in cleaned event files. If a bin has >2000 counts, and if more than 50% of those come from <1% of pixels, then it is considered to be noise-dominated and hence unusable.
| Quadrant | # 1 sec bins | Bins with >0 counts | Bins with >2000 counts | High rate bins dominated by noise | Noise dominated (total time) | Noise dominated (detector-on time) | Marked lightcurve |
|---|---|---|---|---|---|---|---|
| A | 7330 | 6236 | 8 | 8 | 0.11% | 0.13% | 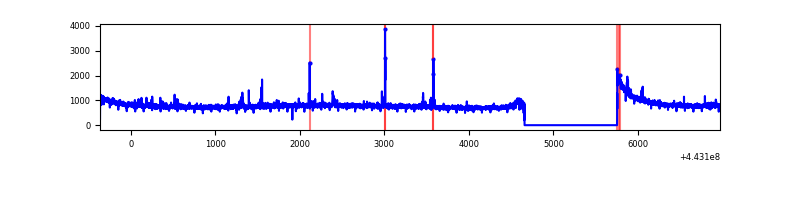 |
| B | 7331 | 6237 | 14 | 14 | 0.19% | 0.22% | 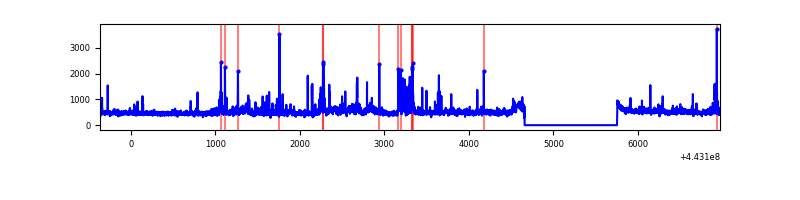 |
| C | 7331 | 6237 | 6 | 6 | 0.08% | 0.10% | 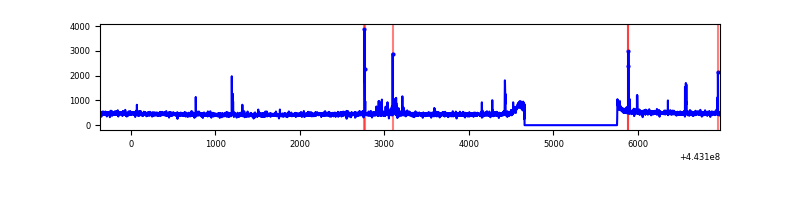 |
| D | 7331 | 6237 | 1091 | 1091 | 14.88% | 17.49% | 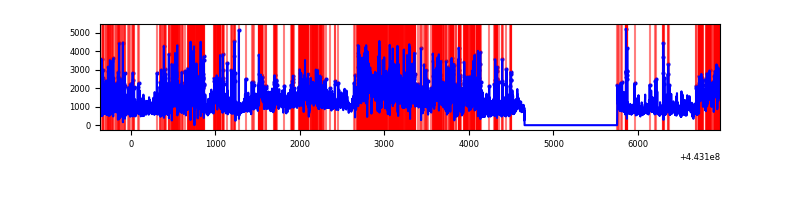 |
Top three noisy pixels from each quadrant. If the there are fewer than three noisy pixels in the level2.evt file, extra rows are filled as -1
| Pixel properties | Quadrant properties | ||||||
|---|---|---|---|---|---|---|---|
| Quadrant | DetID | PixID | Counts | Sigma | Mean | Median | Sigma |
| A | 10 | 83 | 2091574 | 13670.02 | 735 | 718 | 153.0 |
| A | 10 | 248 | 40683 | 261.29 | 735 | 718 | 153.0 |
| A | 10 | 255 | 31058 | 198.36 | 735 | 718 | 153.0 |
| B | 0 | 183 | 178406 | 1243.82 | 730 | 709 | 142.9 |
| B | 7 | 221 | 77180 | 535.27 | 730 | 709 | 142.9 |
| B | 0 | 219 | 55056 | 380.41 | 730 | 709 | 142.9 |
| C | 14 | 254 | 54576 | 314.2 | 725 | 730 | 171.4 |
| C | 2 | 14 | 29010 | 165.02 | 725 | 730 | 171.4 |
| C | 1 | 3 | 11015 | 60.01 | 725 | 730 | 171.4 |
| D | 13 | 174 | 1976341 | 11862.85 | 667 | 648 | 166.5 |
| D | 5 | 222 | 1286720 | 7722.09 | 667 | 648 | 166.5 |
| D | 1 | 52 | 719201 | 4314.48 | 667 | 648 | 166.5 |
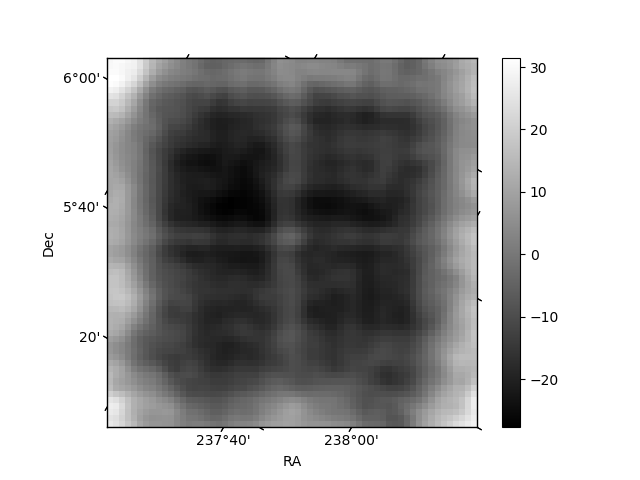
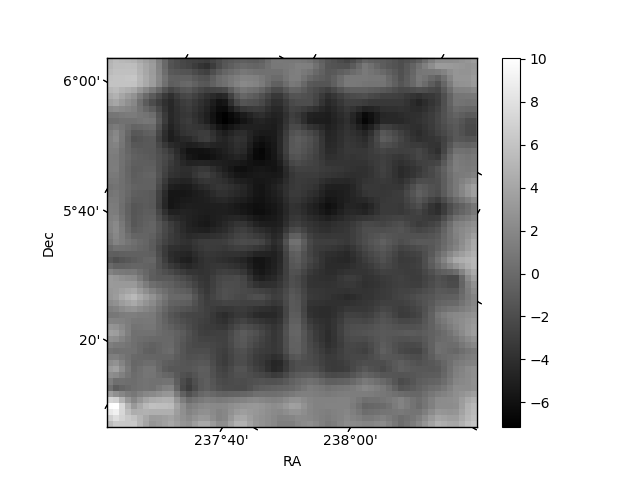
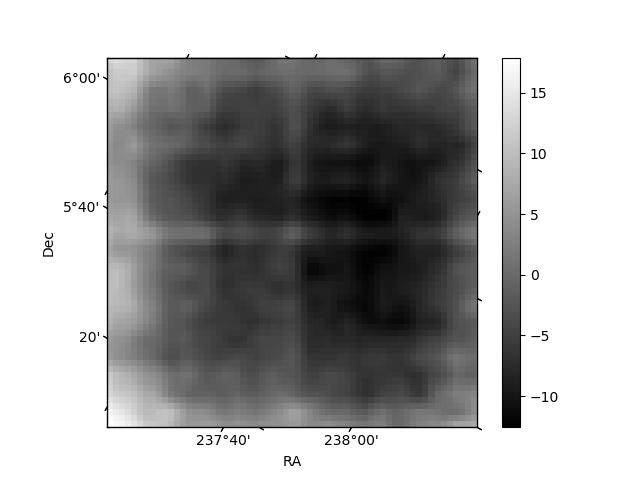
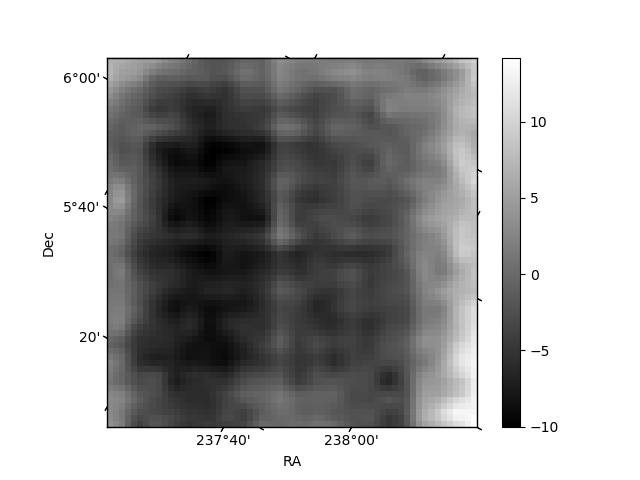
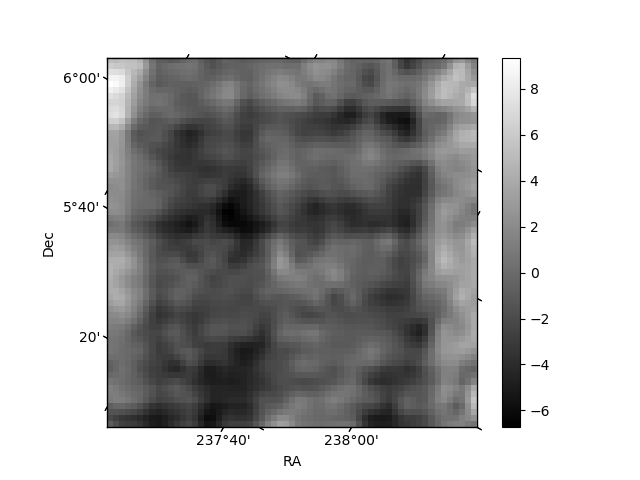
Histogram calculated using DETX and DETY for each event in the final _common_clean file
| Quadrant A | 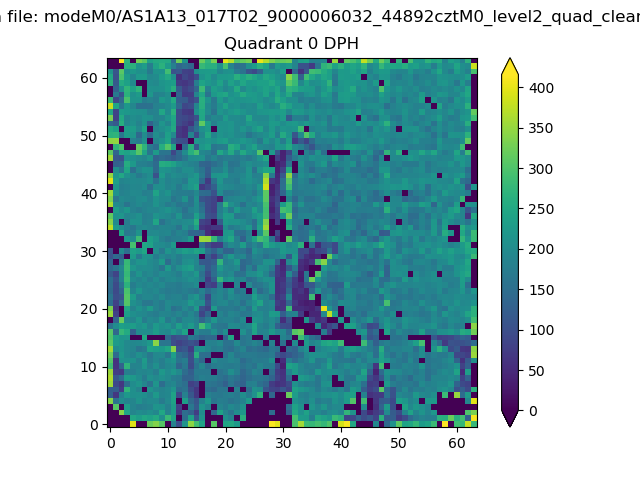 |
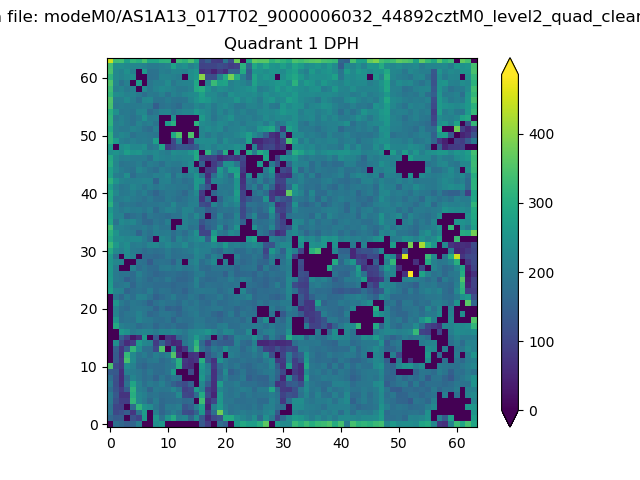 |
Quadrant B |
|---|---|---|---|
| Quadrant D | 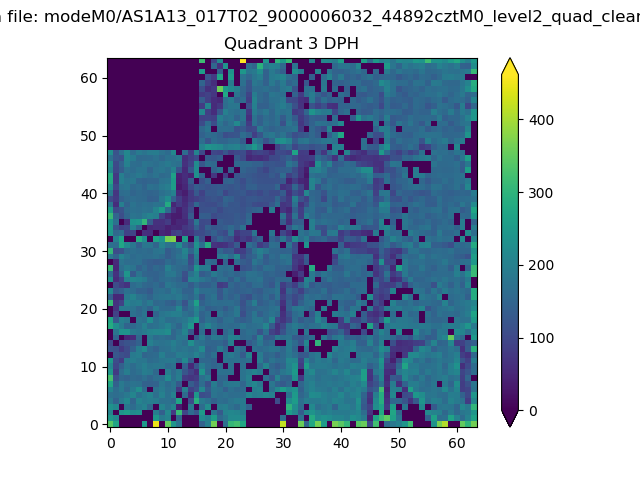 |
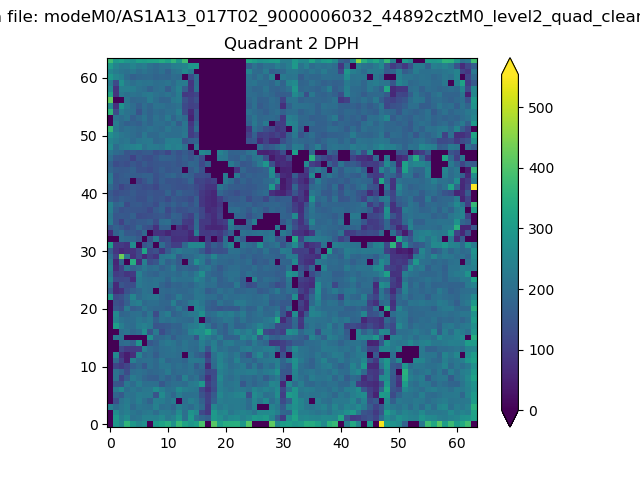 |
Quadrant C |
| Plot type | Count rate plots | Images |
|---|---|---|
| Comparison with Poisson distribution Blue bars denote a histogram of data divided into 1 sec bins. Red curve is a Poisson curve with rate = median count rate of data. |
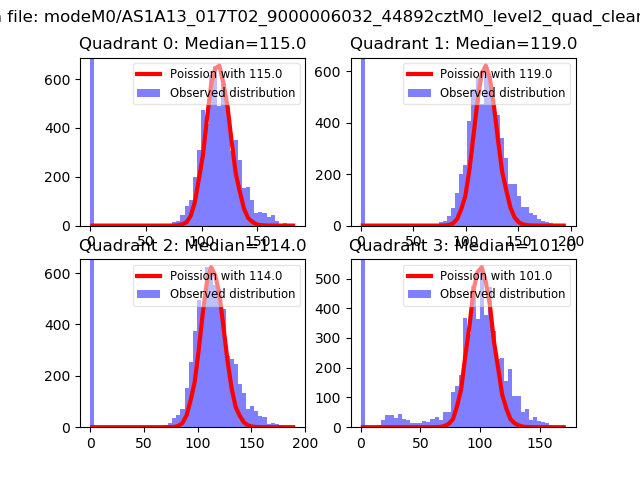 |
 |
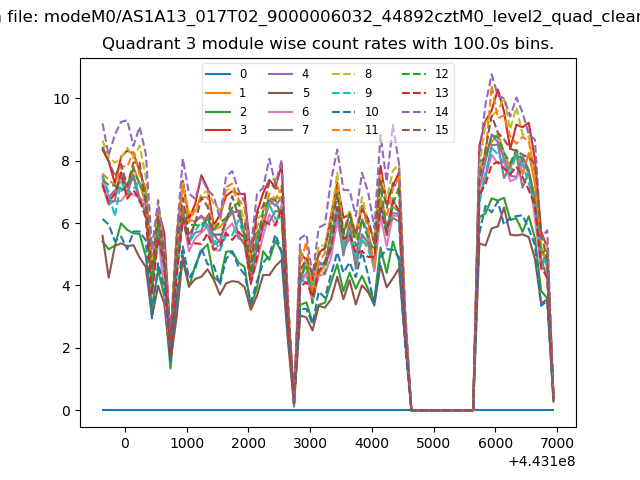
| Quadrant-wise count rates Data is divided into 100 sec bins |
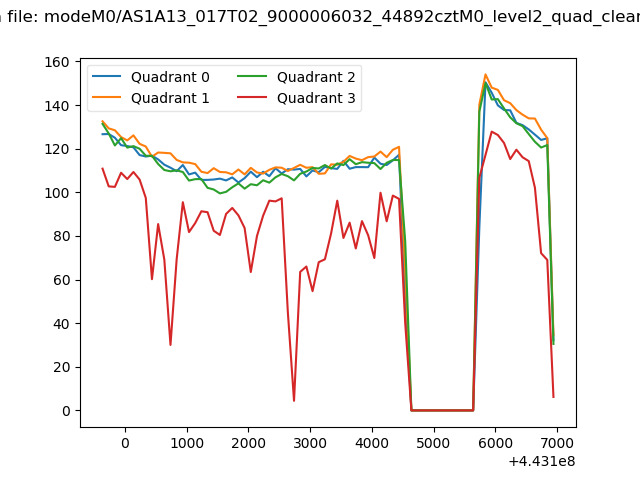 |
|
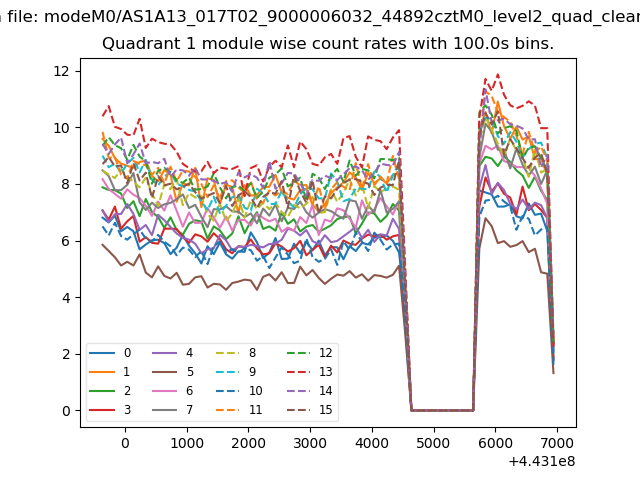
| Module-wise count rates for Quadrant A Data is divided into 100 sec bins |
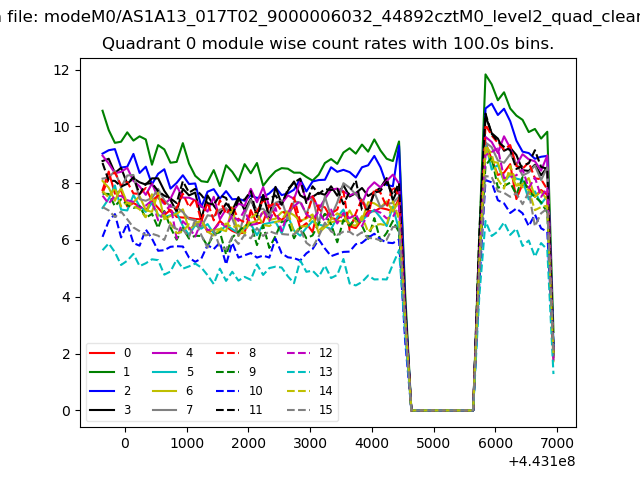 |
 |
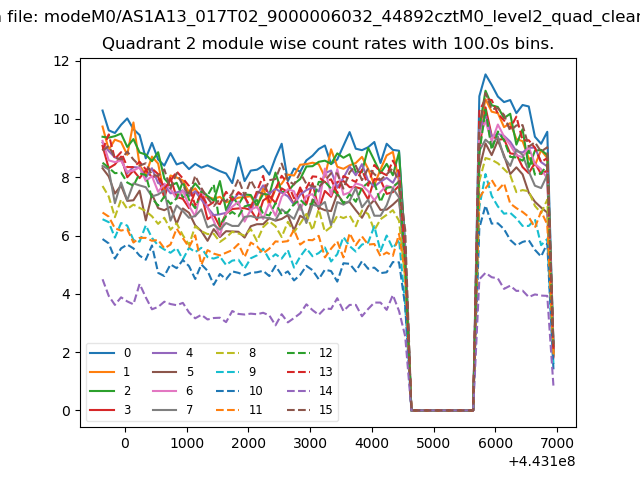
| Module-wise count rates for Quadrant B Data is divided into 100 sec bins |
 |
 |
| Module-wise count rates for Quadrant C Data is divided into 100 sec bins |
 |
 |
| Module-wise count rates for Quadrant D Data is divided into 100 sec bins |
 |
 |
| Parameter | Plot |
|---|---|
| CZT HV Monitor | 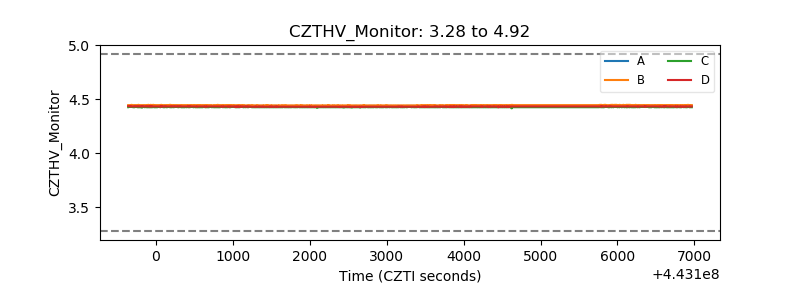 |
| D_VDD | 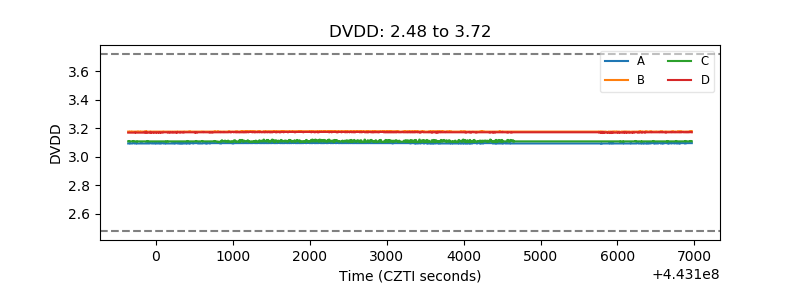 |
| Temperature 1 | 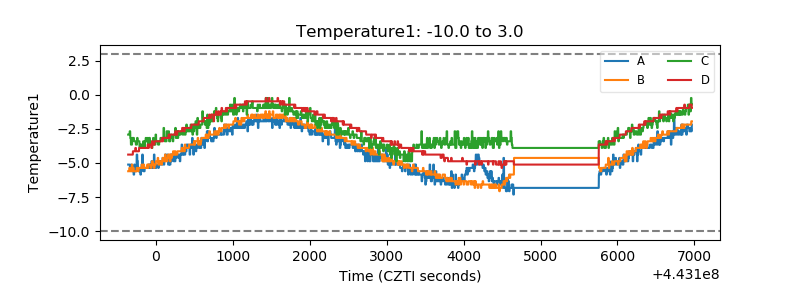 |
| Veto HV Monitor |  |
| Veto LLD | 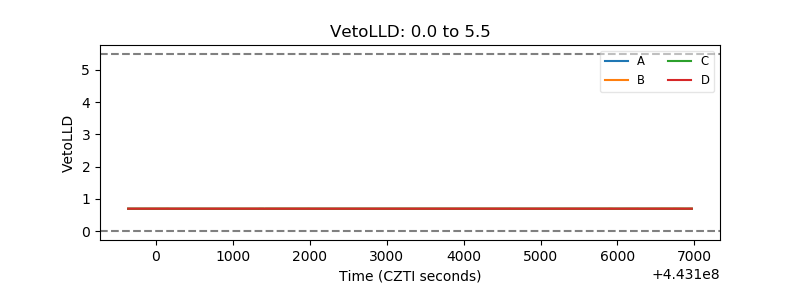 |
| Alpha Counter | 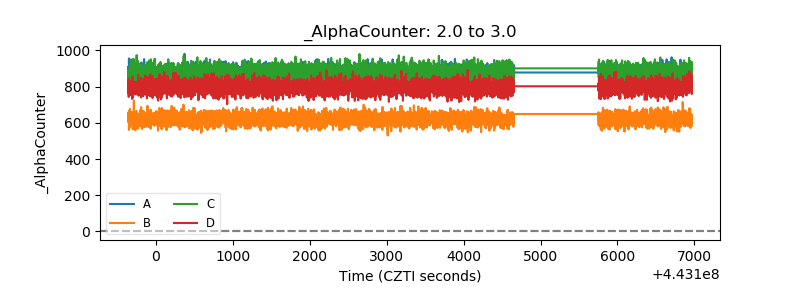 |
| _CPM_Rate | 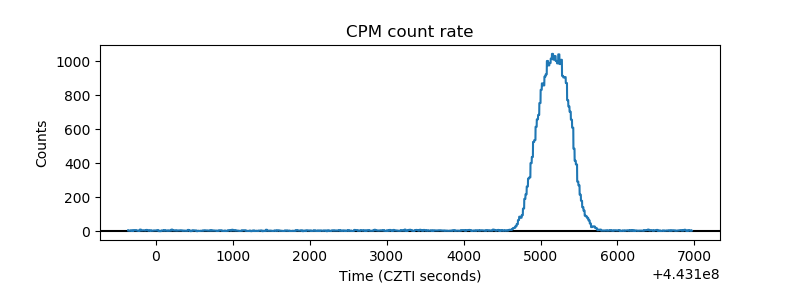 |
| CZT Counter | 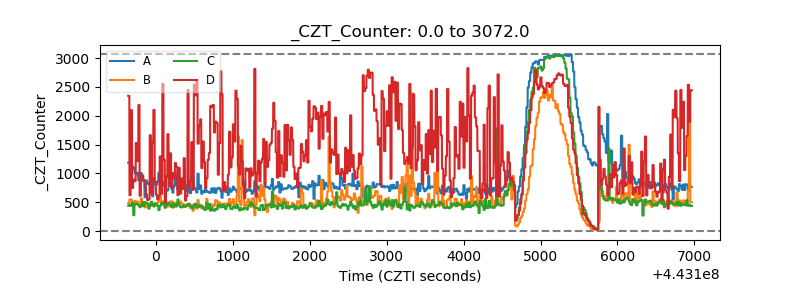 |
| +2.5 Volts monitor | 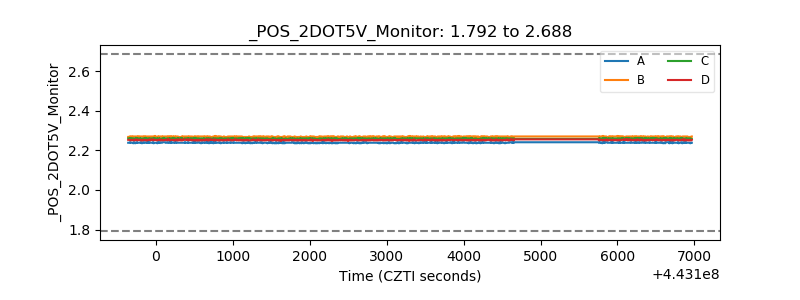 |
| +5 Volts monitor | 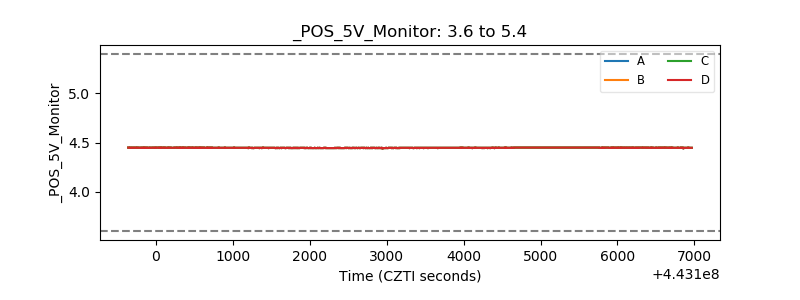 |
| _ROLL_ROT | 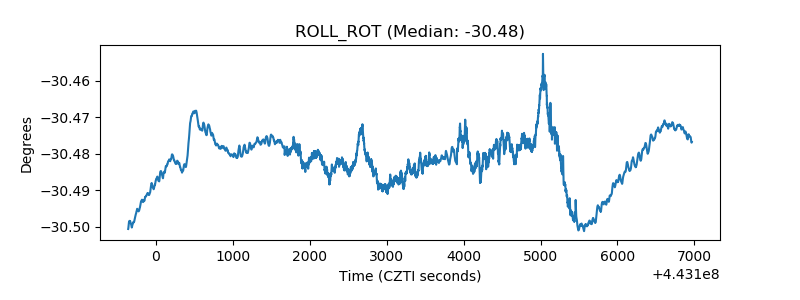 |
| _Roll_DEC | 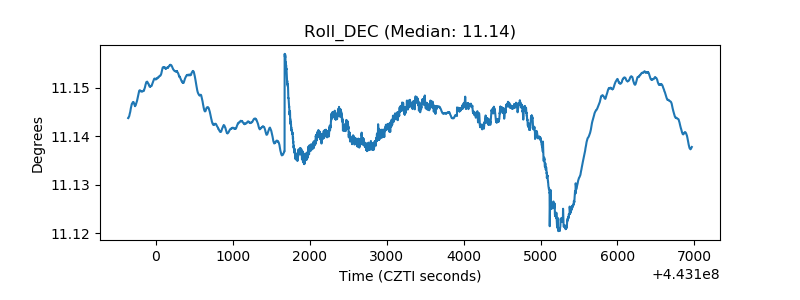 |
| _Roll_RA | 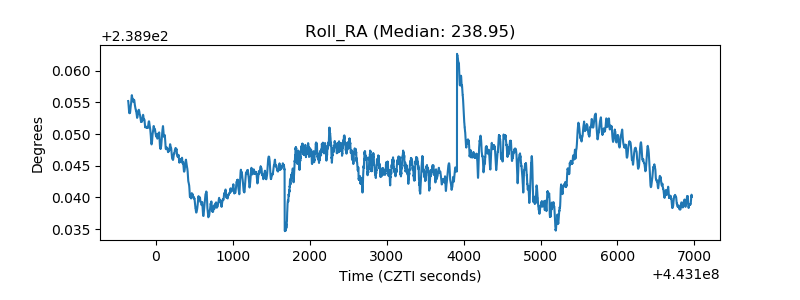 |
| Veto Counter | 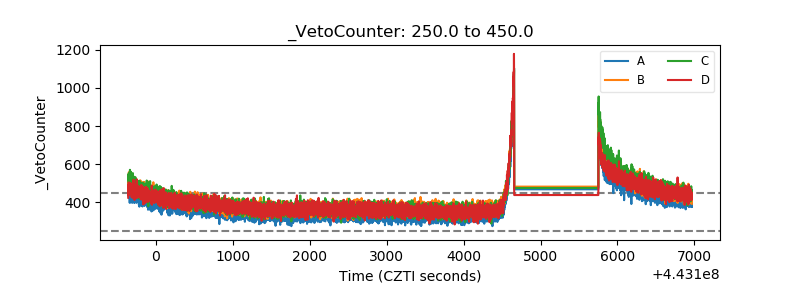 |