| Param | Original file | Final file |
|---|---|---|
| Filename | modeM0/AS1A13_017T02_9000006032_44893cztM0_level2.fits | modeM0/AS1A13_017T02_9000006032_44893cztM0_level2_quad_clean.evt |
| Size (bytes) | 567,547,200 | 113,336,640 |
| Size | 541.3 MB | 108.1 MB |
| Events in quadrant A | 5,416,719 | 776,930 |
| Events in quadrant B | 3,772,228 | 802,022 |
| Events in quadrant C | 3,174,305 | 781,068 |
| Events in quadrant D | 8,153,805 | 628,507 |
| Mode SS | |||
|---|---|---|---|
| Quadrant | BADHDUFLAG | Total packets | Discarded packets |
| A | 0 | 130 | 0 |
| B | 0 | 130 | 0 |
| C | 0 | 130 | 0 |
| D | 0 | 130 | 0 |
| Mode M0 | |||
|---|---|---|---|
| Quadrant | BADHDUFLAG | Total packets | Discarded packets |
| A | 0 | 20570 | 2 |
| B | 0 | 15224 | 2 |
| C | 0 | 13484 | 2 |
| D | 0 | 28671 | 2 |
| Mode M9 | |||
|---|---|---|---|
| Quadrant | BADHDUFLAG | Total packets | Discarded packets |
| A | 0 | 14 | 0 |
| B | 0 | 15 | 0 |
| C | 0 | 15 | 0 |
| D | 0 | 15 | 0 |
| Quadrant | Total seconds | Saturated seconds | Saturation percentage |
|---|---|---|---|
| A | 6352 | 183 | 2.880982% |
| B | 6352 | 195 | 3.069899% |
| C | 6352 | 57 | 0.897355% |
| D | 6352 | 1016 | 15.994962% |
Noise dominated data is calculated using 1-second bins in cleaned event files. If a bin has >2000 counts, and if more than 50% of those come from <1% of pixels, then it is considered to be noise-dominated and hence unusable.
| Quadrant | # 1 sec bins | Bins with >0 counts | Bins with >2000 counts | High rate bins dominated by noise | Noise dominated (total time) | Noise dominated (detector-on time) | Marked lightcurve |
|---|---|---|---|---|---|---|---|
| A | 7567 | 6353 | 11 | 11 | 0.15% | 0.17% | 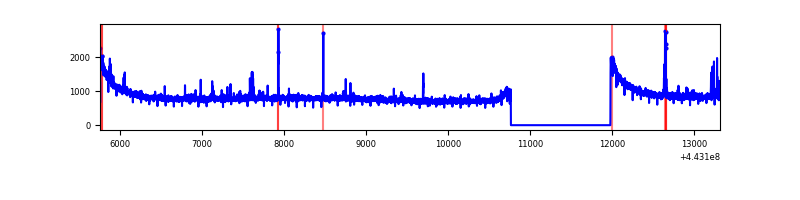 |
| B | 7567 | 6353 | 87 | 87 | 1.15% | 1.37% | 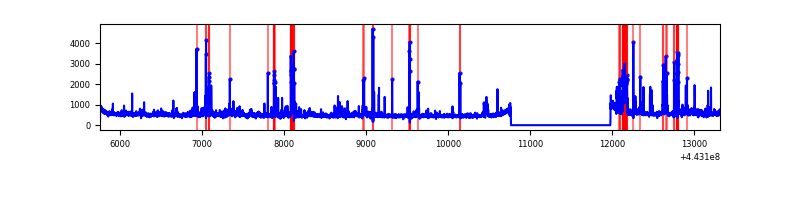 |
| C | 7567 | 6353 | 12 | 12 | 0.16% | 0.19% | 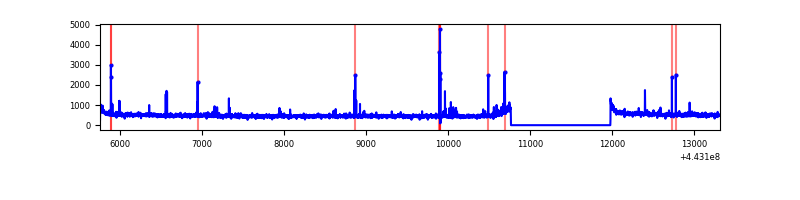 |
| D | 7567 | 6353 | 839 | 839 | 11.09% | 13.21% | 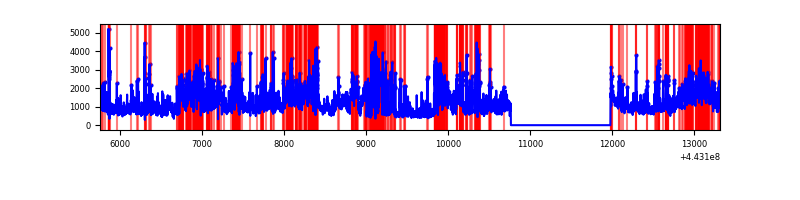 |
Top three noisy pixels from each quadrant. If the there are fewer than three noisy pixels in the level2.evt file, extra rows are filled as -1
| Pixel properties | Quadrant properties | ||||||
|---|---|---|---|---|---|---|---|
| Quadrant | DetID | PixID | Counts | Sigma | Mean | Median | Sigma |
| A | 10 | 83 | 2272284 | 14077.55 | 784 | 771 | 161.4 |
| A | 13 | 248 | 68156 | 417.61 | 784 | 771 | 161.4 |
| A | 7 | 3 | 23284 | 139.52 | 784 | 771 | 161.4 |
| B | 5 | 255 | 171106 | 1127.58 | 777 | 754 | 151.1 |
| B | 0 | 190 | 155767 | 1026.04 | 777 | 754 | 151.1 |
| B | 5 | 172 | 137136 | 902.72 | 777 | 754 | 151.1 |
| C | 12 | 2 | 51999 | 281.3 | 777 | 783 | 182.1 |
| C | 14 | 254 | 43266 | 233.33 | 777 | 783 | 182.1 |
| C | 2 | 14 | 25958 | 138.27 | 777 | 783 | 182.1 |
| D | 13 | 174 | 1334266 | 7241.29 | 737 | 718 | 184.2 |
| D | 13 | 187 | 892863 | 4844.43 | 737 | 718 | 184.2 |
| D | 1 | 47 | 738486 | 4006.15 | 737 | 718 | 184.2 |
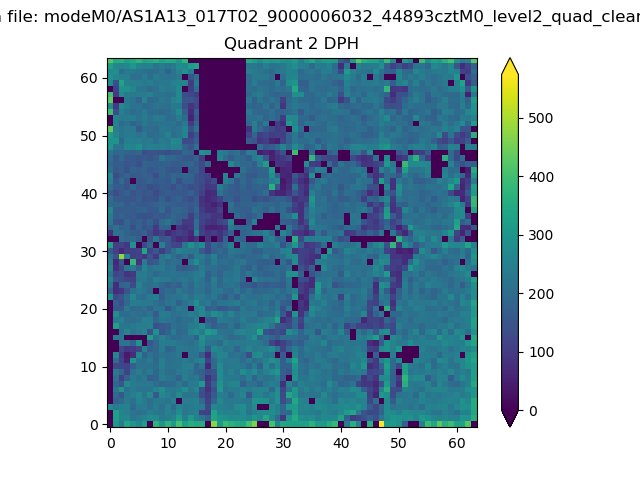
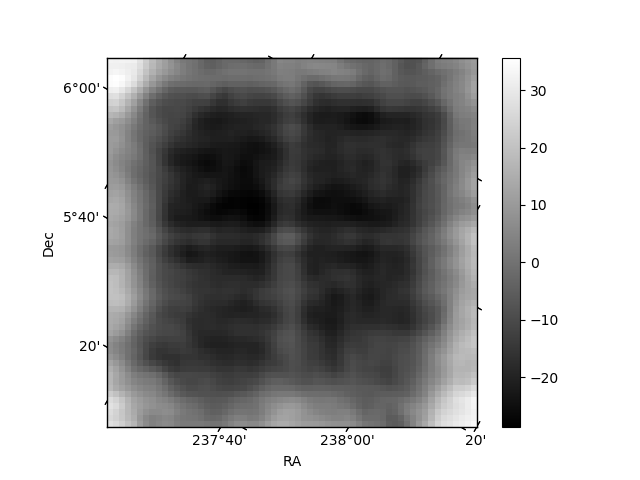
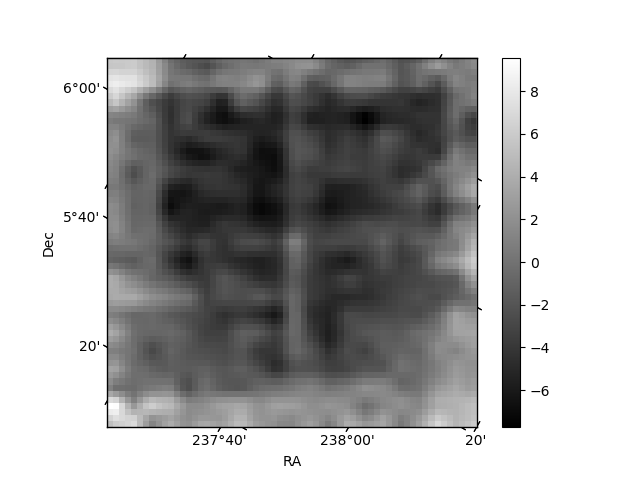
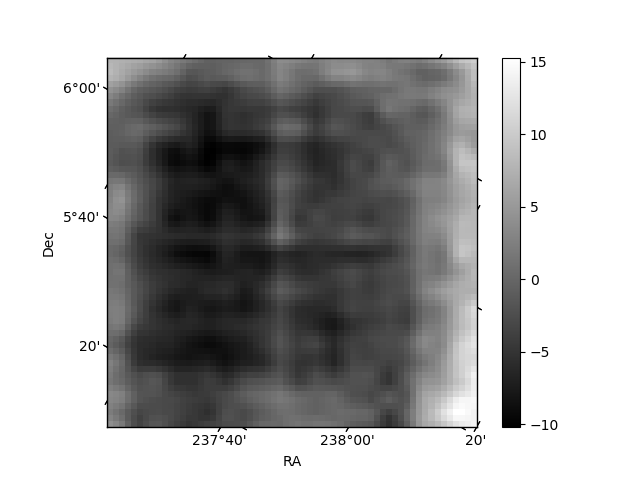
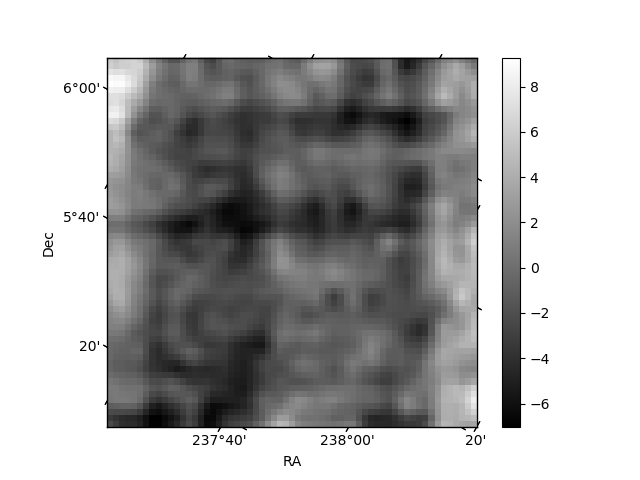
Histogram calculated using DETX and DETY for each event in the final _common_clean file
| Quadrant A | 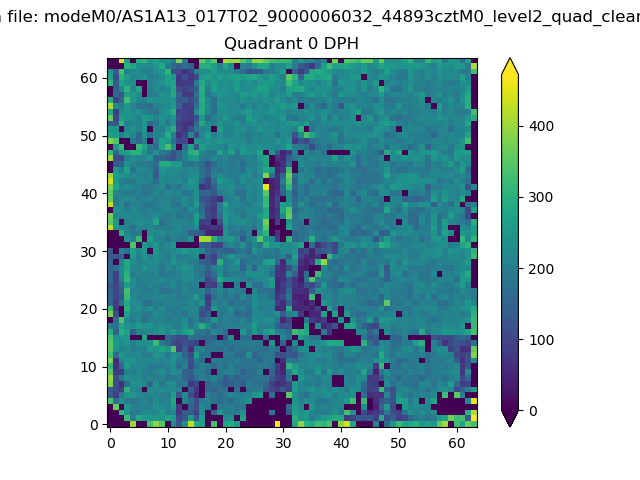 |
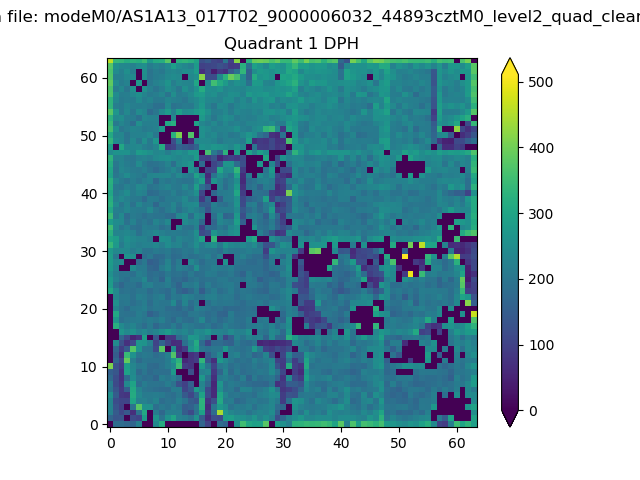 |
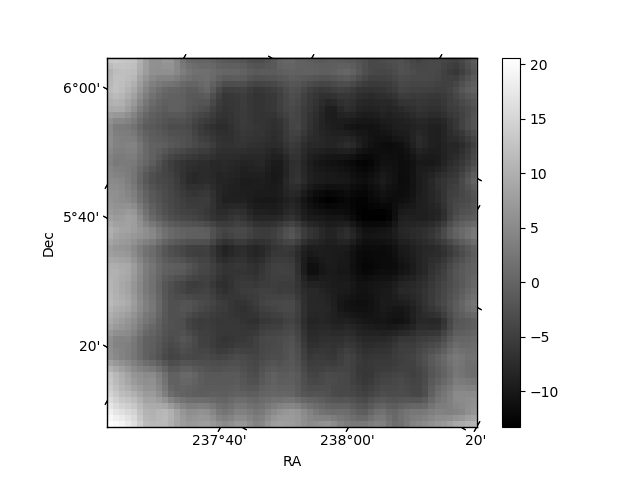
Quadrant B |
|---|---|---|---|
| Quadrant D | 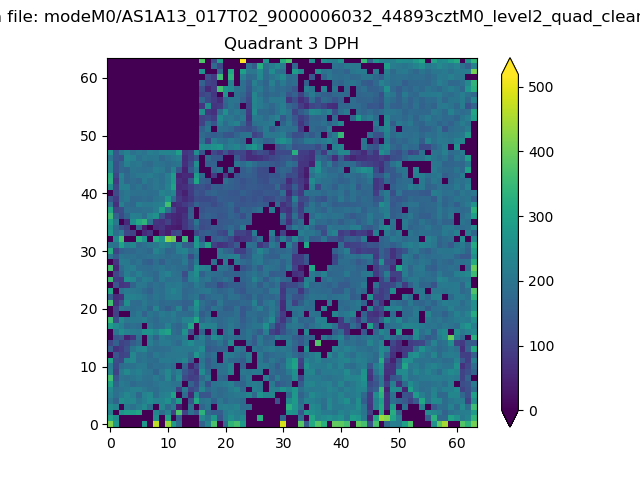 |
 |
Quadrant C |
| Plot type | Count rate plots | Images |
|---|---|---|
| Comparison with Poisson distribution Blue bars denote a histogram of data divided into 1 sec bins. Red curve is a Poisson curve with rate = median count rate of data. |
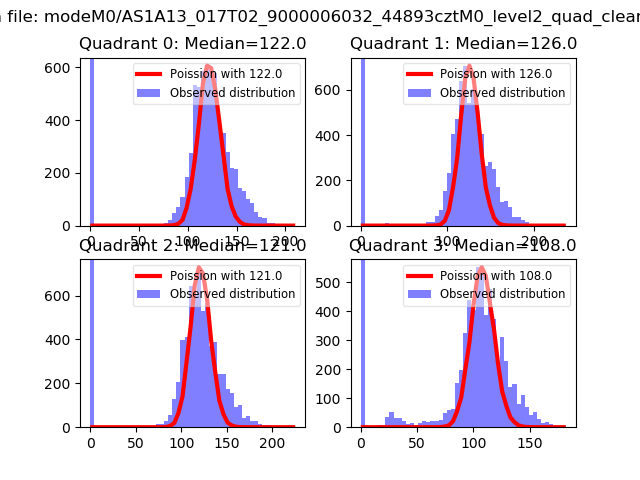 |
 |
| Quadrant-wise count rates Data is divided into 100 sec bins |
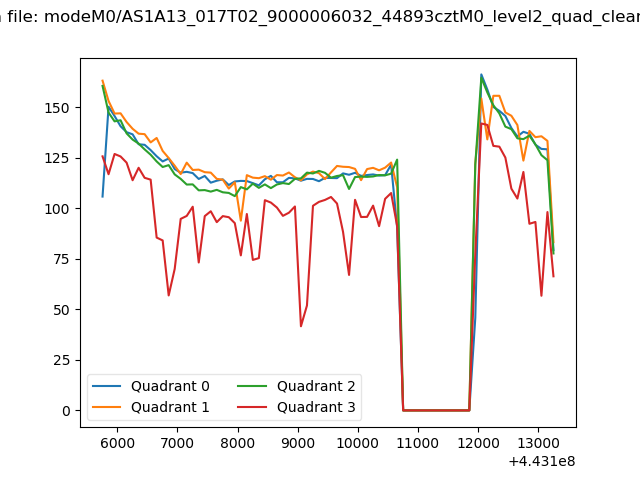 |
|
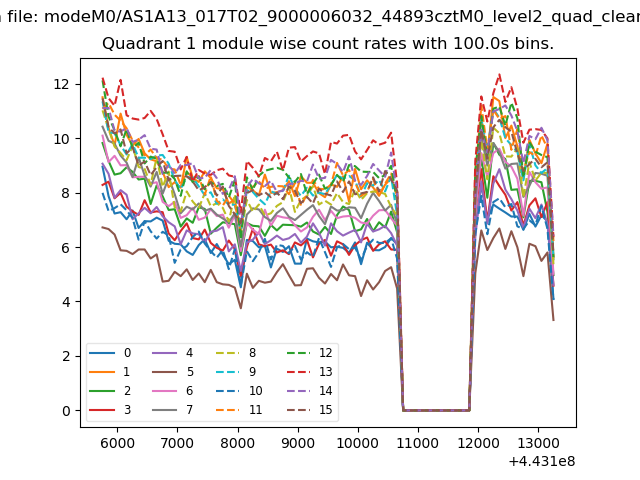
| Module-wise count rates for Quadrant A Data is divided into 100 sec bins |
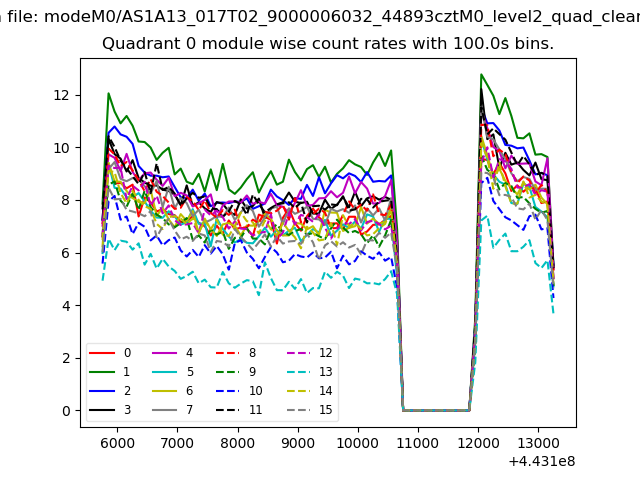 |
 |
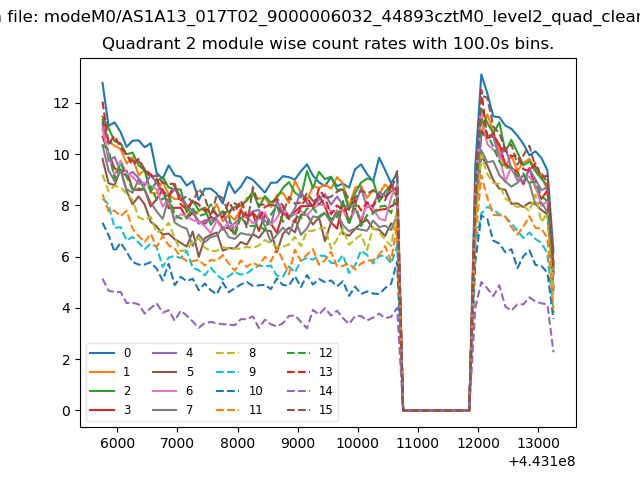
| Module-wise count rates for Quadrant B Data is divided into 100 sec bins |
 |
 |
| Module-wise count rates for Quadrant C Data is divided into 100 sec bins |
 |
 |
| Module-wise count rates for Quadrant D Data is divided into 100 sec bins |
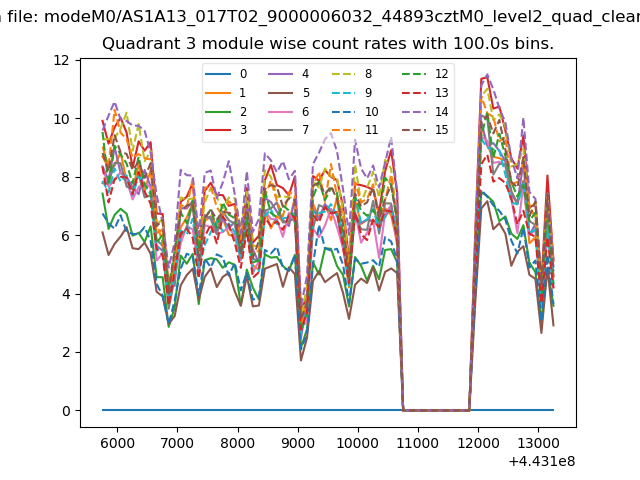 |
 |
| Parameter | Plot |
|---|---|
| CZT HV Monitor |  |
| D_VDD | 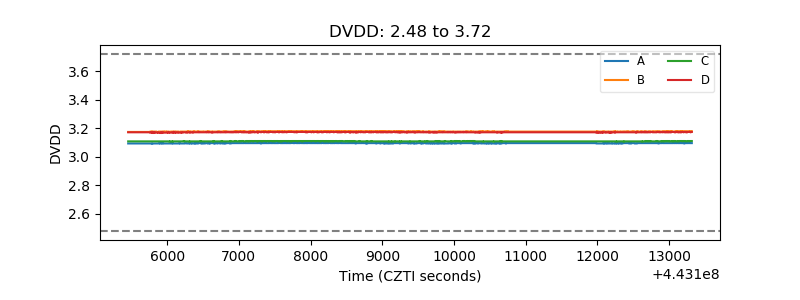 |
| Temperature 1 | 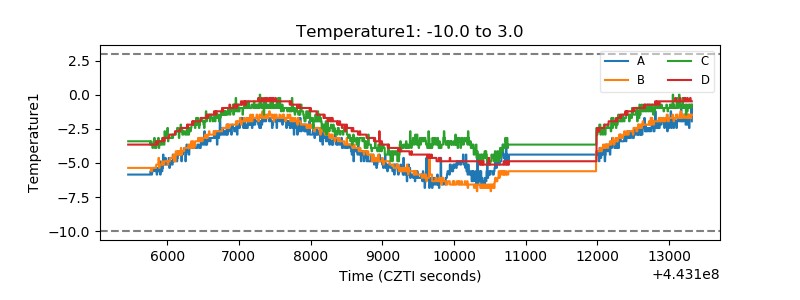 |
| Veto HV Monitor | 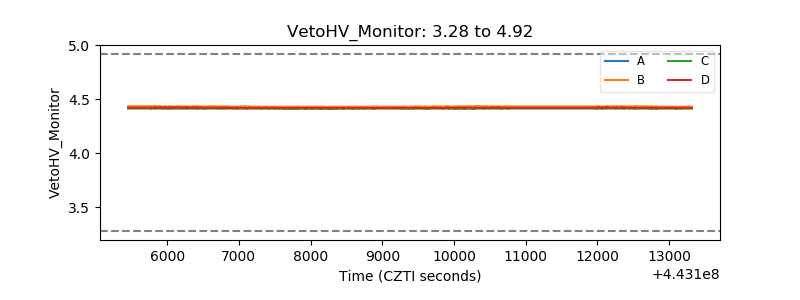 |
| Veto LLD | 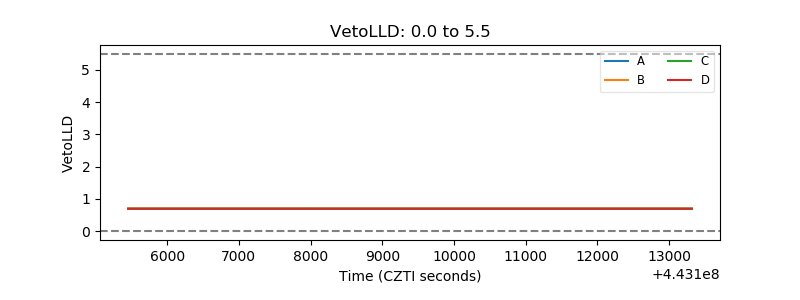 |
| Alpha Counter | 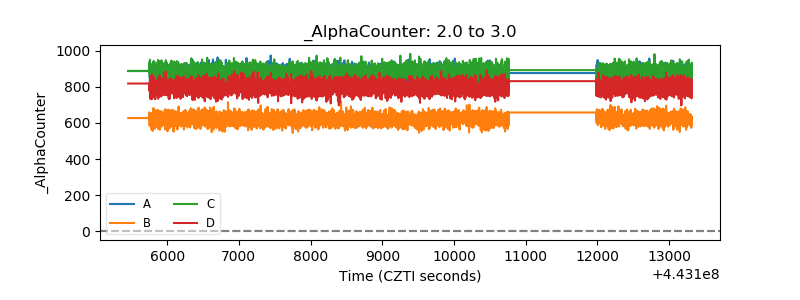 |
| _CPM_Rate | 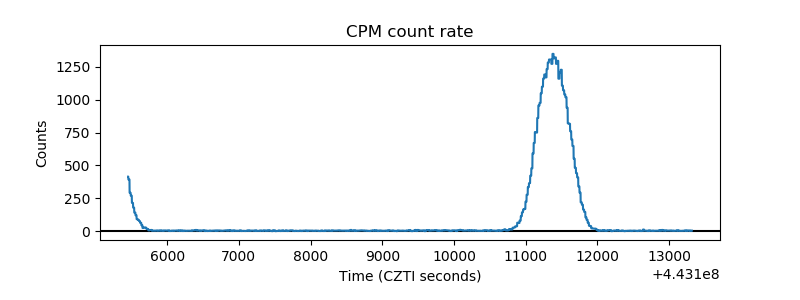 |
| CZT Counter | 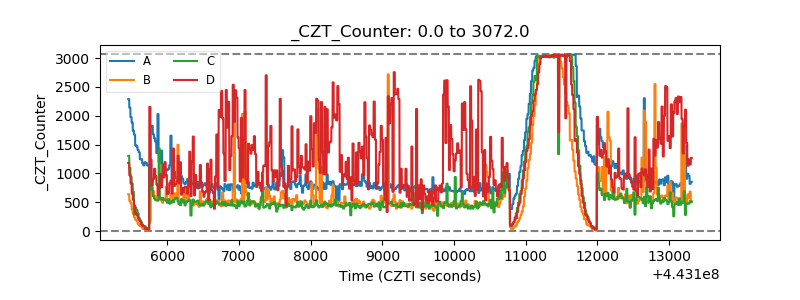 |
| +2.5 Volts monitor | 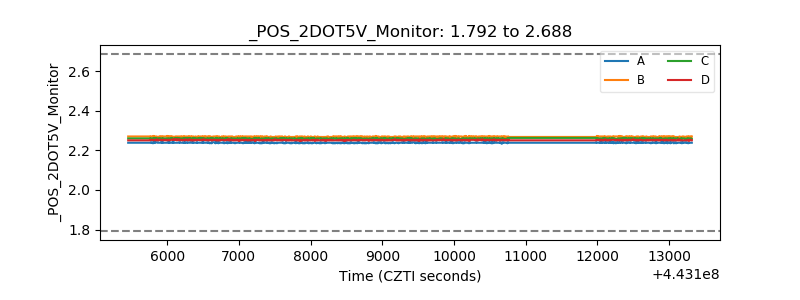 |
| +5 Volts monitor | 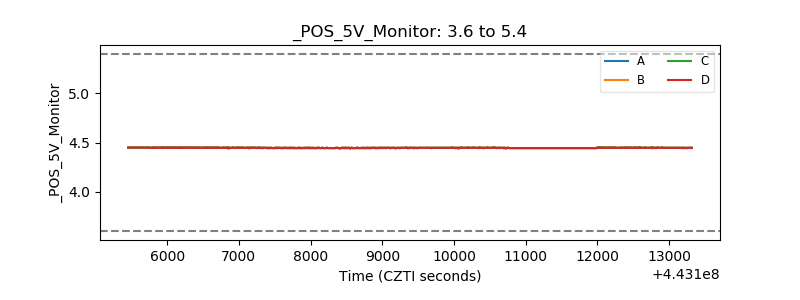 |
| _ROLL_ROT | 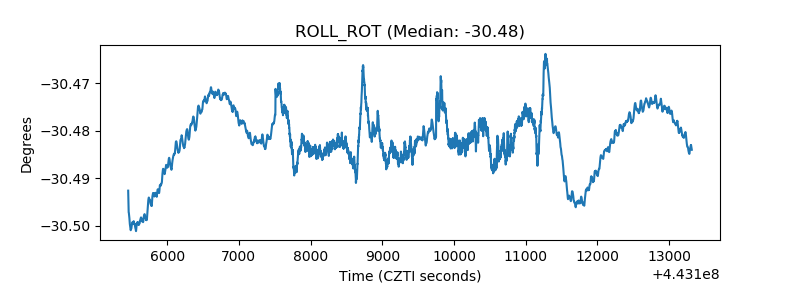 |
| _Roll_DEC | 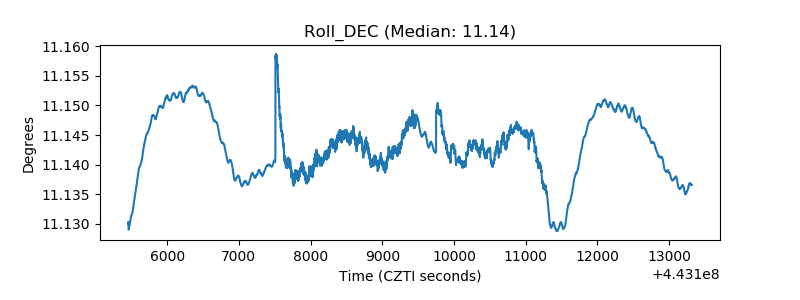 |
| _Roll_RA | 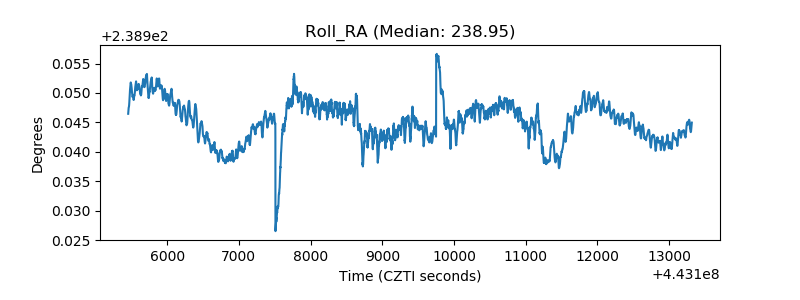 |
| Veto Counter | 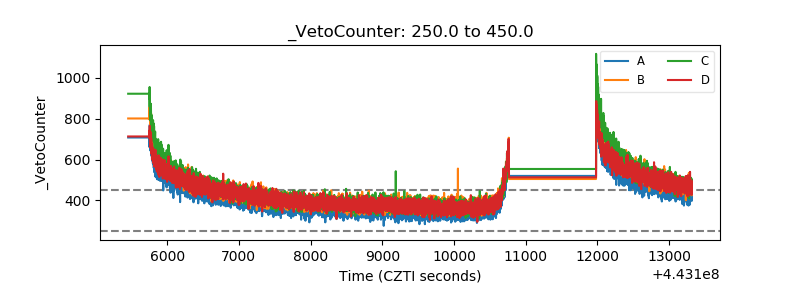 |