| Param | Original file | Final file |
|---|---|---|
| Filename | modeM0/AS1A13_017T02_9000006032_44895cztM0_level2.fits | modeM0/AS1A13_017T02_9000006032_44895cztM0_level2_quad_clean.evt |
| Size (bytes) | 595,915,200 | 117,771,840 |
| Size | 568.3 MB | 112.3 MB |
| Events in quadrant A | 5,838,405 | 797,974 |
| Events in quadrant B | 3,716,107 | 837,314 |
| Events in quadrant C | 3,456,427 | 806,791 |
| Events in quadrant D | 8,539,100 | 665,572 |
| Mode SS | |||
|---|---|---|---|
| Quadrant | BADHDUFLAG | Total packets | Discarded packets |
| A | 0 | 134 | 0 |
| B | 0 | 134 | 0 |
| C | 0 | 134 | 0 |
| D | 0 | 134 | 0 |
| Mode M0 | |||
|---|---|---|---|
| Quadrant | BADHDUFLAG | Total packets | Discarded packets |
| A | 0 | 21852 | 2 |
| B | 0 | 15328 | 2 |
| C | 0 | 14438 | 3 |
| D | 0 | 30009 | 2 |
| Mode M9 | |||
|---|---|---|---|
| Quadrant | BADHDUFLAG | Total packets | Discarded packets |
| A | 0 | 12 | 0 |
| B | 0 | 12 | 0 |
| C | 0 | 12 | 0 |
| D | 0 | 12 | 0 |
| Quadrant | Total seconds | Saturated seconds | Saturation percentage |
|---|---|---|---|
| A | 6571 | 309 | 4.702481% |
| B | 6572 | 179 | 2.723676% |
| C | 6571 | 152 | 2.313194% |
| D | 6571 | 1024 | 15.583625% |
Noise dominated data is calculated using 1-second bins in cleaned event files. If a bin has >2000 counts, and if more than 50% of those come from <1% of pixels, then it is considered to be noise-dominated and hence unusable.
| Quadrant | # 1 sec bins | Bins with >0 counts | Bins with >2000 counts | High rate bins dominated by noise | Noise dominated (total time) | Noise dominated (detector-on time) | Marked lightcurve |
|---|---|---|---|---|---|---|---|
| A | 7756 | 6572 | 37 | 37 | 0.48% | 0.56% | 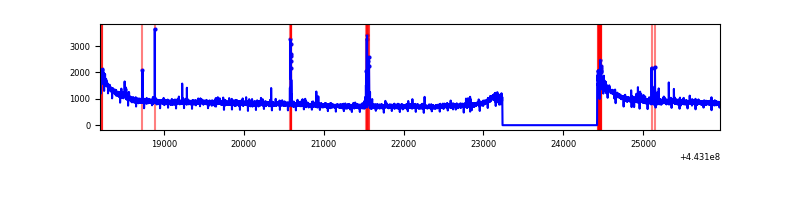 |
| B | 7757 | 6573 | 17 | 17 | 0.22% | 0.26% | 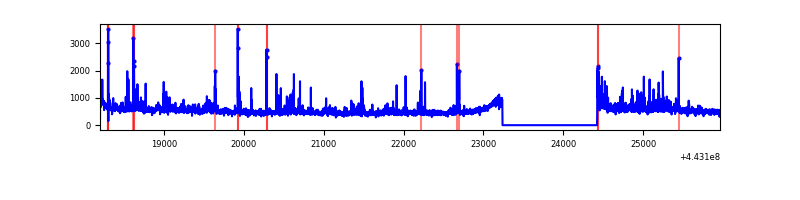 |
| C | 7756 | 6572 | 46 | 46 | 0.59% | 0.70% | 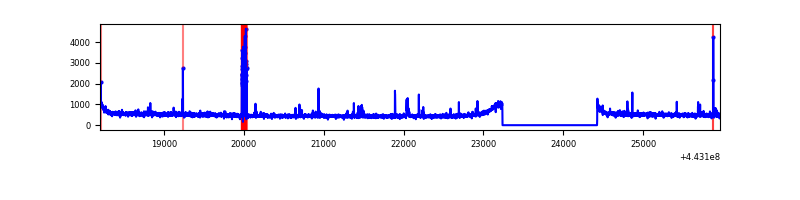 |
| D | 7756 | 6572 | 689 | 689 | 8.88% | 10.48% | 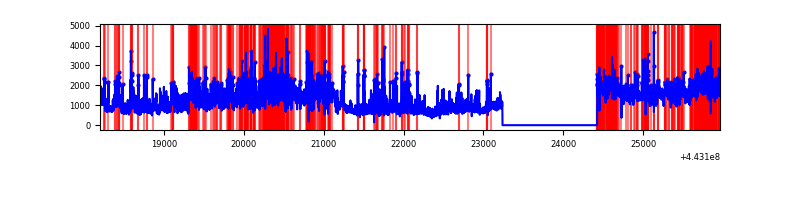 |
Top three noisy pixels from each quadrant. If the there are fewer than three noisy pixels in the level2.evt file, extra rows are filled as -1
| Pixel properties | Quadrant properties | ||||||
|---|---|---|---|---|---|---|---|
| Quadrant | DetID | PixID | Counts | Sigma | Mean | Median | Sigma |
| A | 10 | 83 | 2488509 | 14535.31 | 827 | 811 | 171.1 |
| A | 13 | 248 | 61090 | 352.2 | 827 | 811 | 171.1 |
| A | 10 | 248 | 50018 | 287.51 | 827 | 811 | 171.1 |
| B | 5 | 255 | 133147 | 811.61 | 830 | 805 | 163.1 |
| B | 0 | 168 | 52434 | 316.63 | 830 | 805 | 163.1 |
| B | 0 | 190 | 50021 | 301.83 | 830 | 805 | 163.1 |
| C | 12 | 2 | 204709 | 1061.81 | 822 | 829 | 192.0 |
| C | 3 | 233 | 17971 | 89.28 | 822 | 829 | 192.0 |
| C | 2 | 14 | 8092 | 37.83 | 822 | 829 | 192.0 |
| D | 13 | 174 | 1734577 | 8722.88 | 790 | 766 | 198.8 |
| D | 13 | 187 | 1560380 | 7846.49 | 790 | 766 | 198.8 |
| D | 1 | 52 | 999007 | 5022.2 | 790 | 766 | 198.8 |
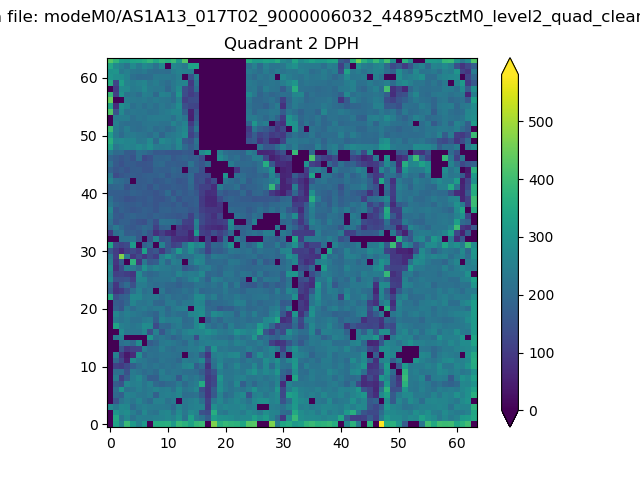
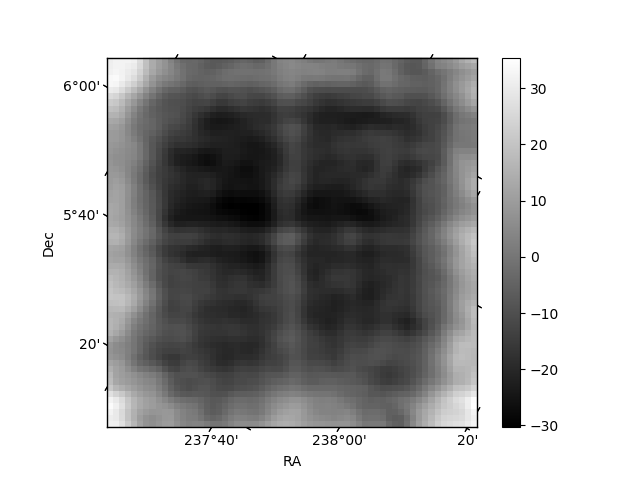
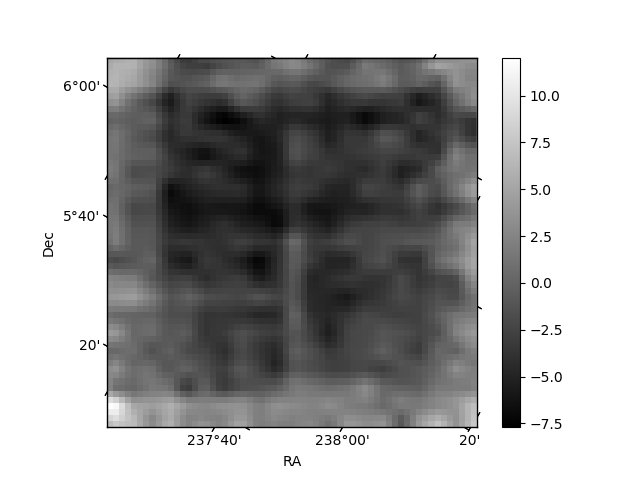
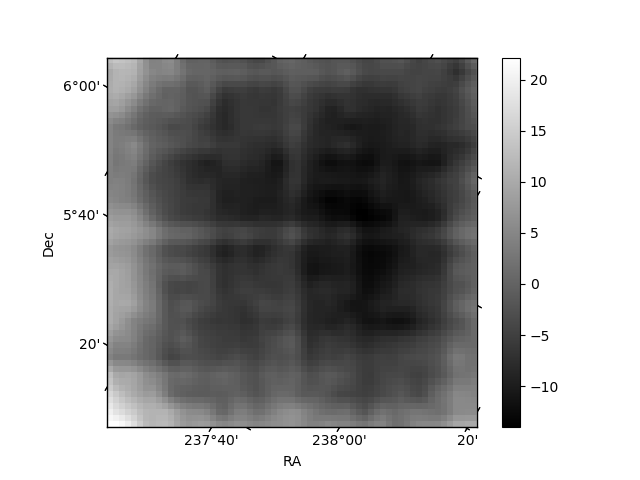
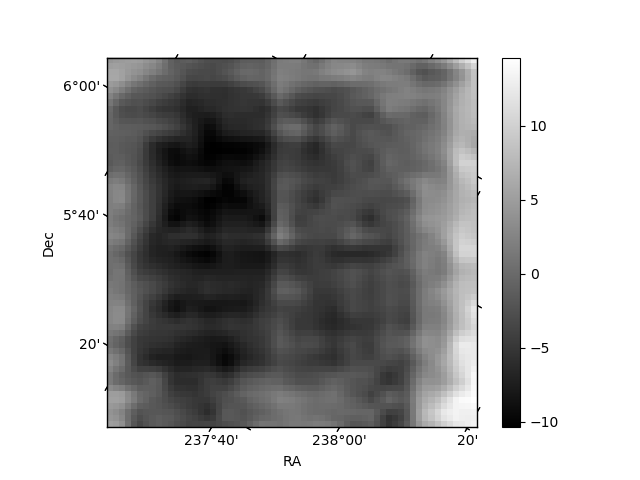
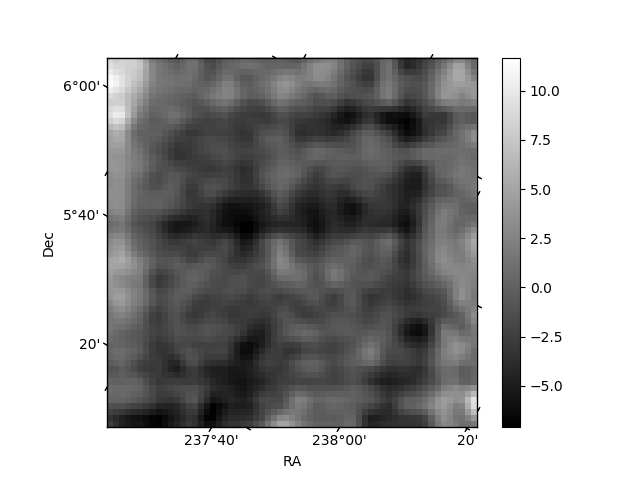
Histogram calculated using DETX and DETY for each event in the final _common_clean file
| Quadrant A | 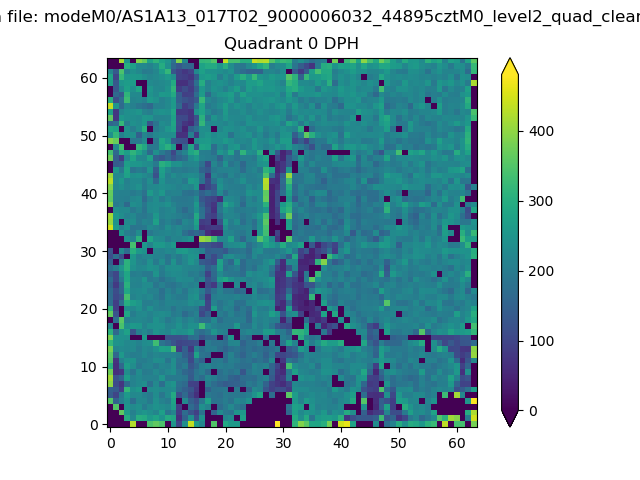 |
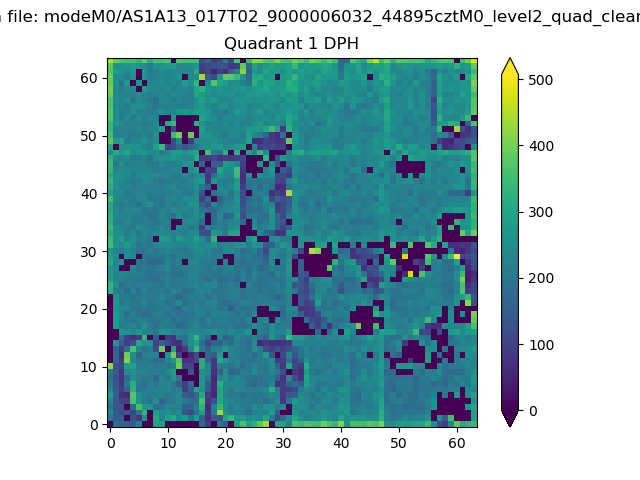 |
Quadrant B |
|---|---|---|---|
| Quadrant D | 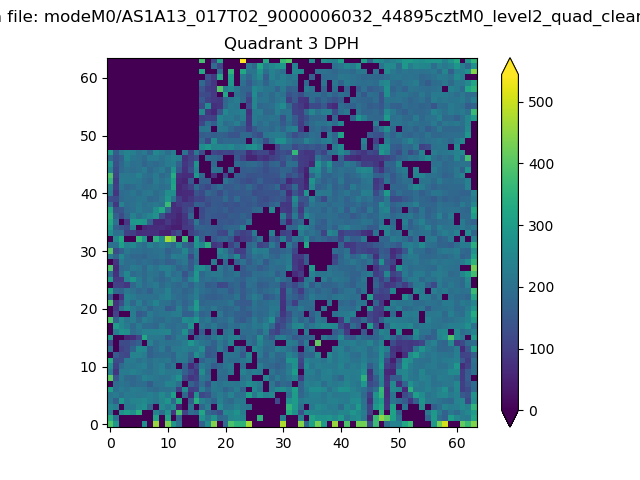 |
 |
Quadrant C |
| Plot type | Count rate plots | Images |
|---|---|---|
| Comparison with Poisson distribution Blue bars denote a histogram of data divided into 1 sec bins. Red curve is a Poisson curve with rate = median count rate of data. |
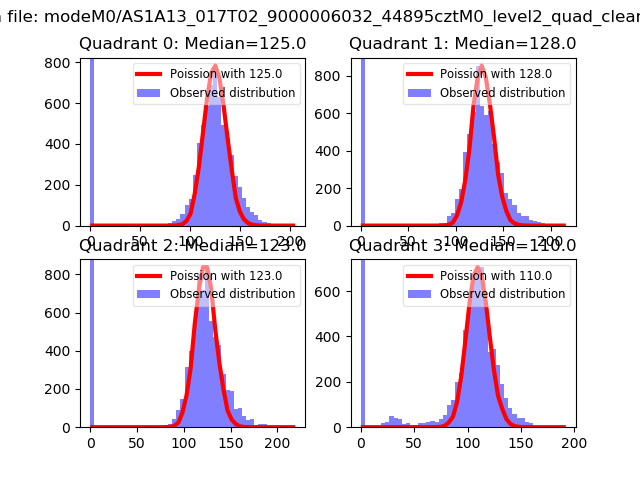 |
 |
| Quadrant-wise count rates Data is divided into 100 sec bins |
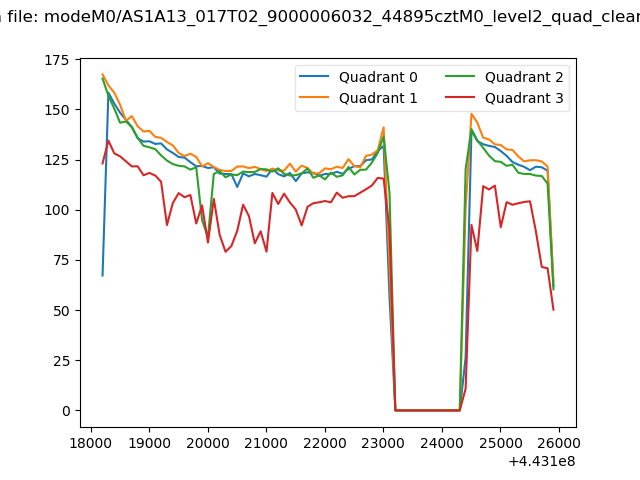 |
|
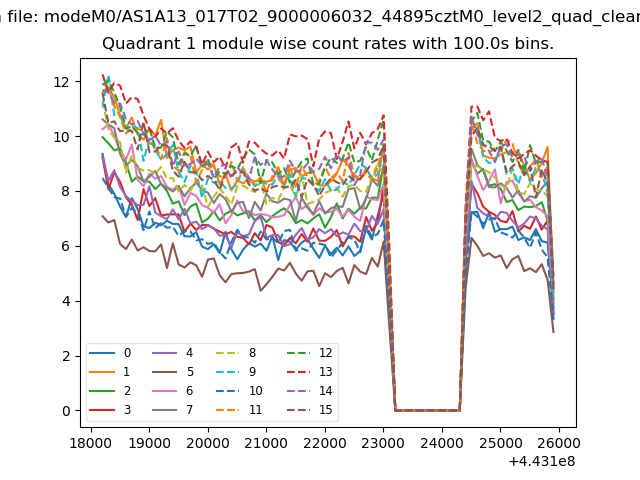
| Module-wise count rates for Quadrant A Data is divided into 100 sec bins |
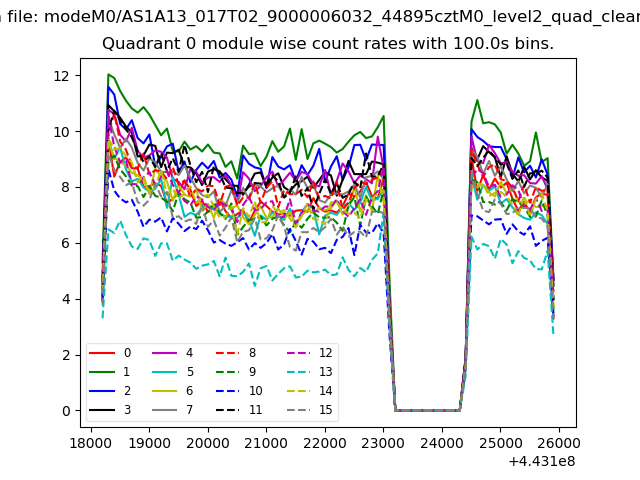 |
 |
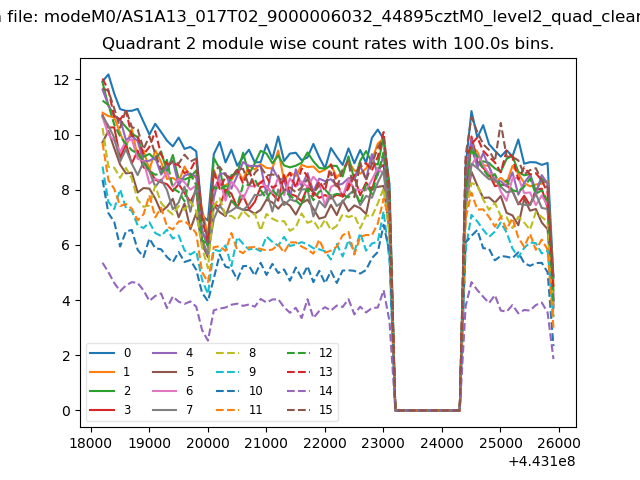
| Module-wise count rates for Quadrant B Data is divided into 100 sec bins |
 |
 |
| Module-wise count rates for Quadrant C Data is divided into 100 sec bins |
 |
 |
| Module-wise count rates for Quadrant D Data is divided into 100 sec bins |
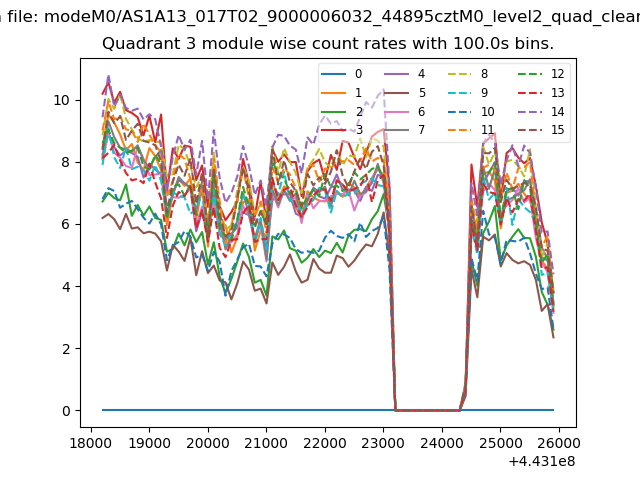 |
 |
| Parameter | Plot |
|---|---|
| CZT HV Monitor | 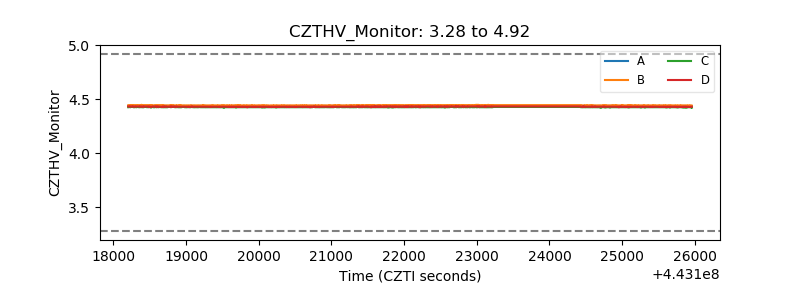 |
| D_VDD | 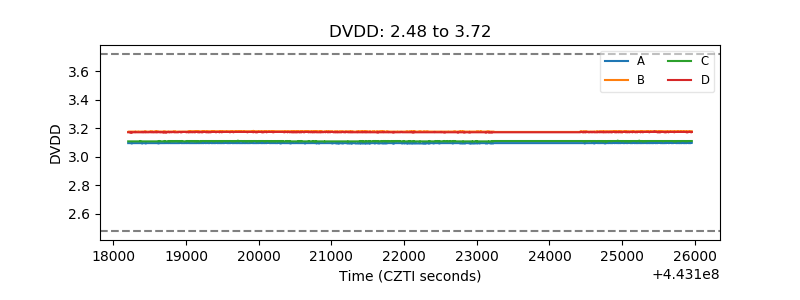 |
| Temperature 1 | 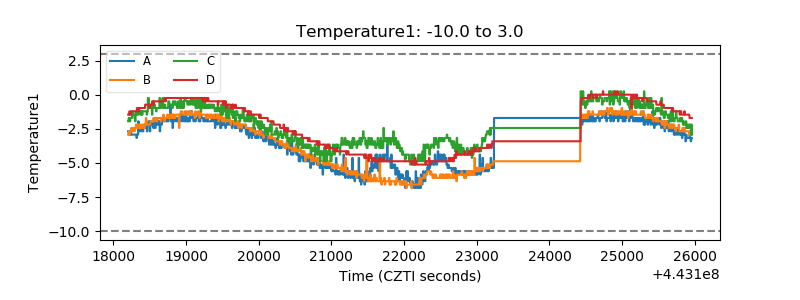 |
| Veto HV Monitor | 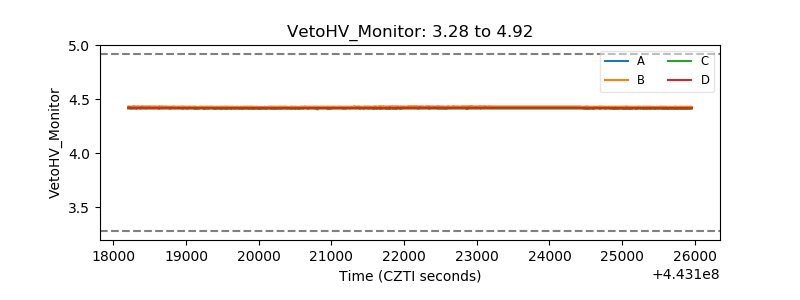 |
| Veto LLD | 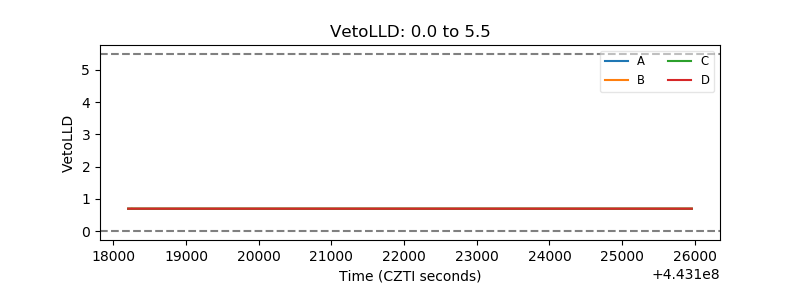 |
| Alpha Counter | 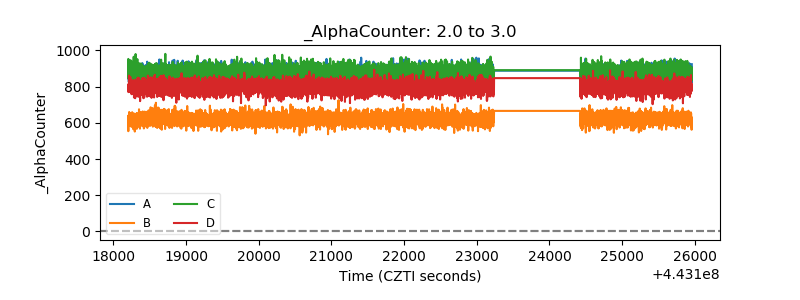 |
| _CPM_Rate | 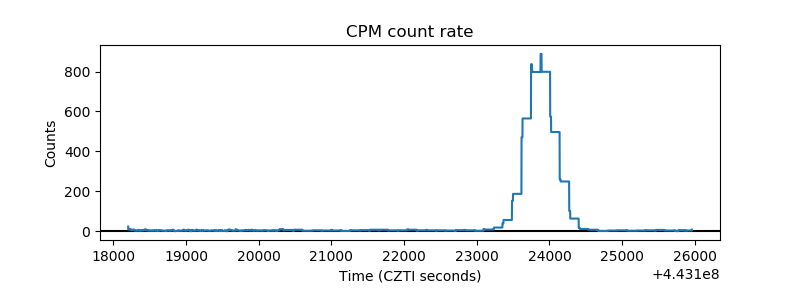 |
| CZT Counter | 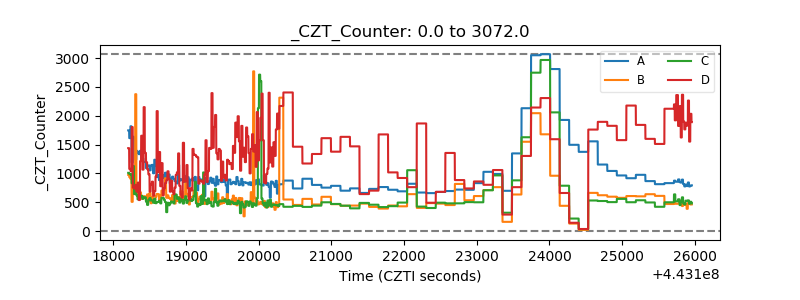 |
| +2.5 Volts monitor | 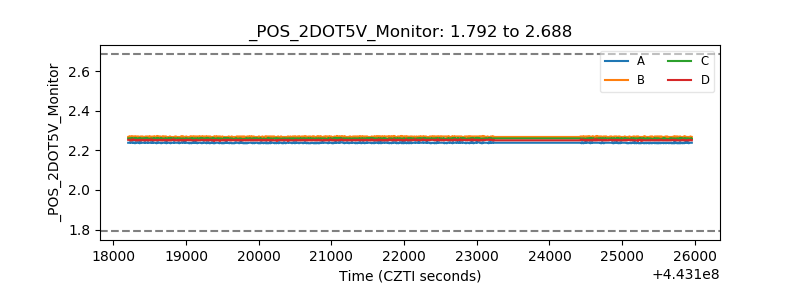 |
| +5 Volts monitor | 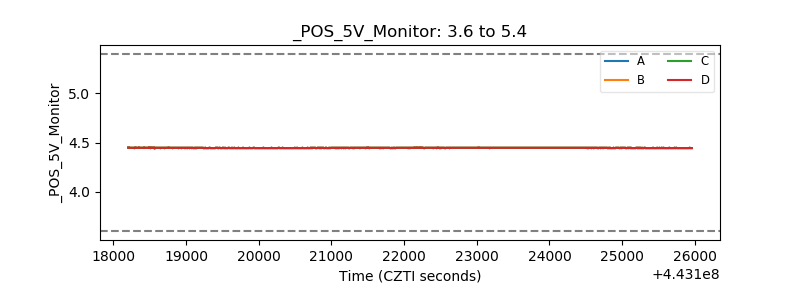 |
| _ROLL_ROT | 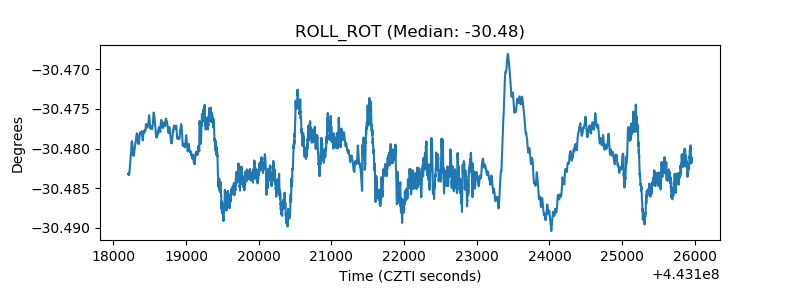 |
| _Roll_DEC | 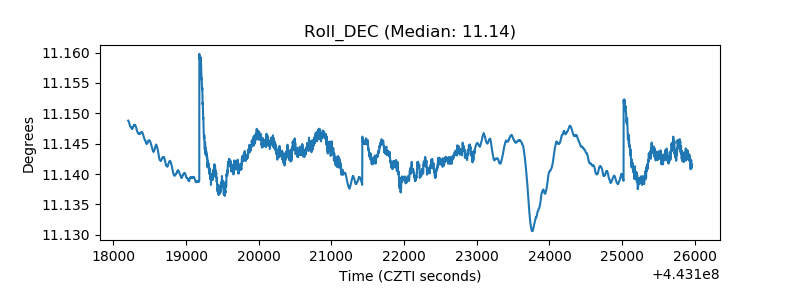 |
| _Roll_RA | 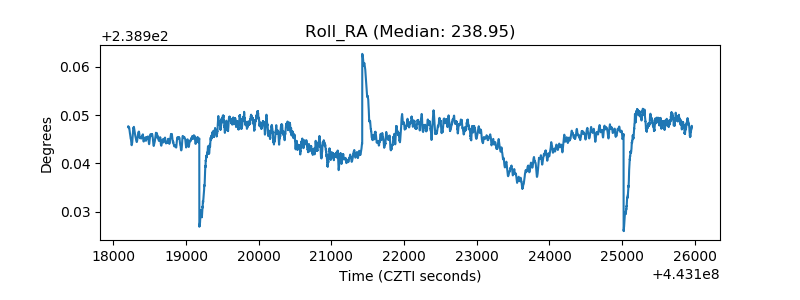 |
| Veto Counter | 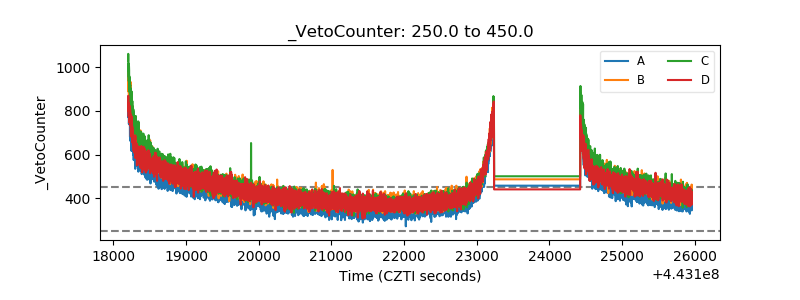 |