| Param | Original file | Final file |
|---|---|---|
| Filename | modeM0/AS1A13_017T02_9000006032_44896cztM0_level2.fits | modeM0/AS1A13_017T02_9000006032_44896cztM0_level2_quad_clean.evt |
| Size (bytes) | 650,603,520 | 108,780,480 |
| Size | 620.5 MB | 103.7 MB |
| Events in quadrant A | 5,812,911 | 760,202 |
| Events in quadrant B | 3,748,302 | 792,954 |
| Events in quadrant C | 3,312,640 | 773,255 |
| Events in quadrant D | 10,695,584 | 504,504 |
| Mode SS | |||
|---|---|---|---|
| Quadrant | BADHDUFLAG | Total packets | Discarded packets |
| A | 0 | 136 | 0 |
| B | 0 | 136 | 0 |
| C | 0 | 136 | 0 |
| D | 0 | 136 | 0 |
| Mode M0 | |||
|---|---|---|---|
| Quadrant | BADHDUFLAG | Total packets | Discarded packets |
| A | 0 | 22067 | 2 |
| B | 0 | 15560 | 2 |
| C | 0 | 14253 | 2 |
| D | 0 | 36368 | 2 |
| Mode M9 | |||
|---|---|---|---|
| Quadrant | BADHDUFLAG | Total packets | Discarded packets |
| A | 0 | 13 | 0 |
| B | 0 | 14 | 0 |
| C | 0 | 14 | 0 |
| D | 0 | 14 | 0 |
| Quadrant | Total seconds | Saturated seconds | Saturation percentage |
|---|---|---|---|
| A | 6635 | 338 | 5.094197% |
| B | 6635 | 218 | 3.285607% |
| C | 6635 | 103 | 1.552374% |
| D | 6634 | 2293 | 34.564365% |
Noise dominated data is calculated using 1-second bins in cleaned event files. If a bin has >2000 counts, and if more than 50% of those come from <1% of pixels, then it is considered to be noise-dominated and hence unusable.
| Quadrant | # 1 sec bins | Bins with >0 counts | Bins with >2000 counts | High rate bins dominated by noise | Noise dominated (total time) | Noise dominated (detector-on time) | Marked lightcurve |
|---|---|---|---|---|---|---|---|
| A | 7695 | 6636 | 41 | 41 | 0.53% | 0.62% | 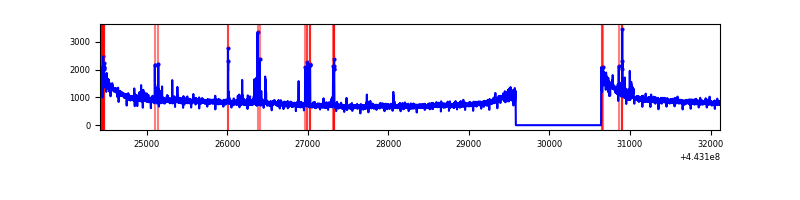 |
| B | 7695 | 6636 | 47 | 47 | 0.61% | 0.71% | 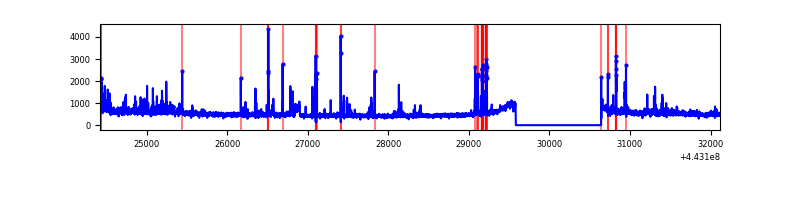 |
| C | 7695 | 6636 | 6 | 6 | 0.08% | 0.09% | 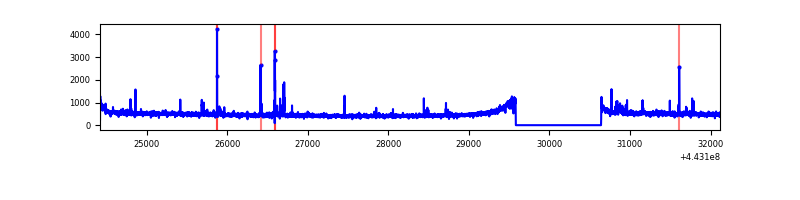 |
| D | 7694 | 6635 | 1974 | 1974 | 25.66% | 29.75% | 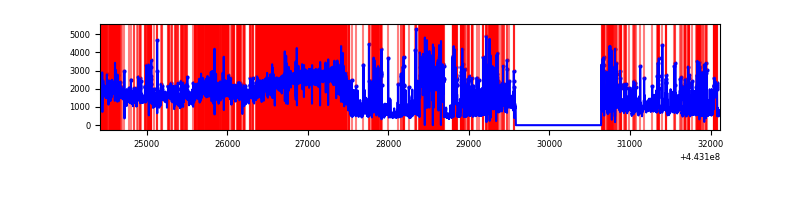 |
Top three noisy pixels from each quadrant. If the there are fewer than three noisy pixels in the level2.evt file, extra rows are filled as -1
| Pixel properties | Quadrant properties | ||||||
|---|---|---|---|---|---|---|---|
| Quadrant | DetID | PixID | Counts | Sigma | Mean | Median | Sigma |
| A | 10 | 83 | 2512076 | 14972.18 | 808 | 792 | 167.7 |
| A | 10 | 248 | 48216 | 282.74 | 808 | 792 | 167.7 |
| A | 7 | 3 | 42991 | 251.59 | 808 | 792 | 167.7 |
| B | 5 | 255 | 255373 | 1587.24 | 811 | 788 | 160.4 |
| B | 0 | 168 | 70088 | 432.06 | 811 | 788 | 160.4 |
| B | 0 | 183 | 55898 | 343.59 | 811 | 788 | 160.4 |
| C | 12 | 2 | 63049 | 328.93 | 808 | 817 | 189.2 |
| C | 9 | 54 | 45707 | 237.27 | 808 | 817 | 189.2 |
| C | 3 | 233 | 14015 | 69.76 | 808 | 817 | 189.2 |
| D | 13 | 187 | 3848445 | 21769.76 | 701 | 681 | 176.7 |
| D | 1 | 52 | 1243568 | 7031.97 | 701 | 681 | 176.7 |
| D | 2 | 249 | 1139782 | 6444.77 | 701 | 681 | 176.7 |
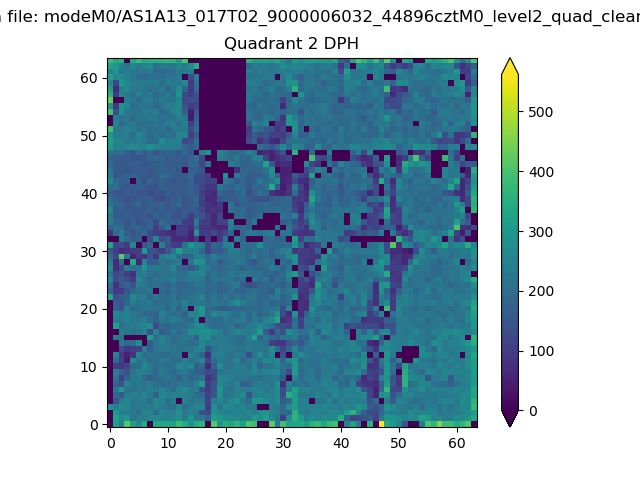
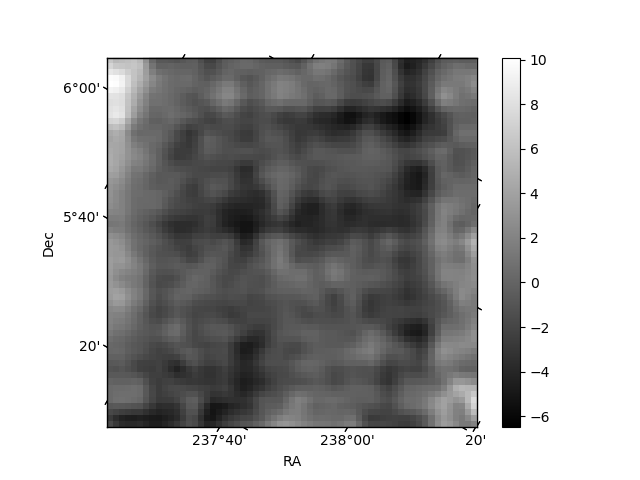
Histogram calculated using DETX and DETY for each event in the final _common_clean file
| Quadrant A | 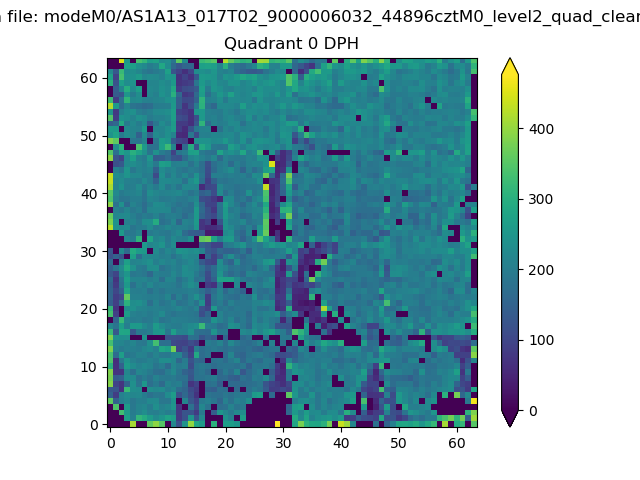 |
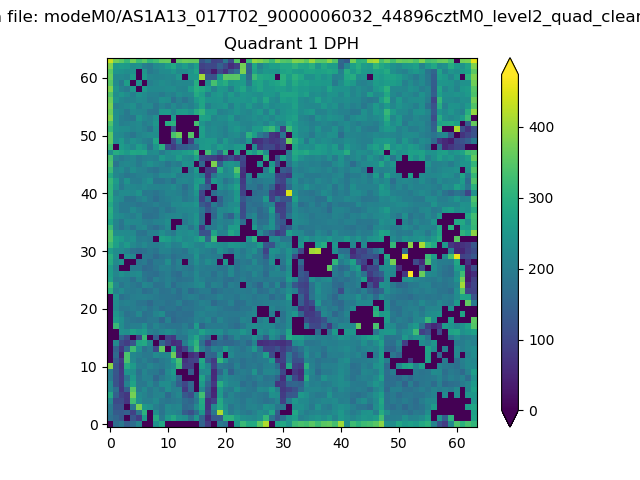 |
Quadrant B |
|---|---|---|---|
| Quadrant D | 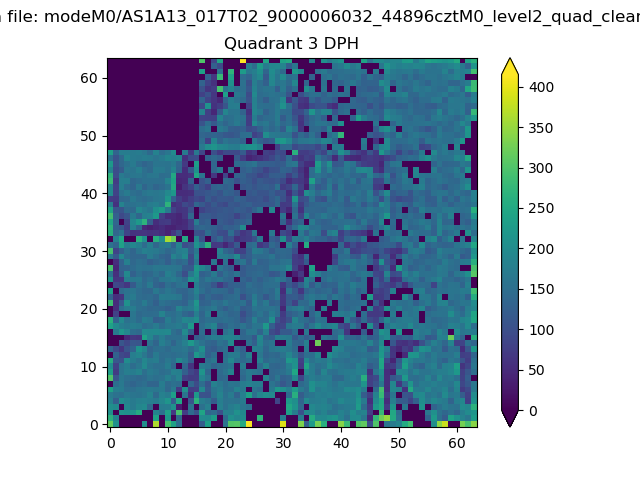 |
 |
Quadrant C |
| Plot type | Count rate plots | Images |
|---|---|---|
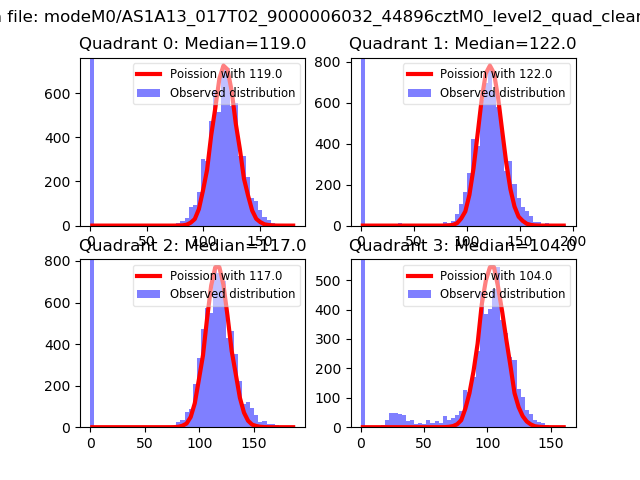
| Comparison with Poisson distribution Blue bars denote a histogram of data divided into 1 sec bins. Red curve is a Poisson curve with rate = median count rate of data. |
 |
 |
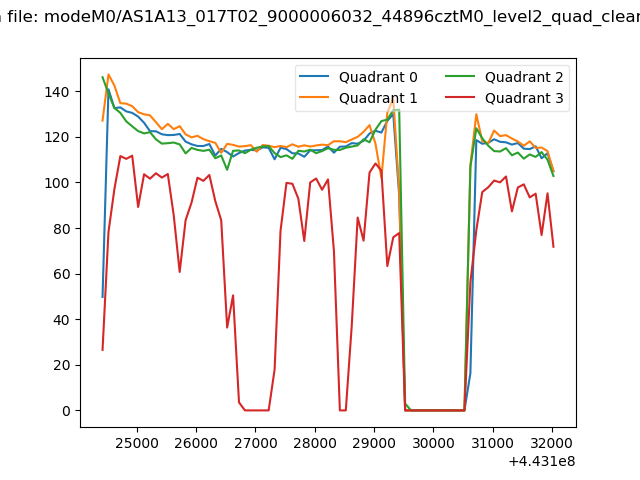
| Quadrant-wise count rates Data is divided into 100 sec bins |
 |
|
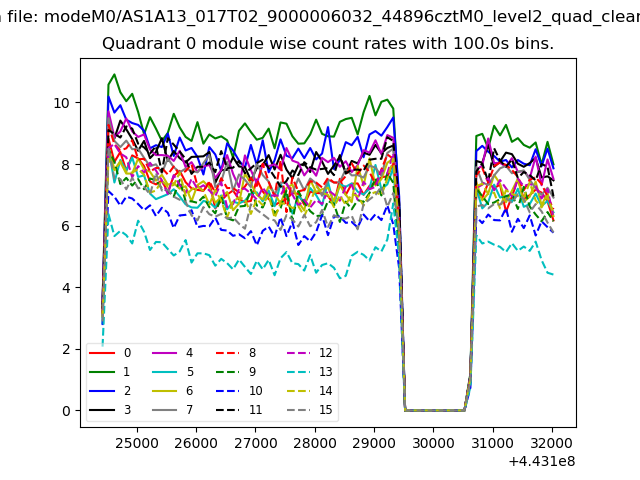
| Module-wise count rates for Quadrant A Data is divided into 100 sec bins |
 |
 |
| Module-wise count rates for Quadrant B Data is divided into 100 sec bins |
 |
 |
| Module-wise count rates for Quadrant C Data is divided into 100 sec bins |
 |
 |
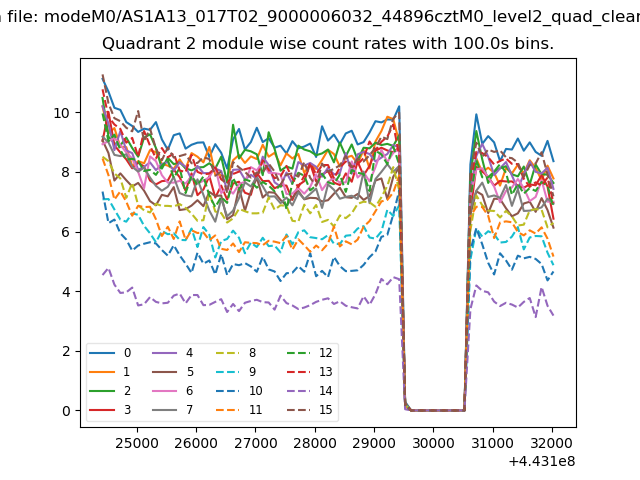
| Module-wise count rates for Quadrant D Data is divided into 100 sec bins |
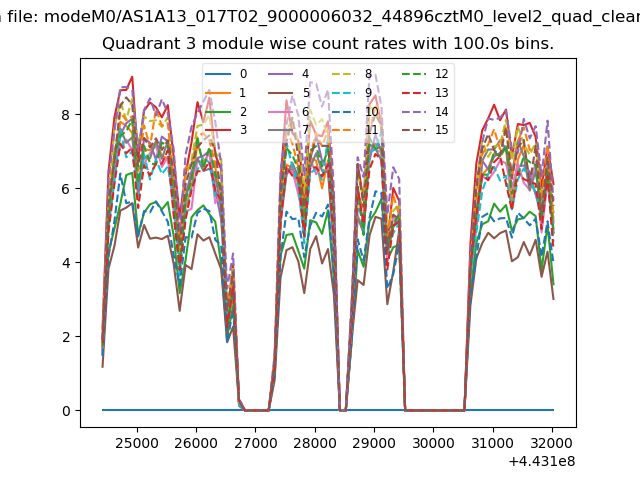 |
 |
| Parameter | Plot |
|---|---|
| CZT HV Monitor |  |
| D_VDD | 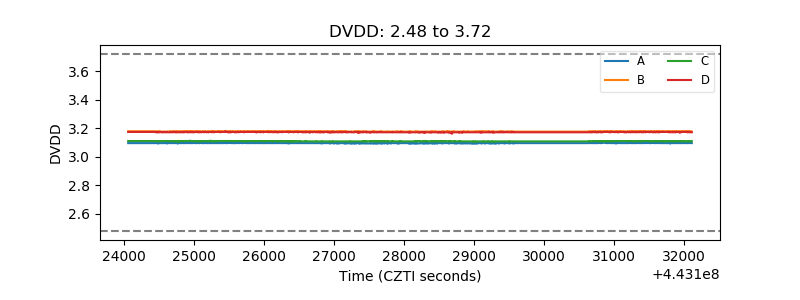 |
| Temperature 1 | 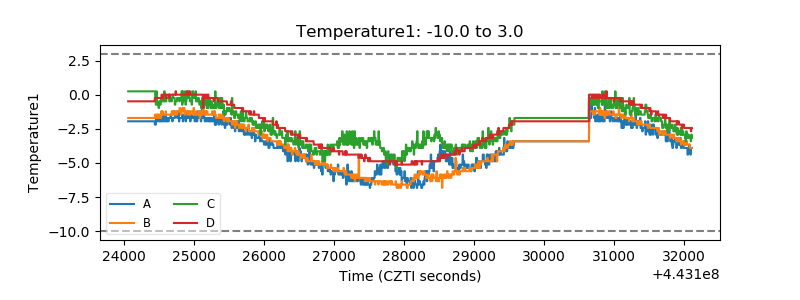 |
| Veto HV Monitor | 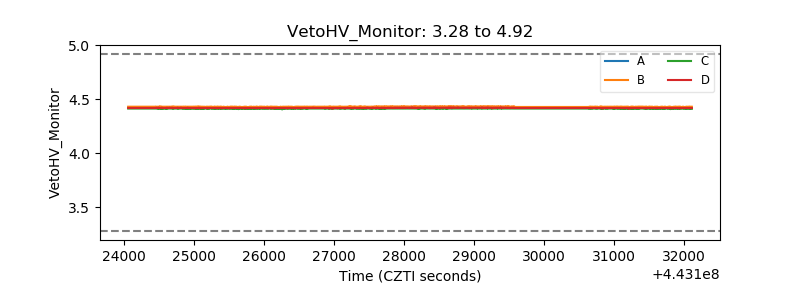 |
| Veto LLD | 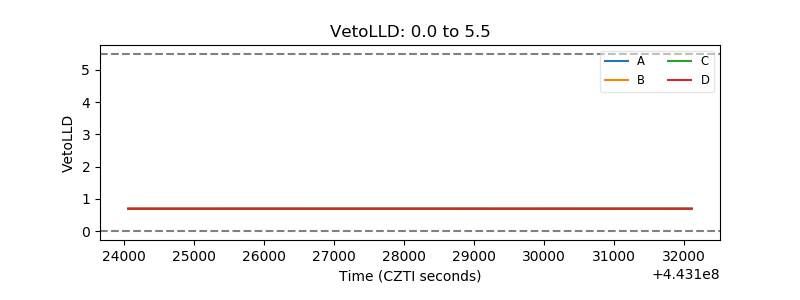 |
| Alpha Counter | 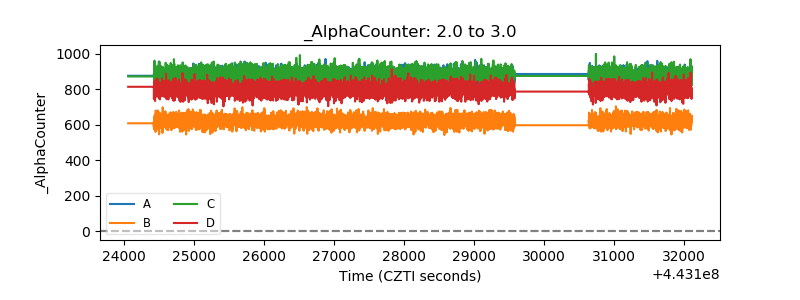 |
| _CPM_Rate | 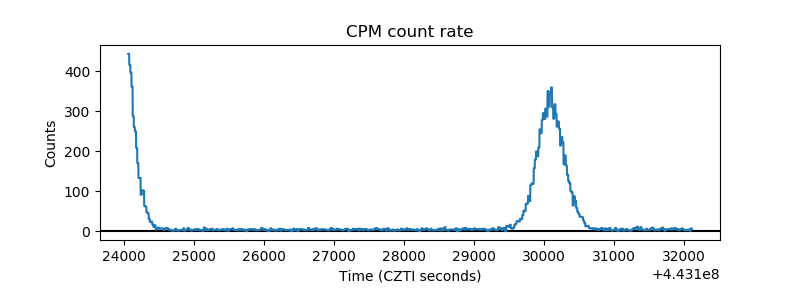 |
| CZT Counter | 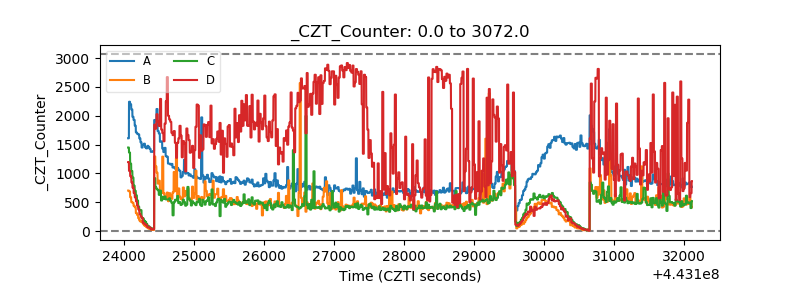 |
| +2.5 Volts monitor | 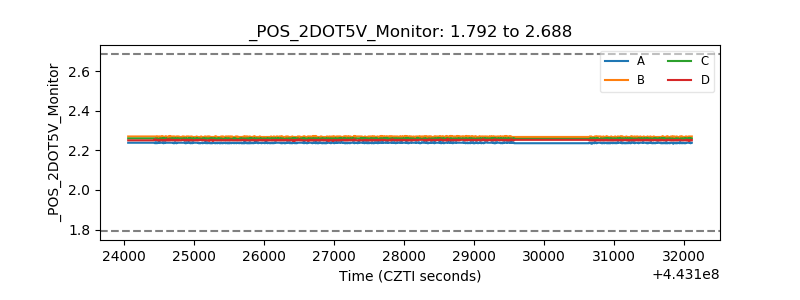 |
| +5 Volts monitor | 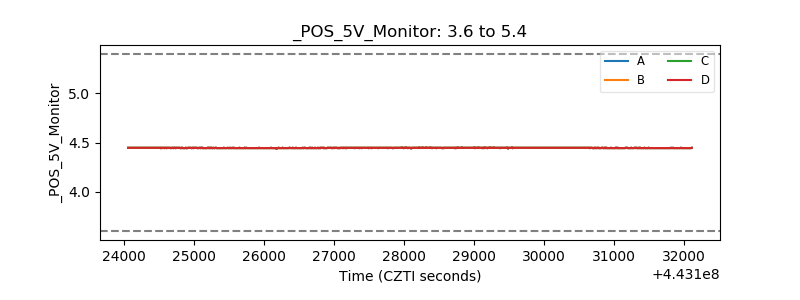 |
| _ROLL_ROT | 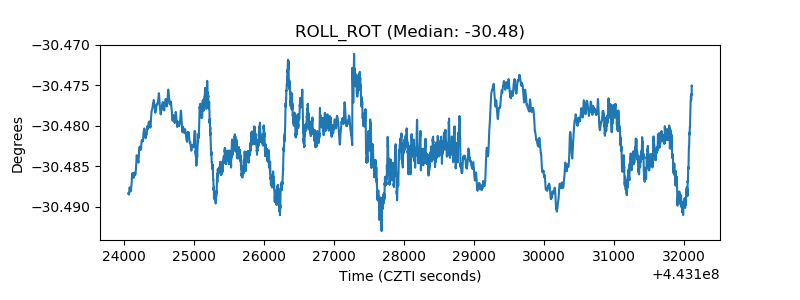 |
| _Roll_DEC | 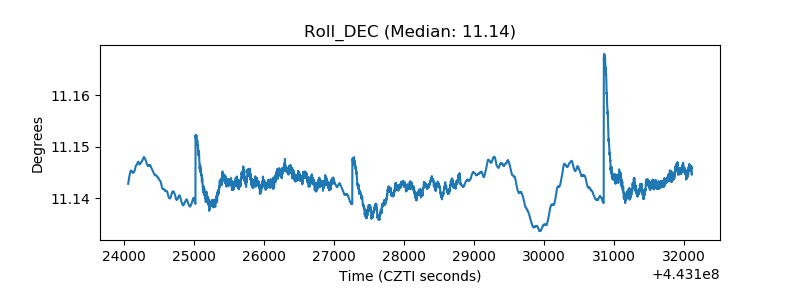 |
| _Roll_RA | 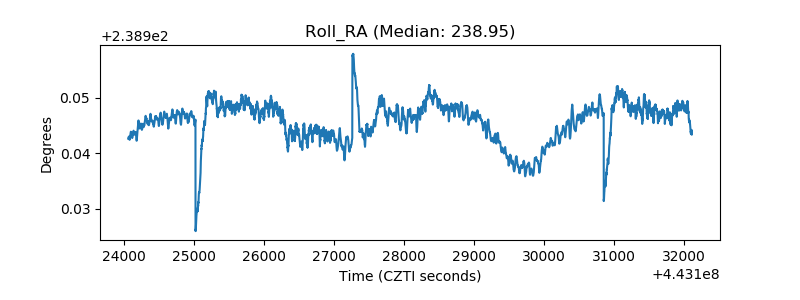 |
| Veto Counter | 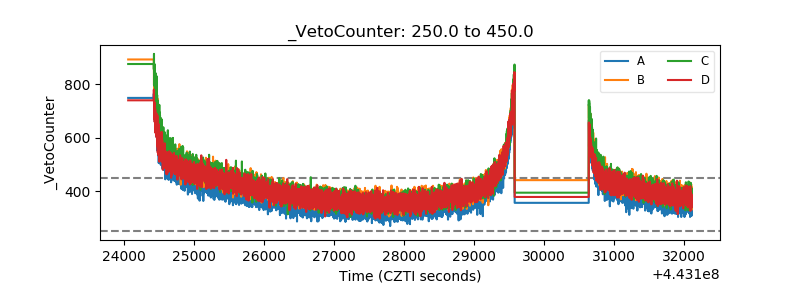 |