| Param | Original file | Final file |
|---|---|---|
| Filename | modeM0/AS1A13_017T02_9000006032_44897cztM0_level2.fits | modeM0/AS1A13_017T02_9000006032_44897cztM0_level2_quad_clean.evt |
| Size (bytes) | 613,854,720 | 108,676,800 |
| Size | 585.4 MB | 103.6 MB |
| Events in quadrant A | 5,568,331 | 745,097 |
| Events in quadrant B | 3,966,520 | 749,624 |
| Events in quadrant C | 3,986,406 | 745,261 |
| Events in quadrant D | 8,675,209 | 576,920 |
| Mode SS | |||
|---|---|---|---|
| Quadrant | BADHDUFLAG | Total packets | Discarded packets |
| A | 0 | 138 | 0 |
| B | 0 | 138 | 0 |
| C | 0 | 138 | 0 |
| D | 0 | 138 | 0 |
| Mode M0 | |||
|---|---|---|---|
| Quadrant | BADHDUFLAG | Total packets | Discarded packets |
| A | 0 | 21708 | 1 |
| B | 0 | 16365 | 1 |
| C | 0 | 16434 | 1 |
| D | 0 | 30534 | 1 |
| Mode M9 | |||
|---|---|---|---|
| Quadrant | BADHDUFLAG | Total packets | Discarded packets |
| A | 0 | 7 | 0 |
| B | 0 | 7 | 0 |
| C | 0 | 7 | 0 |
| D | 0 | 7 | 0 |
| Quadrant | Total seconds | Saturated seconds | Saturation percentage |
|---|---|---|---|
| A | 6794 | 260 | 3.826906% |
| B | 6794 | 364 | 5.357669% |
| C | 6795 | 179 | 2.634290% |
| D | 6795 | 1416 | 20.838852% |
Noise dominated data is calculated using 1-second bins in cleaned event files. If a bin has >2000 counts, and if more than 50% of those come from <1% of pixels, then it is considered to be noise-dominated and hence unusable.
| Quadrant | # 1 sec bins | Bins with >0 counts | Bins with >2000 counts | High rate bins dominated by noise | Noise dominated (total time) | Noise dominated (detector-on time) | Marked lightcurve |
|---|---|---|---|---|---|---|---|
| A | 7474 | 6795 | 15 | 15 | 0.20% | 0.22% | 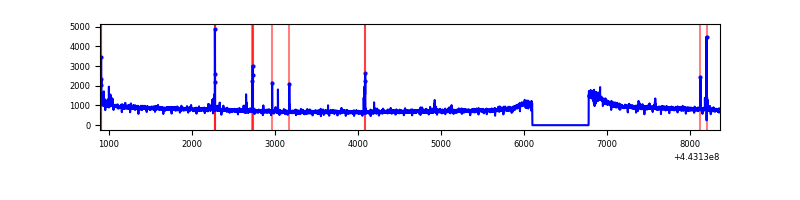 |
| B | 7474 | 6795 | 74 | 74 | 0.99% | 1.09% | 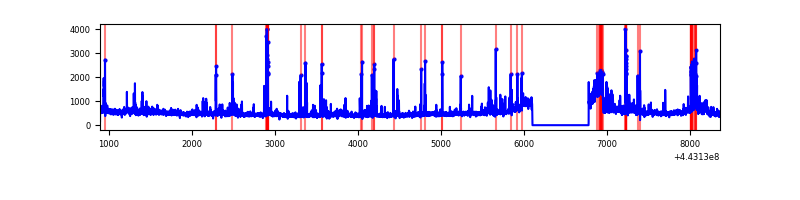 |
| C | 7475 | 6796 | 27 | 27 | 0.36% | 0.40% | 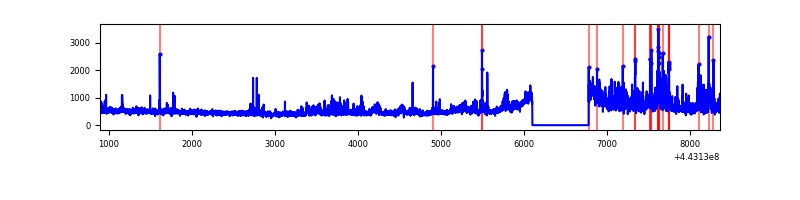 |
| D | 7475 | 6796 | 1083 | 1083 | 14.49% | 15.94% | 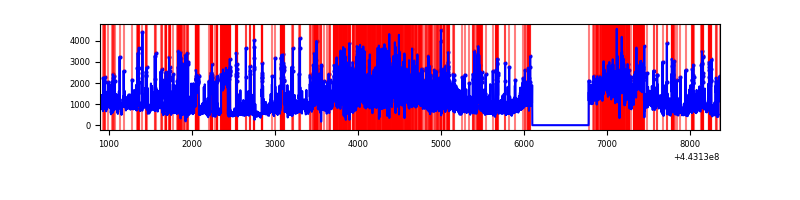 |
Top three noisy pixels from each quadrant. If the there are fewer than three noisy pixels in the level2.evt file, extra rows are filled as -1
| Pixel properties | Quadrant properties | ||||||
|---|---|---|---|---|---|---|---|
| Quadrant | DetID | PixID | Counts | Sigma | Mean | Median | Sigma |
| A | 10 | 83 | 2372905 | 14261.12 | 794 | 777 | 166.3 |
| A | 10 | 248 | 63995 | 380.06 | 794 | 777 | 166.3 |
| A | 13 | 248 | 35007 | 205.79 | 794 | 777 | 166.3 |
| B | 5 | 255 | 172068 | 1093.22 | 789 | 764 | 156.7 |
| B | 0 | 190 | 126716 | 803.8 | 789 | 764 | 156.7 |
| B | 15 | 36 | 120643 | 765.04 | 789 | 764 | 156.7 |
| C | 9 | 54 | 744905 | 4001.6 | 787 | 792 | 186.0 |
| C | 1 | 3 | 69013 | 366.87 | 787 | 792 | 186.0 |
| C | 14 | 254 | 44464 | 234.85 | 787 | 792 | 186.0 |
| D | 13 | 187 | 2154444 | 11575.82 | 734 | 713 | 186.1 |
| D | 1 | 52 | 1365637 | 7336.16 | 734 | 713 | 186.1 |
| D | 5 | 235 | 609426 | 3271.69 | 734 | 713 | 186.1 |
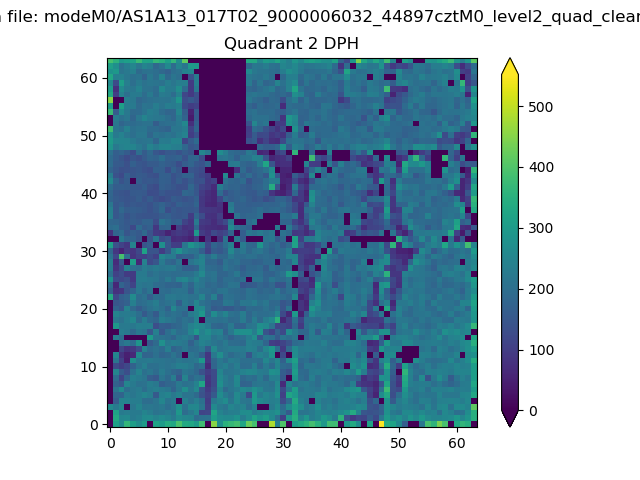
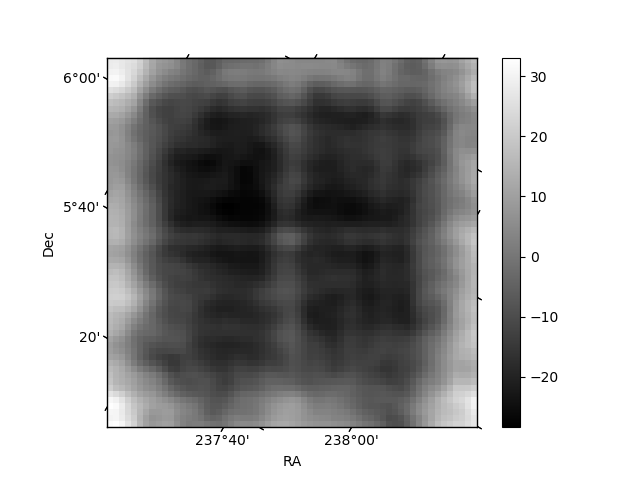
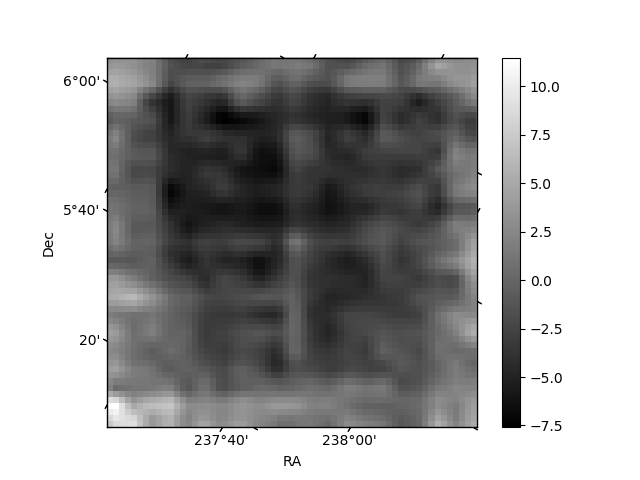
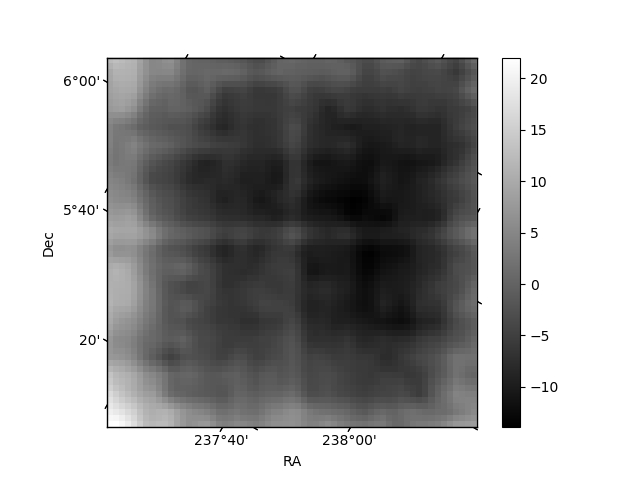
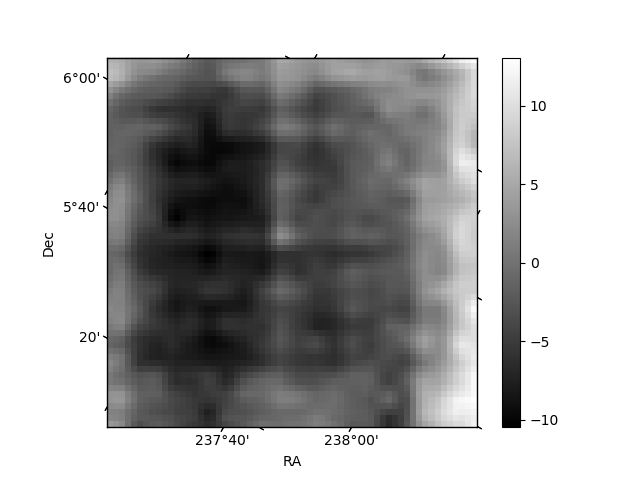
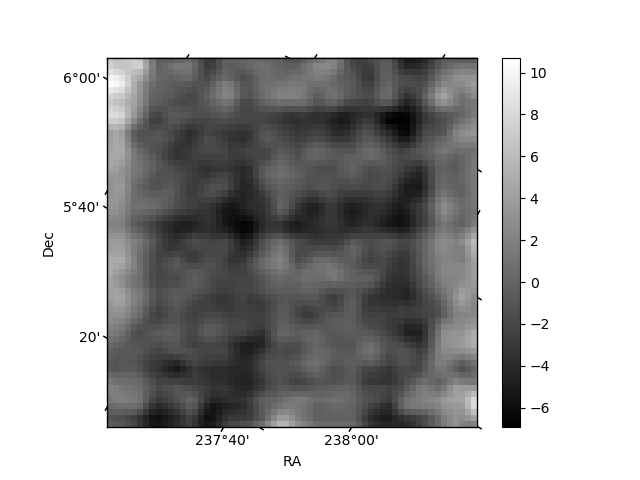
Histogram calculated using DETX and DETY for each event in the final _common_clean file
| Quadrant A | 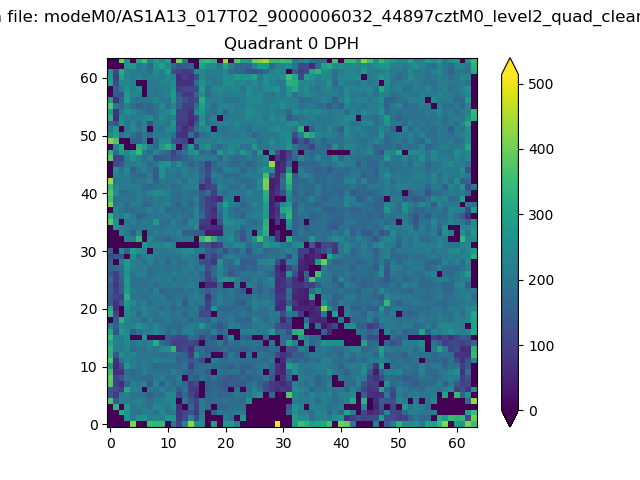 |
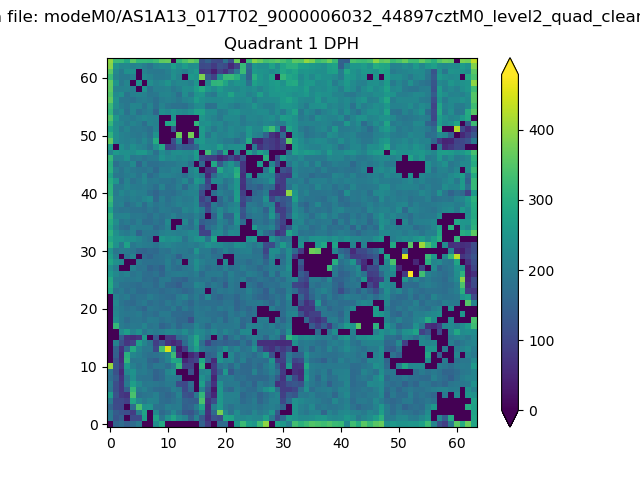 |
Quadrant B |
|---|---|---|---|
| Quadrant D | 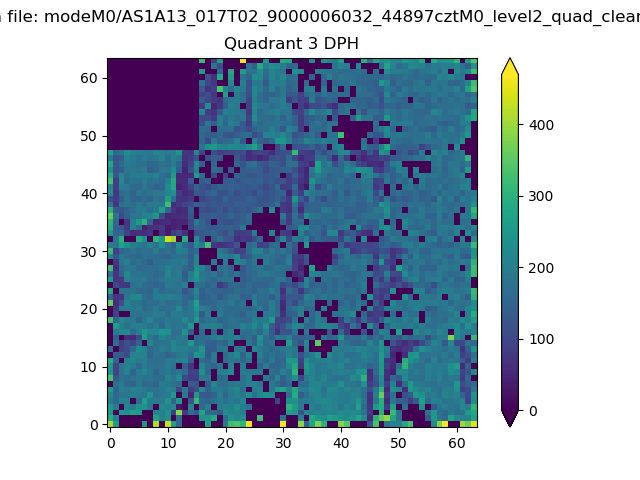 |
 |
Quadrant C |
| Plot type | Count rate plots | Images |
|---|---|---|
| Comparison with Poisson distribution Blue bars denote a histogram of data divided into 1 sec bins. Red curve is a Poisson curve with rate = median count rate of data. |
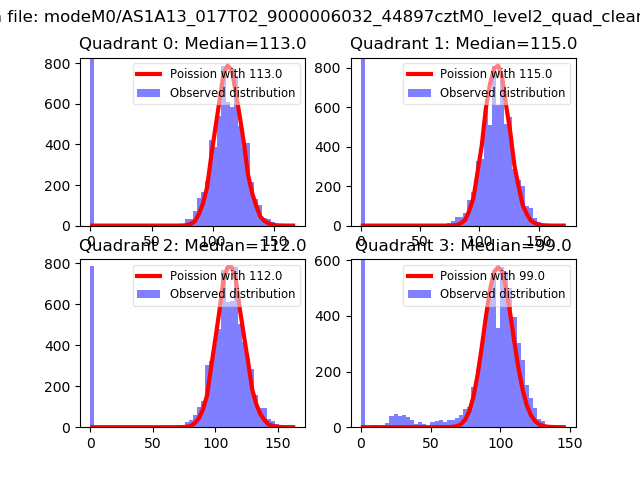 |
 |
| Quadrant-wise count rates Data is divided into 100 sec bins |
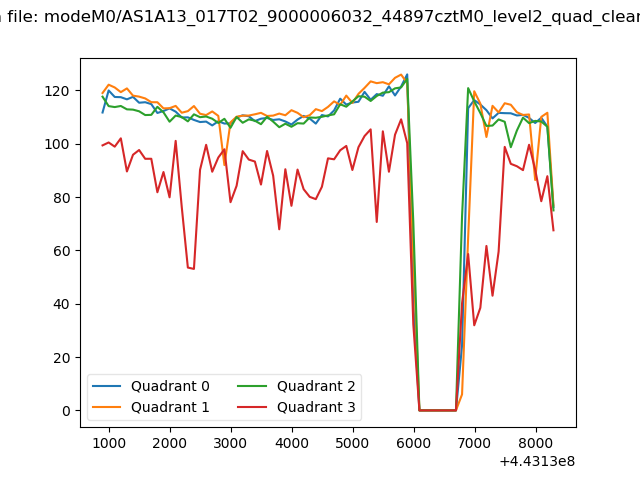 |
|
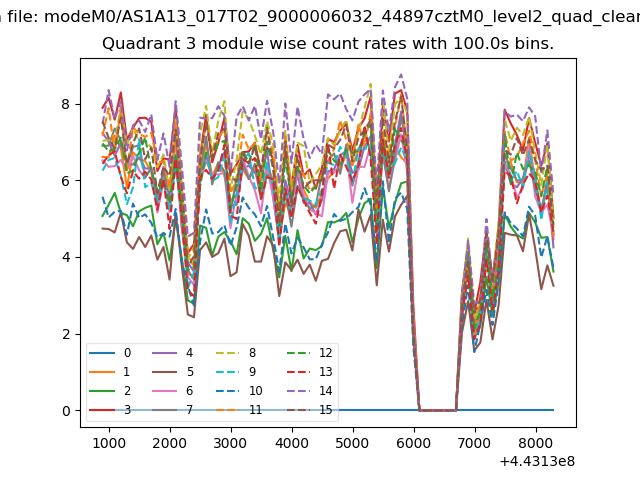
| Module-wise count rates for Quadrant A Data is divided into 100 sec bins |
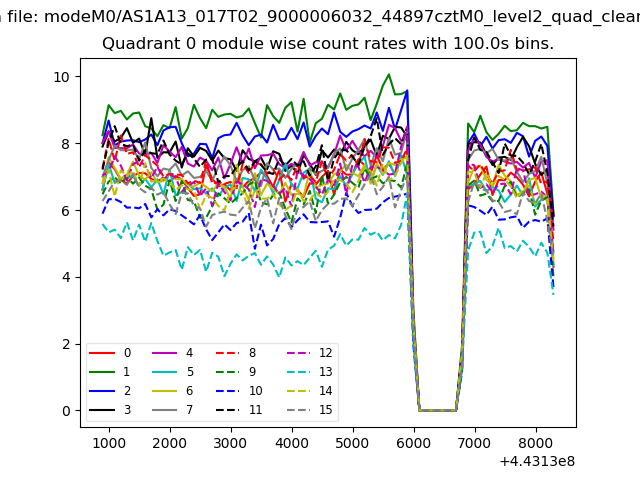 |
 |
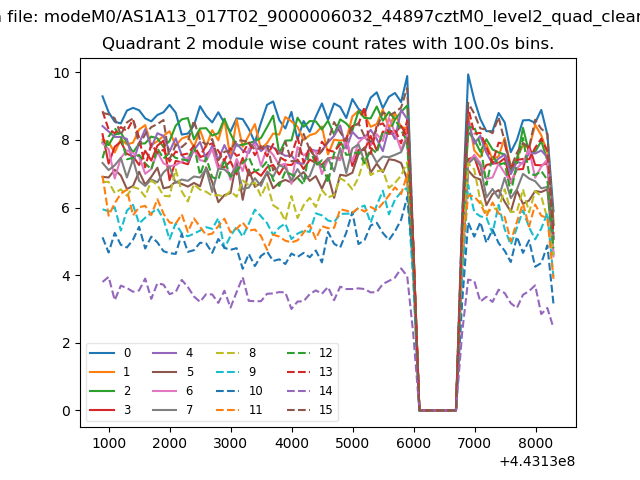
| Module-wise count rates for Quadrant B Data is divided into 100 sec bins |
 |
 |
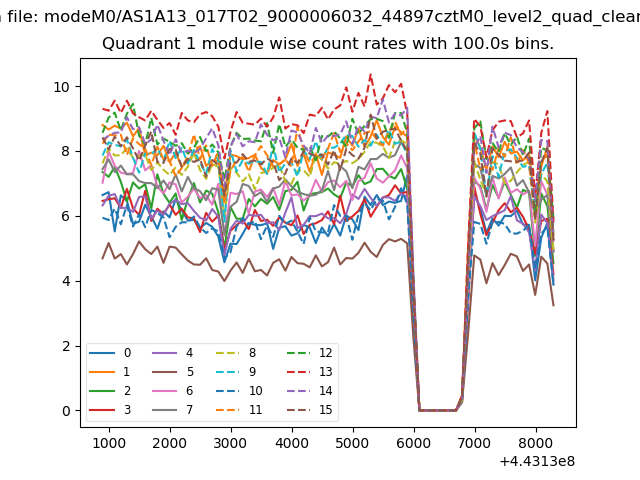
| Module-wise count rates for Quadrant C Data is divided into 100 sec bins |
 |
 |
| Module-wise count rates for Quadrant D Data is divided into 100 sec bins |
 |
 |
| Parameter | Plot |
|---|---|
| CZT HV Monitor | 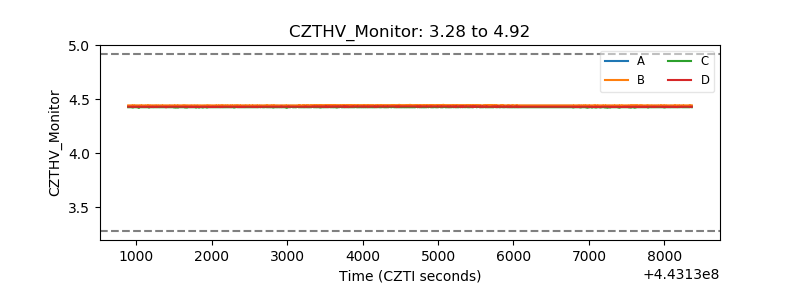 |
| D_VDD | 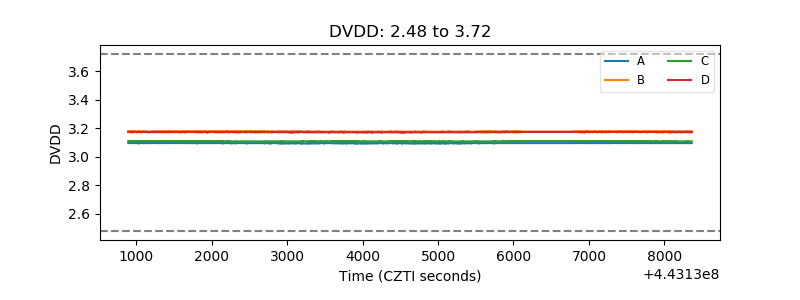 |
| Temperature 1 | 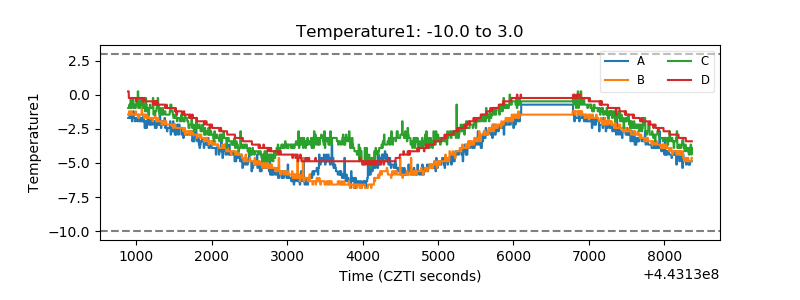 |
| Veto HV Monitor | 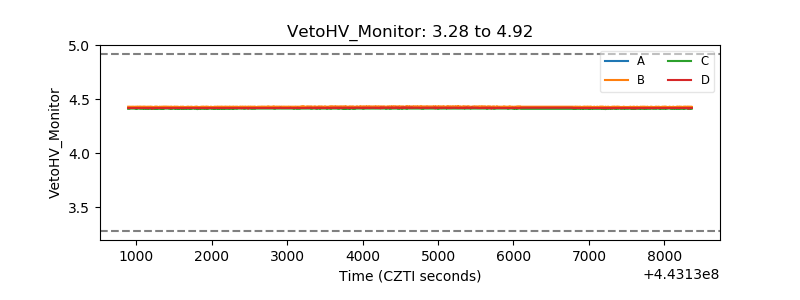 |
| Veto LLD | 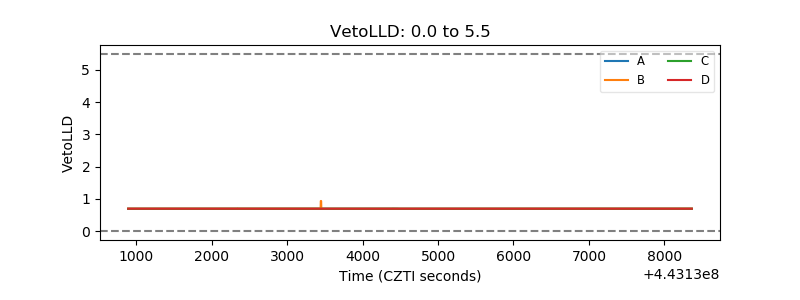 |
| Alpha Counter | 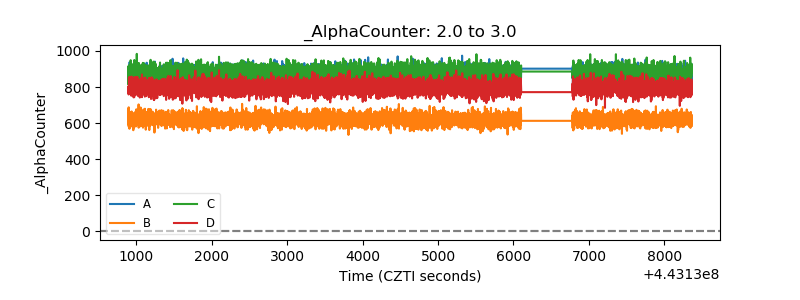 |
| _CPM_Rate | 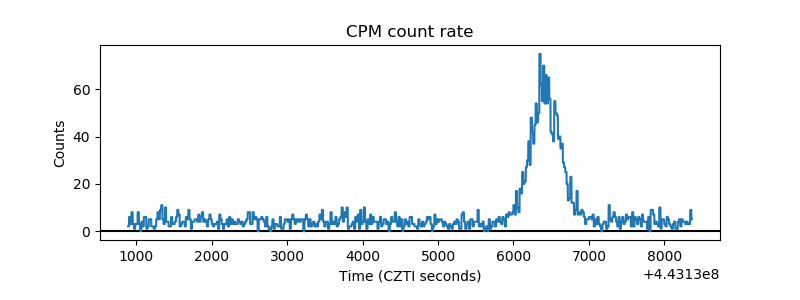 |
| CZT Counter | 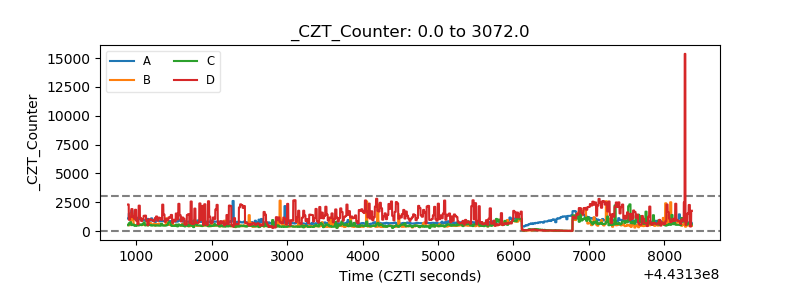 |
| +2.5 Volts monitor | 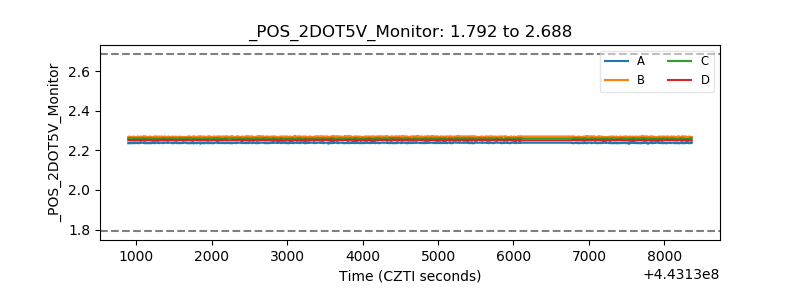 |
| +5 Volts monitor | 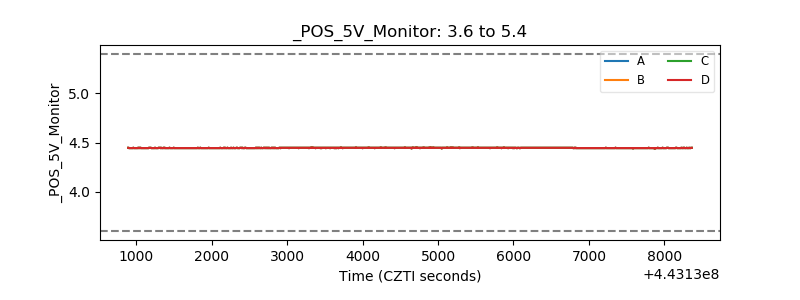 |
| _ROLL_ROT | 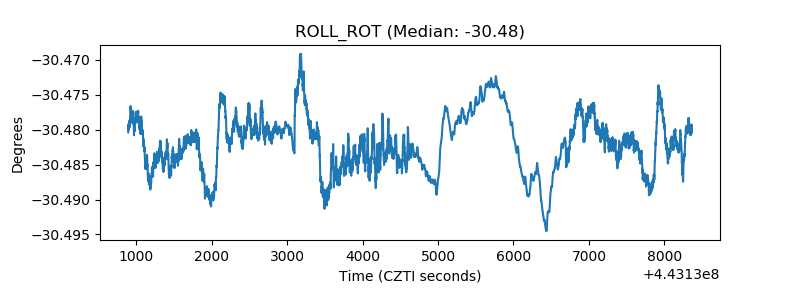 |
| _Roll_DEC | 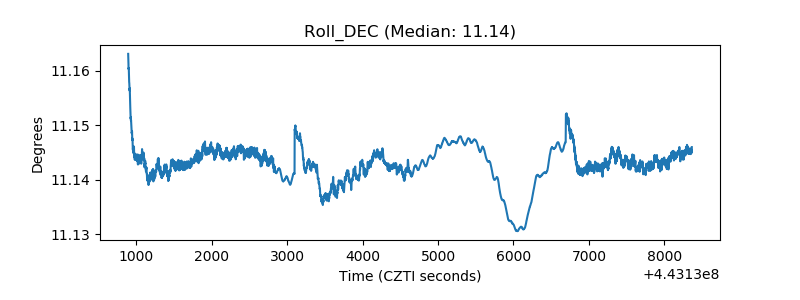 |
| _Roll_RA | 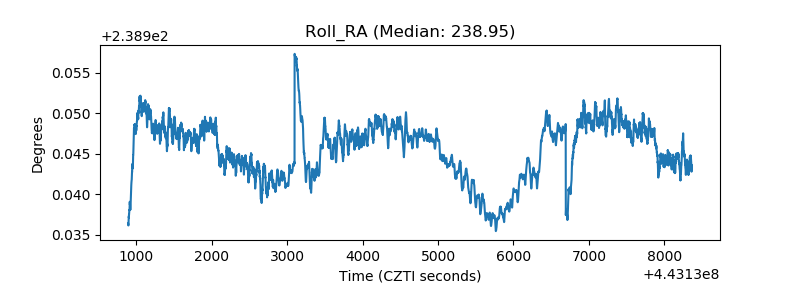 |
| Veto Counter | 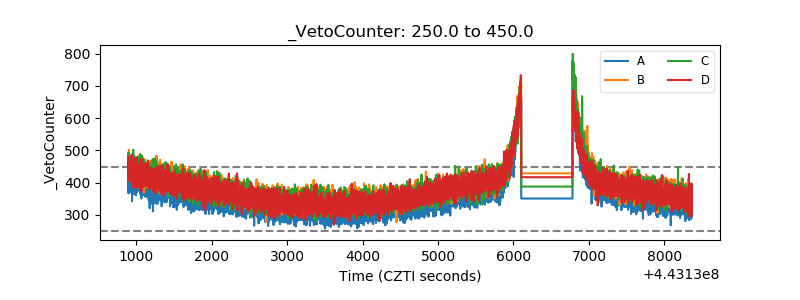 |