| Param | Original file | Final file |
|---|---|---|
| Filename | modeM0/AS1A13_017T02_9000006032_44898cztM0_level2.fits | modeM0/AS1A13_017T02_9000006032_44898cztM0_level2_quad_clean.evt |
| Size (bytes) | 752,158,080 | 120,283,200 |
| Size | 717.3 MB | 114.7 MB |
| Events in quadrant A | 6,451,697 | 828,522 |
| Events in quadrant B | 4,498,041 | 843,698 |
| Events in quadrant C | 5,532,091 | 839,792 |
| Events in quadrant D | 10,762,479 | 591,494 |
| Mode SS | |||
|---|---|---|---|
| Quadrant | BADHDUFLAG | Total packets | Discarded packets |
| A | 0 | 156 | 0 |
| B | 0 | 156 | 0 |
| C | 0 | 156 | 0 |
| D | 0 | 156 | 0 |
| Mode M0 | |||
|---|---|---|---|
| Quadrant | BADHDUFLAG | Total packets | Discarded packets |
| A | 0 | 25016 | 3 |
| B | 0 | 18620 | 3 |
| C | 0 | 21830 | 5 |
| D | 0 | 37411 | 3 |
| Mode M9 | |||
|---|---|---|---|
| Quadrant | BADHDUFLAG | Total packets | Discarded packets |
| A | 0 | 1 | 0 |
| B | 0 | 2 | 0 |
| C | 0 | 2 | 0 |
| D | 0 | 2 | 0 |
| Quadrant | Total seconds | Saturated seconds | Saturation percentage |
|---|---|---|---|
| A | 7734 | 406 | 5.249547% |
| B | 7734 | 442 | 5.715025% |
| C | 7733 | 264 | 3.413940% |
| D | 7733 | 2205 | 28.514160% |
Noise dominated data is calculated using 1-second bins in cleaned event files. If a bin has >2000 counts, and if more than 50% of those come from <1% of pixels, then it is considered to be noise-dominated and hence unusable.
| Quadrant | # 1 sec bins | Bins with >0 counts | Bins with >2000 counts | High rate bins dominated by noise | Noise dominated (total time) | Noise dominated (detector-on time) | Marked lightcurve |
|---|---|---|---|---|---|---|---|
| A | 7789 | 7736 | 42 | 42 | 0.54% | 0.54% | 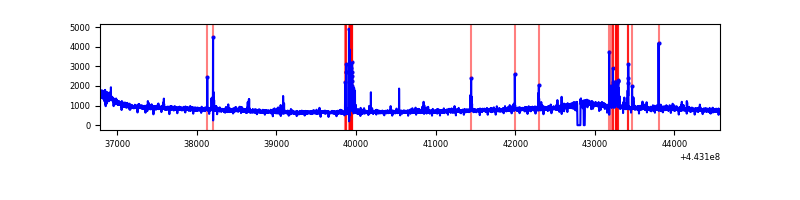 |
| B | 7789 | 7736 | 72 | 72 | 0.92% | 0.93% | 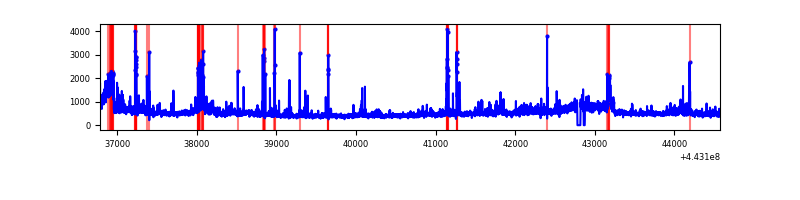 |
| C | 7788 | 7735 | 140 | 140 | 1.80% | 1.81% | 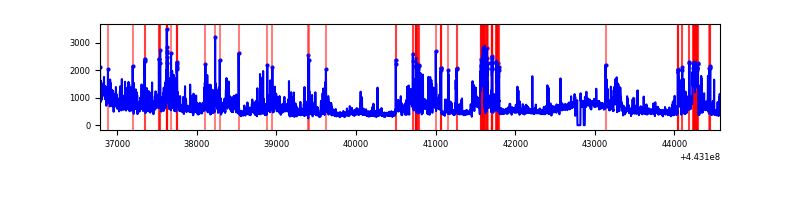 |
| D | 7788 | 7735 | 1582 | 1582 | 20.31% | 20.45% | 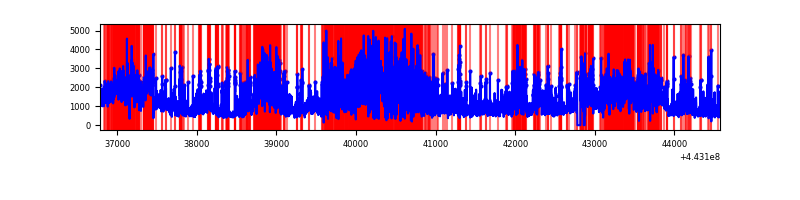 |
Top three noisy pixels from each quadrant. If the there are fewer than three noisy pixels in the level2.evt file, extra rows are filled as -1
| Pixel properties | Quadrant properties | ||||||
|---|---|---|---|---|---|---|---|
| Quadrant | DetID | PixID | Counts | Sigma | Mean | Median | Sigma |
| A | 10 | 83 | 2667734 | 13956.85 | 908 | 886 | 191.1 |
| A | 13 | 248 | 131823 | 685.25 | 908 | 886 | 191.1 |
| A | 10 | 248 | 111757 | 580.24 | 908 | 886 | 191.1 |
| B | 15 | 36 | 164655 | 920.77 | 904 | 877 | 177.9 |
| B | 5 | 255 | 130798 | 730.42 | 904 | 877 | 177.9 |
| B | 0 | 190 | 128362 | 716.73 | 904 | 877 | 177.9 |
| C | 9 | 54 | 1784105 | 8464.11 | 897 | 902 | 210.7 |
| C | 1 | 3 | 127209 | 599.53 | 897 | 902 | 210.7 |
| C | 15 | 208 | 38494 | 178.43 | 897 | 902 | 210.7 |
| D | 13 | 187 | 2282331 | 11069.86 | 808 | 782 | 206.1 |
| D | 1 | 52 | 1702611 | 8257.11 | 808 | 782 | 206.1 |
| D | 5 | 235 | 1046925 | 5075.79 | 808 | 782 | 206.1 |
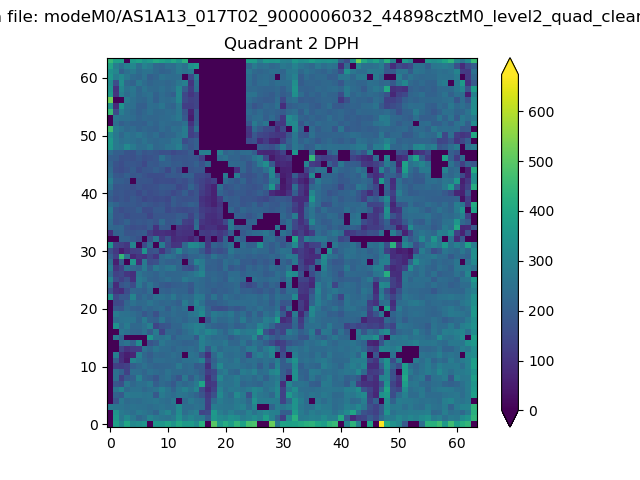
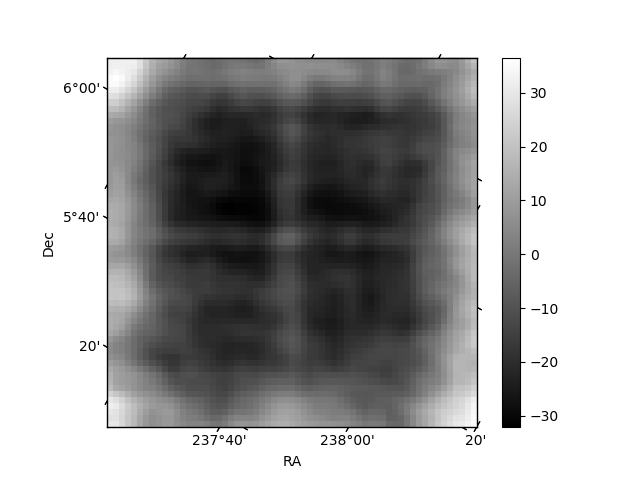
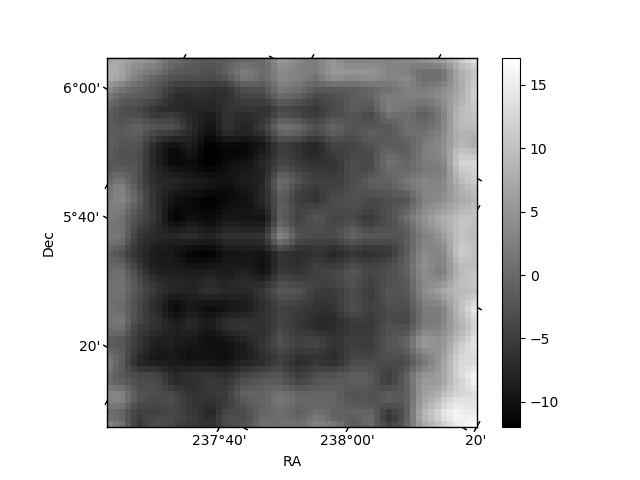
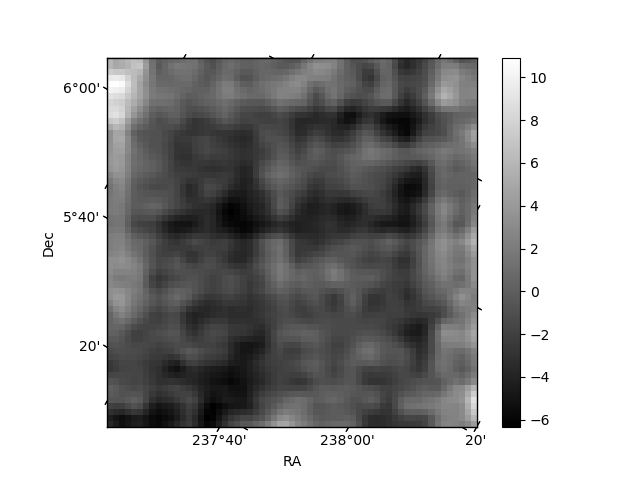
Histogram calculated using DETX and DETY for each event in the final _common_clean file
| Quadrant A | 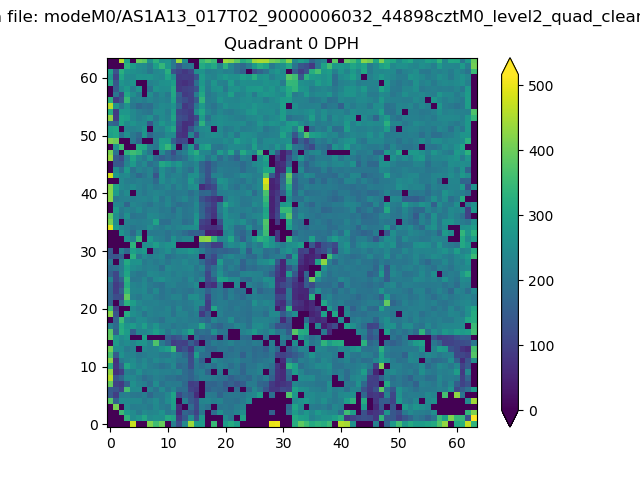 |
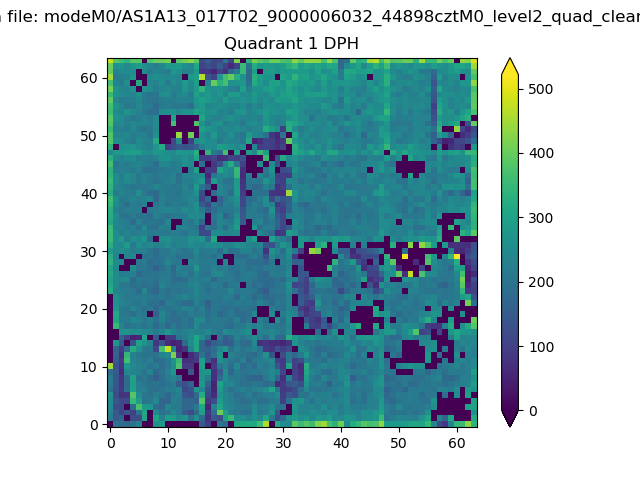 |
Quadrant B |
|---|---|---|---|
| Quadrant D | 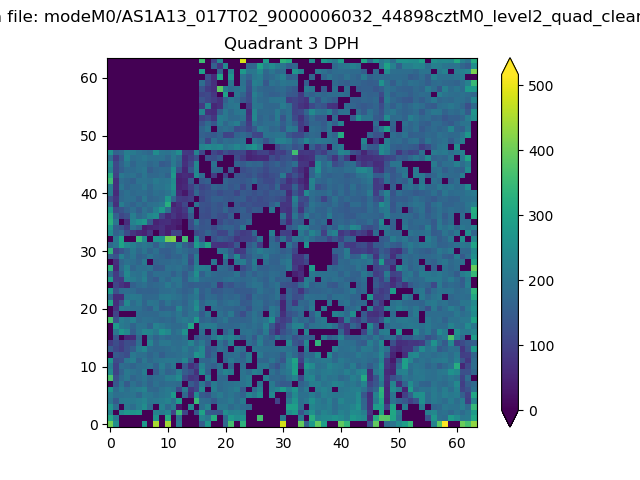 |
 |
Quadrant C |
| Plot type | Count rate plots | Images |
|---|---|---|
| Comparison with Poisson distribution Blue bars denote a histogram of data divided into 1 sec bins. Red curve is a Poisson curve with rate = median count rate of data. |
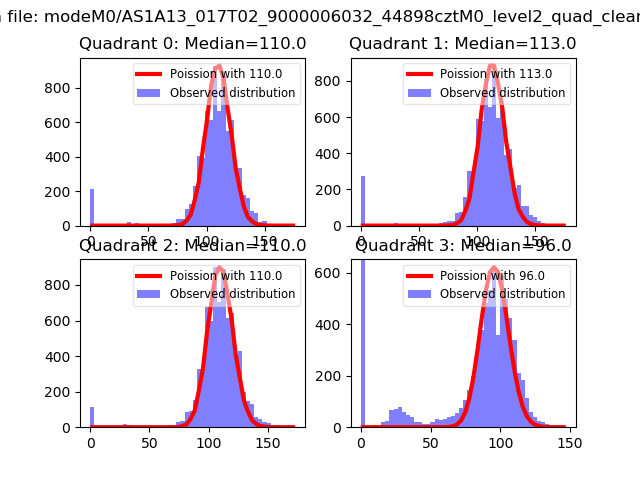 |
 |
| Quadrant-wise count rates Data is divided into 100 sec bins |
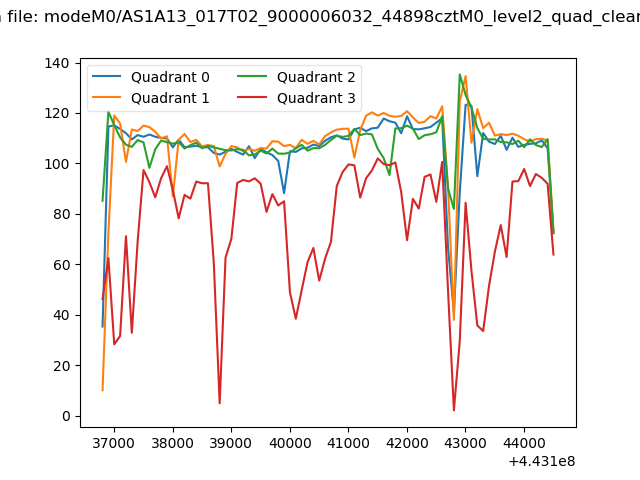 |
|
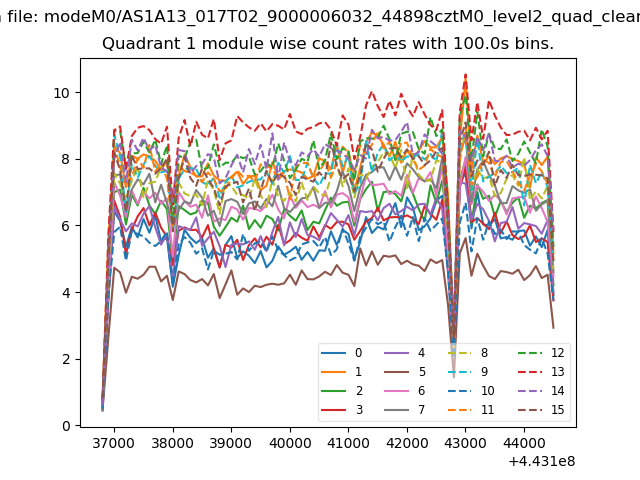
| Module-wise count rates for Quadrant A Data is divided into 100 sec bins |
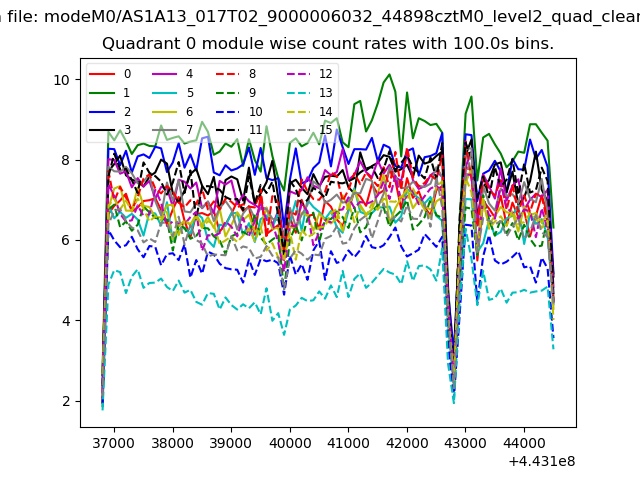 |
 |
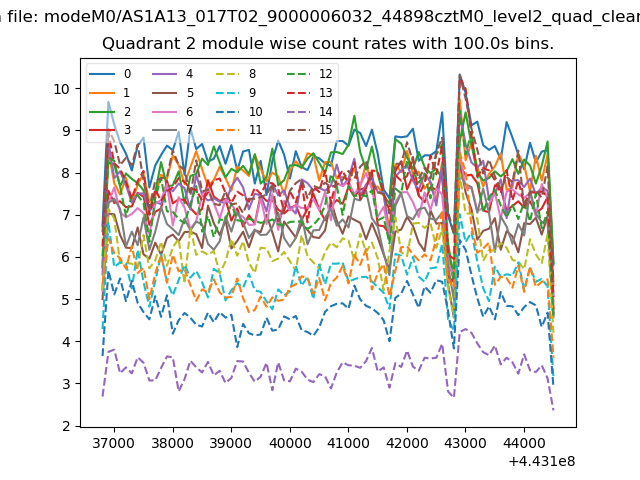
| Module-wise count rates for Quadrant B Data is divided into 100 sec bins |
 |
 |
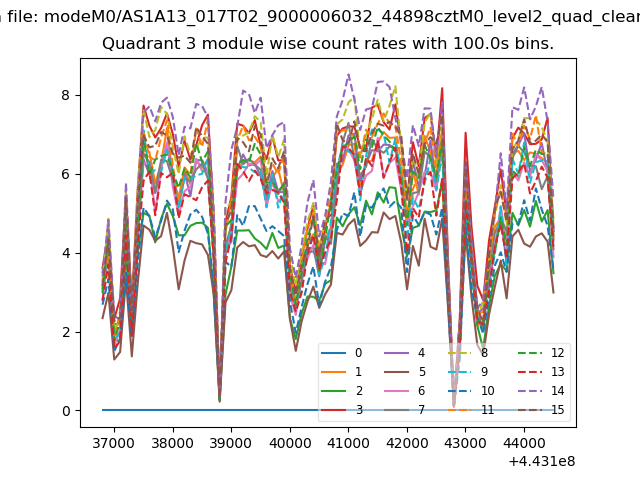
| Module-wise count rates for Quadrant C Data is divided into 100 sec bins |
 |
 |
| Module-wise count rates for Quadrant D Data is divided into 100 sec bins |
 |
 |
| Parameter | Plot |
|---|---|
| CZT HV Monitor | 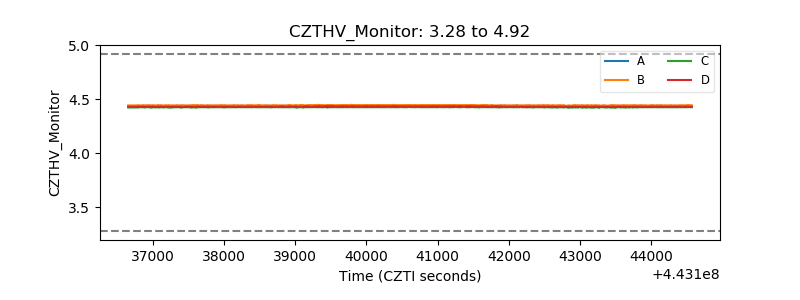 |
| D_VDD | 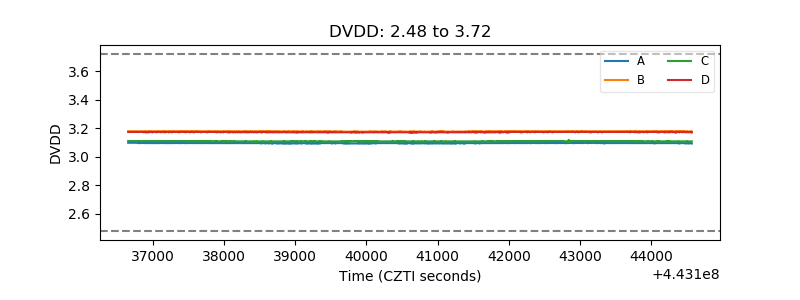 |
| Temperature 1 | 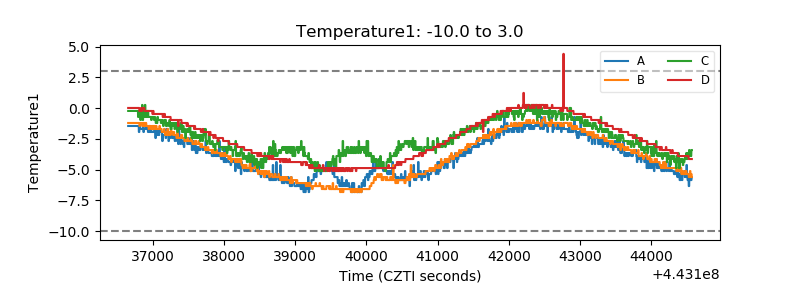 |
| Veto HV Monitor | 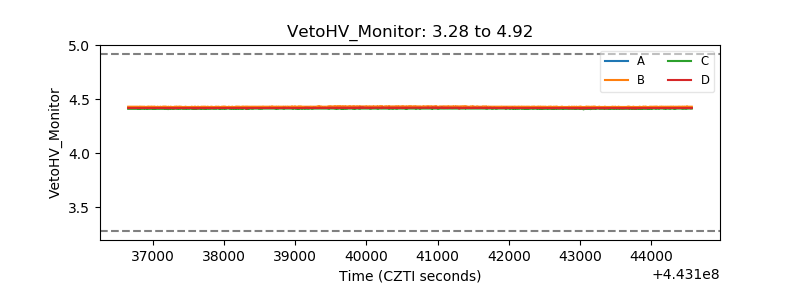 |
| Veto LLD | 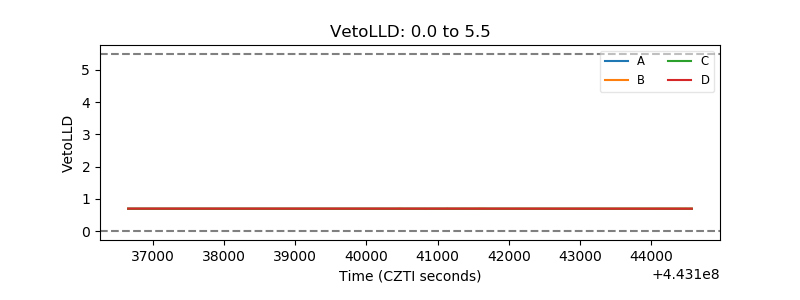 |
| Alpha Counter | 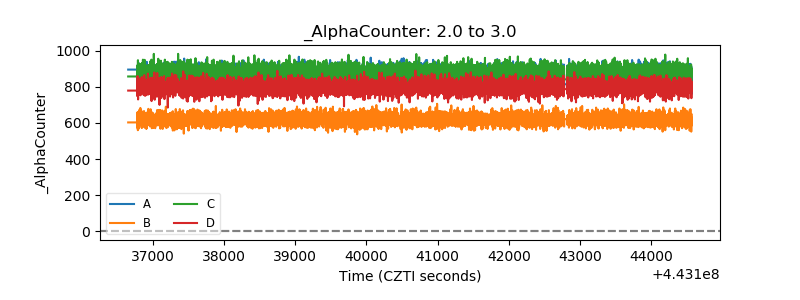 |
| _CPM_Rate | 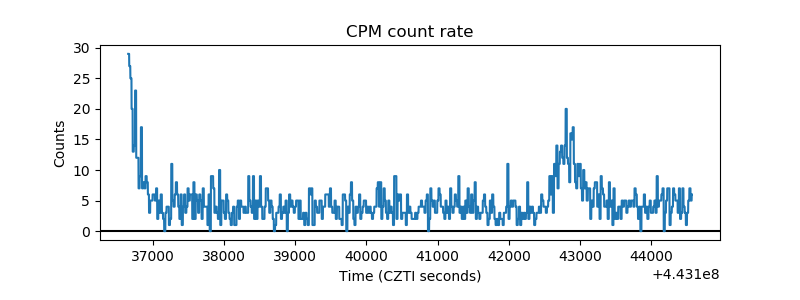 |
| CZT Counter | 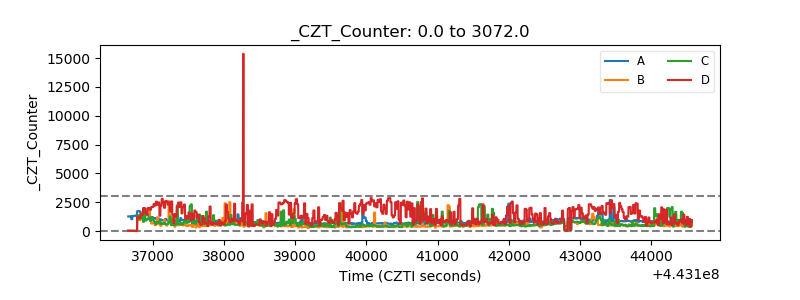 |
| +2.5 Volts monitor | 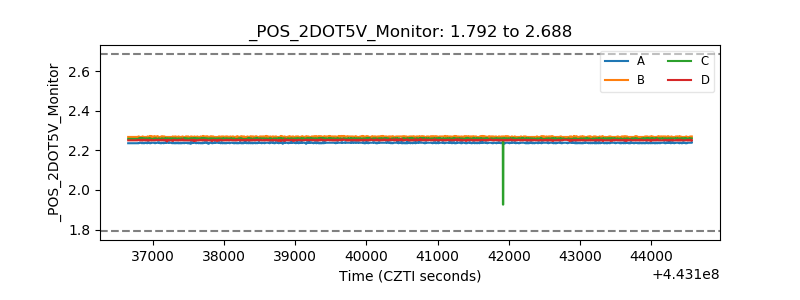 |
| +5 Volts monitor | 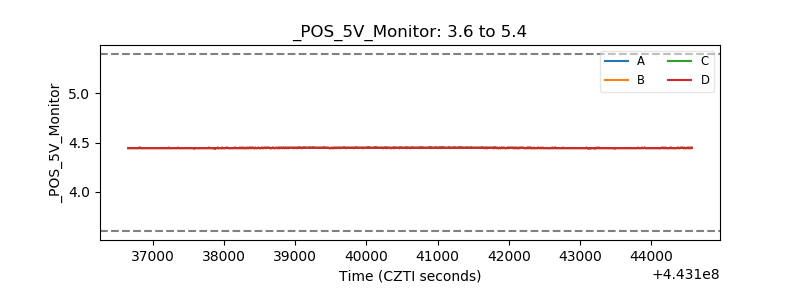 |
| _ROLL_ROT | 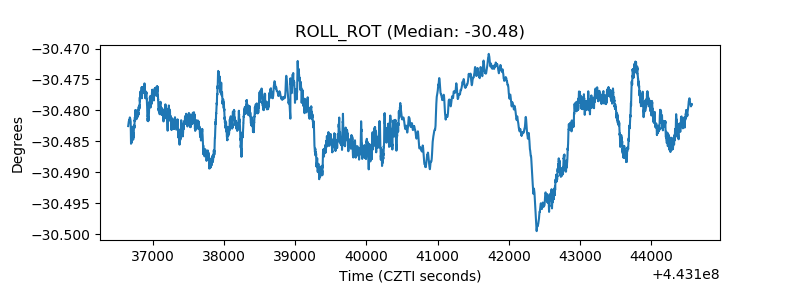 |
| _Roll_DEC | 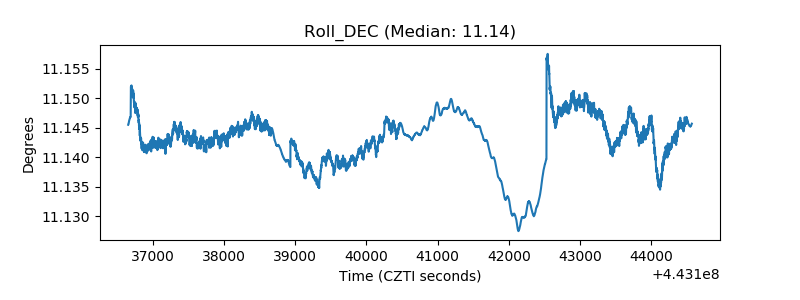 |
| _Roll_RA | 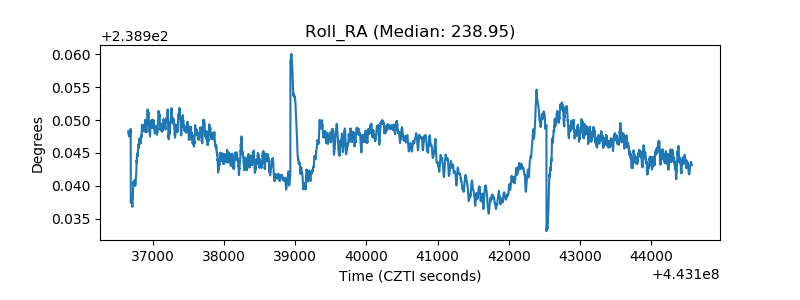 |
| Veto Counter | 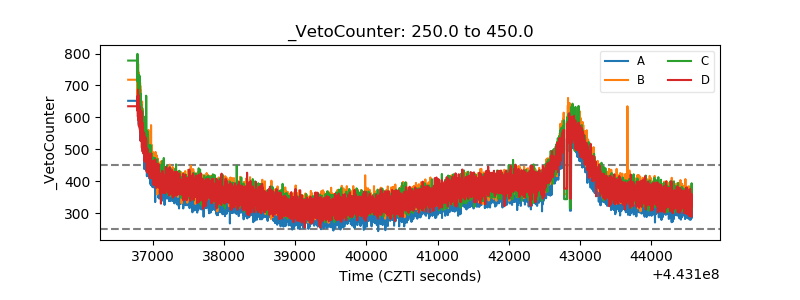 |