| Param | Original file | Final file |
|---|---|---|
| Filename | modeM0/AS1A13_017T02_9000006032_44899cztM0_level2.fits | modeM0/AS1A13_017T02_9000006032_44899cztM0_level2_quad_clean.evt |
| Size (bytes) | 739,382,400 | 127,776,960 |
| Size | 705.1 MB | 121.9 MB |
| Events in quadrant A | 6,462,703 | 873,333 |
| Events in quadrant B | 4,491,106 | 898,889 |
| Events in quadrant C | 5,628,376 | 870,669 |
| Events in quadrant D | 10,164,119 | 665,207 |
| Mode SS | |||
|---|---|---|---|
| Quadrant | BADHDUFLAG | Total packets | Discarded packets |
| A | 0 | 162 | 0 |
| B | 0 | 162 | 0 |
| C | 0 | 162 | 0 |
| D | 0 | 162 | 0 |
| Mode M0 | |||
|---|---|---|---|
| Quadrant | BADHDUFLAG | Total packets | Discarded packets |
| A | 0 | 25425 | 2 |
| B | 0 | 18821 | 4 |
| C | 0 | 22375 | 3 |
| D | 0 | 35837 | 2 |
| Quadrant | Total seconds | Saturated seconds | Saturation percentage |
|---|---|---|---|
| A | 8061 | 232 | 2.878055% |
| B | 8061 | 205 | 2.543109% |
| C | 8061 | 162 | 2.009676% |
| D | 8061 | 1675 | 20.779060% |
Noise dominated data is calculated using 1-second bins in cleaned event files. If a bin has >2000 counts, and if more than 50% of those come from <1% of pixels, then it is considered to be noise-dominated and hence unusable.
| Quadrant | # 1 sec bins | Bins with >0 counts | Bins with >2000 counts | High rate bins dominated by noise | Noise dominated (total time) | Noise dominated (detector-on time) | Marked lightcurve |
|---|---|---|---|---|---|---|---|
| A | 8076 | 8062 | 27 | 27 | 0.33% | 0.33% | 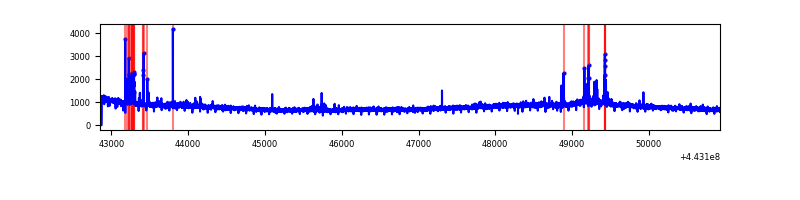 |
| B | 8077 | 8063 | 34 | 34 | 0.42% | 0.42% | 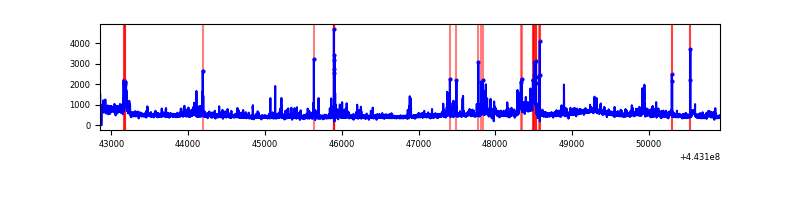 |
| C | 8076 | 8062 | 131 | 131 | 1.62% | 1.62% | 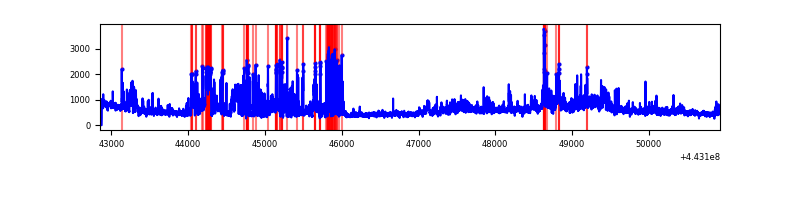 |
| D | 8076 | 8062 | 1327 | 1327 | 16.43% | 16.46% | 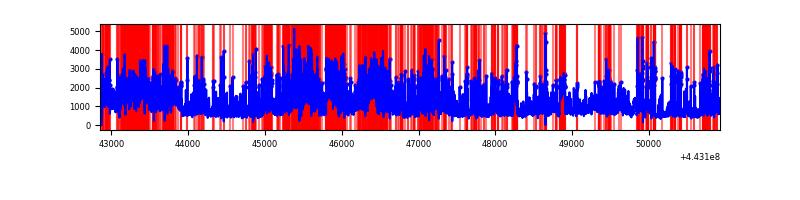 |
Top three noisy pixels from each quadrant. If the there are fewer than three noisy pixels in the level2.evt file, extra rows are filled as -1
| Pixel properties | Quadrant properties | ||||||
|---|---|---|---|---|---|---|---|
| Quadrant | DetID | PixID | Counts | Sigma | Mean | Median | Sigma |
| A | 10 | 83 | 2640859 | 13367.04 | 934 | 912 | 197.5 |
| A | 13 | 248 | 160420 | 807.65 | 934 | 912 | 197.5 |
| A | 0 | 243 | 20794 | 100.67 | 934 | 912 | 197.5 |
| B | 15 | 36 | 177280 | 941.44 | 937 | 908 | 187.3 |
| B | 0 | 155 | 161518 | 857.31 | 937 | 908 | 187.3 |
| B | 5 | 255 | 117375 | 621.68 | 937 | 908 | 187.3 |
| C | 9 | 54 | 1802173 | 8320.89 | 920 | 924 | 216.5 |
| C | 15 | 208 | 108047 | 494.86 | 920 | 924 | 216.5 |
| C | 1 | 3 | 27483 | 122.69 | 920 | 924 | 216.5 |
| D | 1 | 52 | 1668456 | 7735.73 | 852 | 827 | 215.6 |
| D | 5 | 235 | 1557559 | 7221.31 | 852 | 827 | 215.6 |
| D | 13 | 187 | 1107982 | 5135.83 | 852 | 827 | 215.6 |
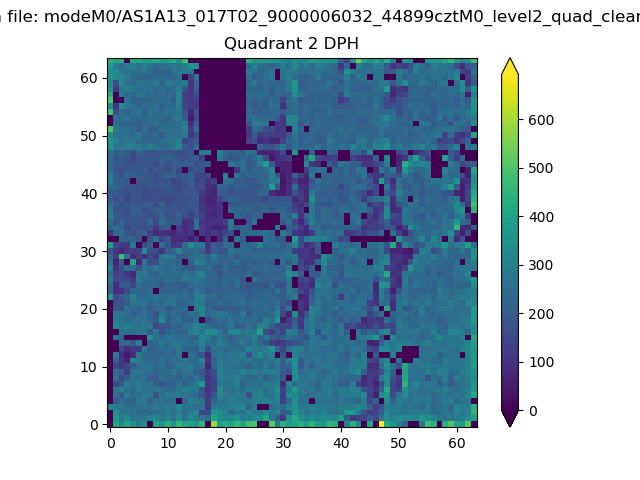
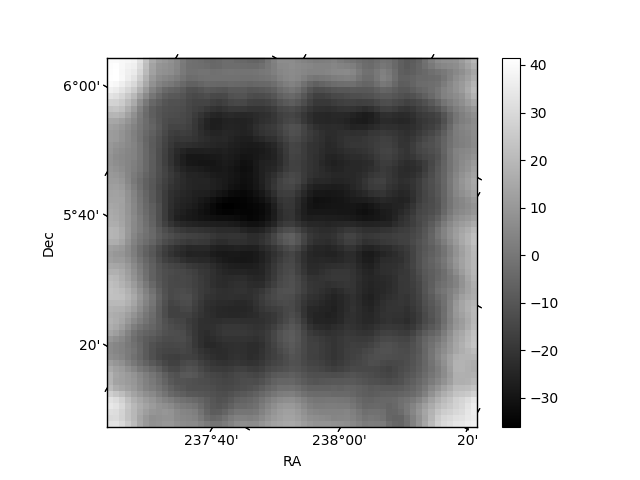
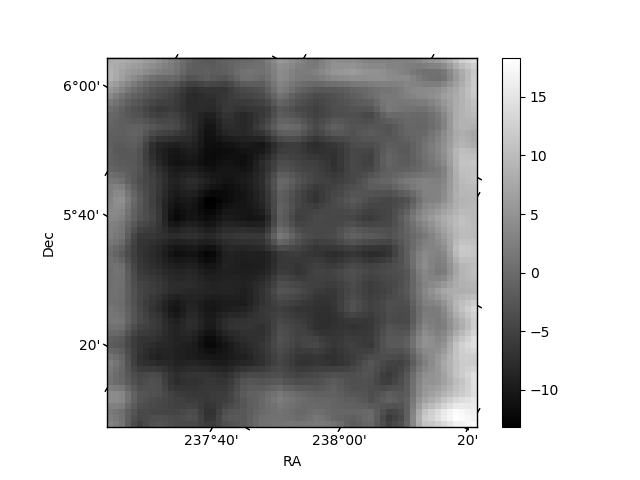
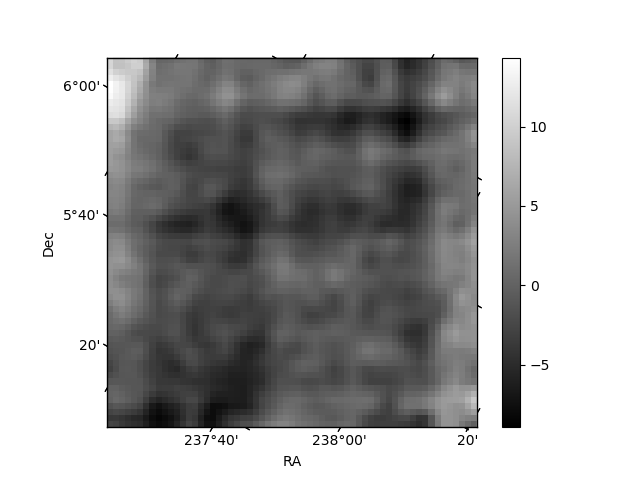
Histogram calculated using DETX and DETY for each event in the final _common_clean file
| Quadrant A | 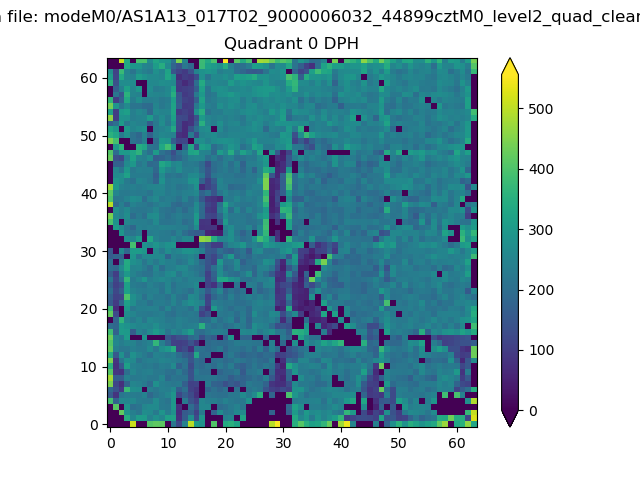 |
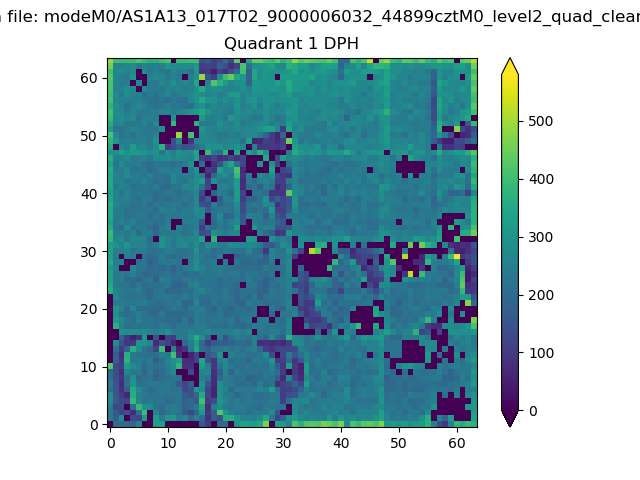 |
Quadrant B |
|---|---|---|---|
| Quadrant D | 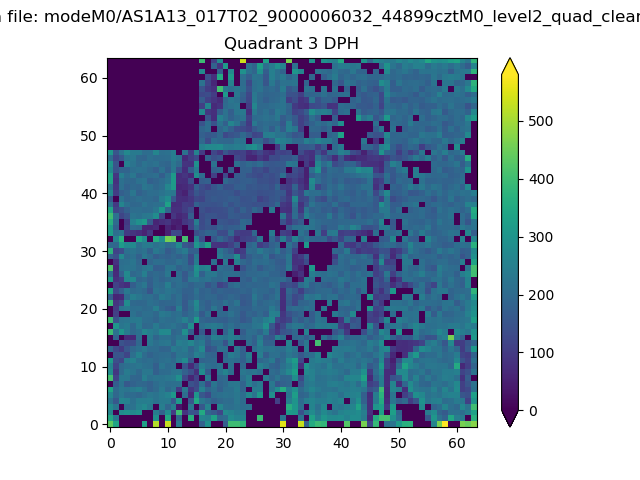 |
 |
Quadrant C |
| Plot type | Count rate plots | Images |
|---|---|---|
| Comparison with Poisson distribution Blue bars denote a histogram of data divided into 1 sec bins. Red curve is a Poisson curve with rate = median count rate of data. |
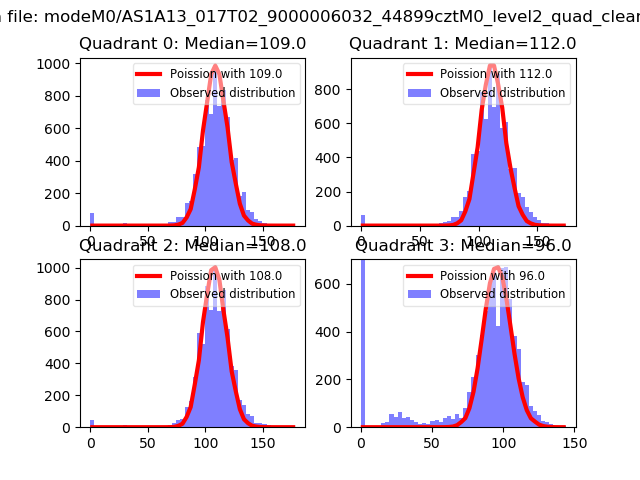 |
 |
| Quadrant-wise count rates Data is divided into 100 sec bins |
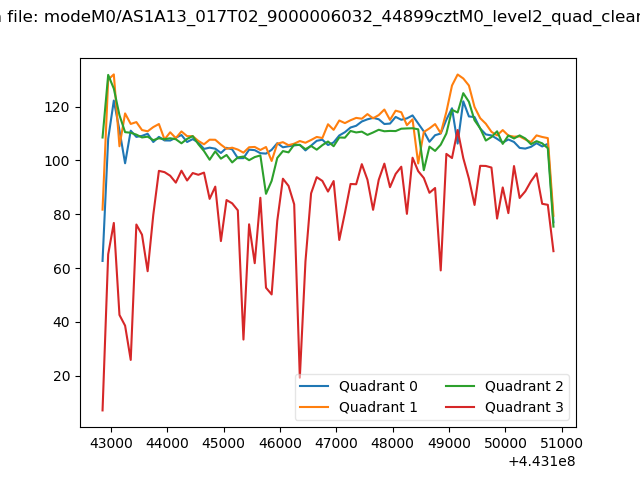 |
|
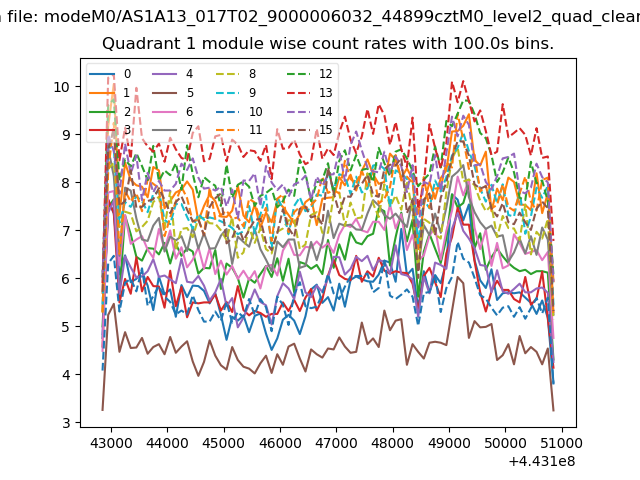
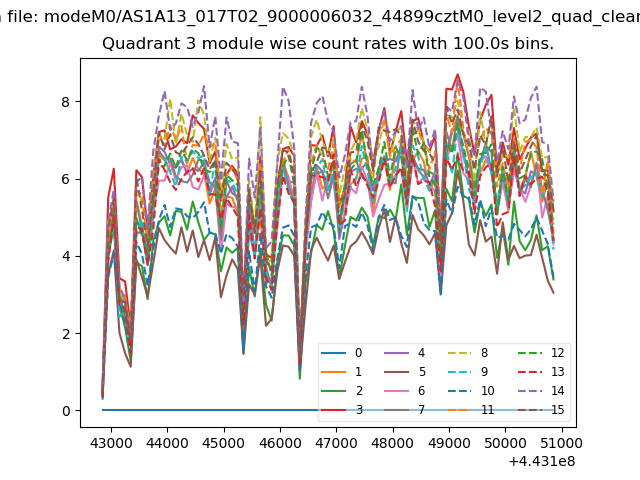
| Module-wise count rates for Quadrant A Data is divided into 100 sec bins |
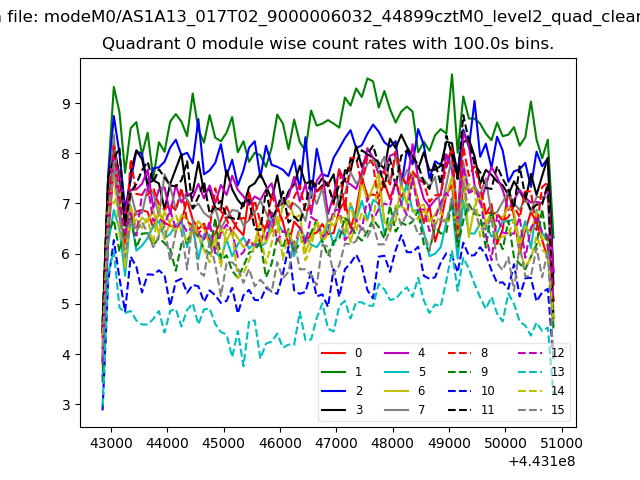 |
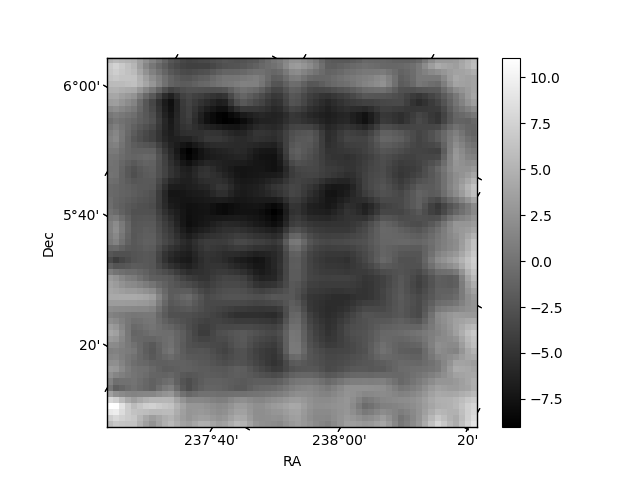 |
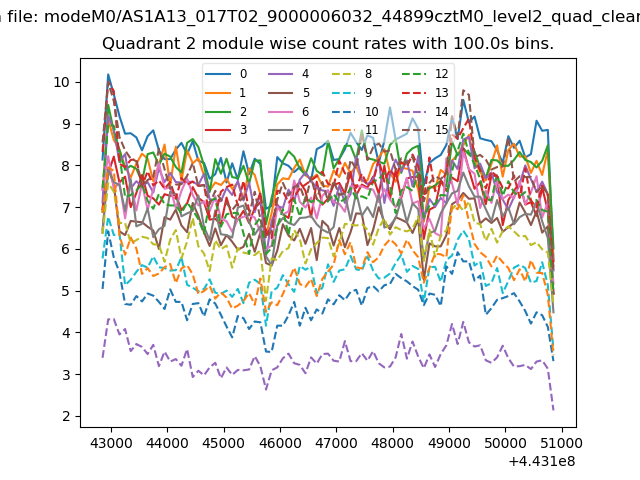
| Module-wise count rates for Quadrant B Data is divided into 100 sec bins |
 |
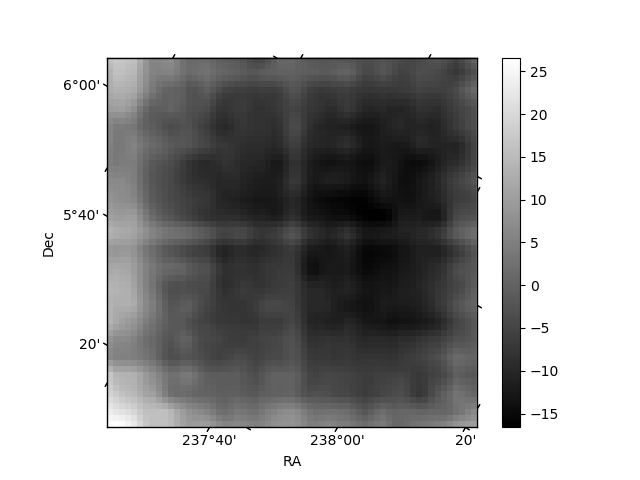 |
| Module-wise count rates for Quadrant C Data is divided into 100 sec bins |
 |
 |
| Module-wise count rates for Quadrant D Data is divided into 100 sec bins |
 |
 |
| Parameter | Plot |
|---|---|
| CZT HV Monitor | 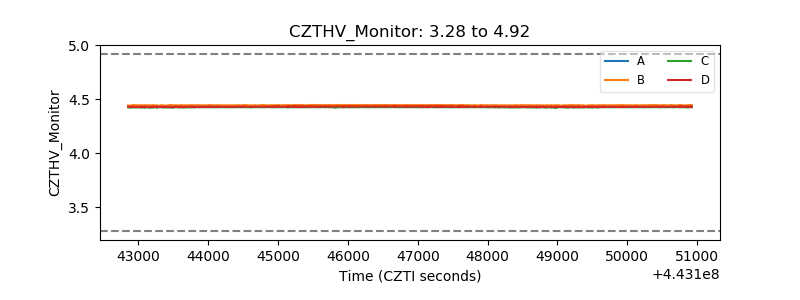 |
| D_VDD | 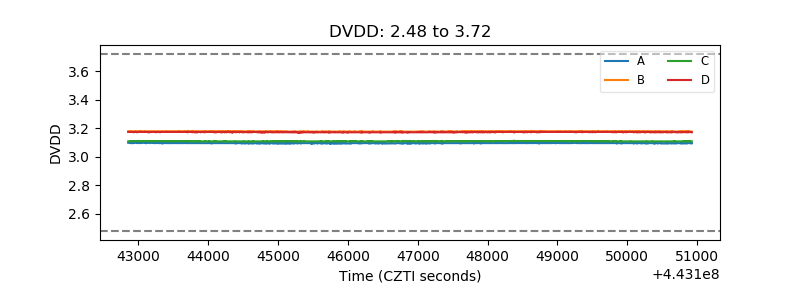 |
| Temperature 1 | 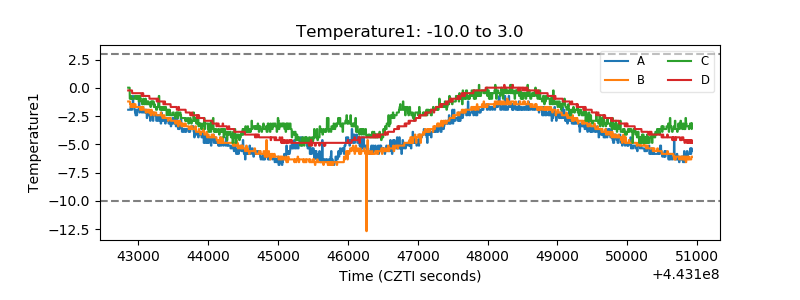 |
| Veto HV Monitor | 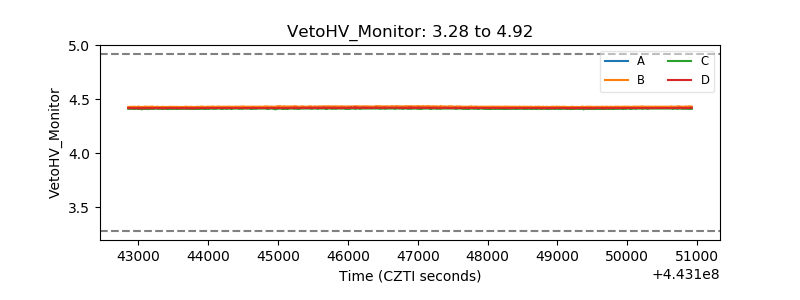 |
| Veto LLD | 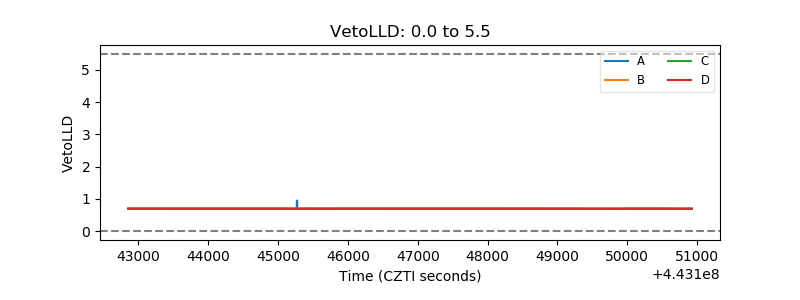 |
| Alpha Counter | 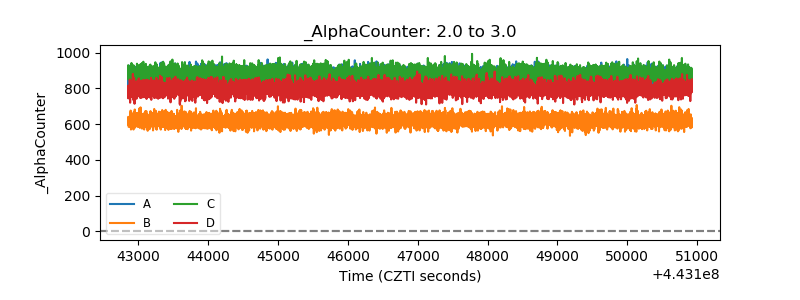 |
| _CPM_Rate | 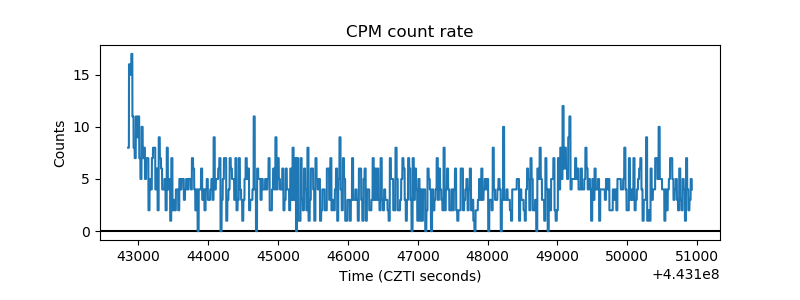 |
| CZT Counter | 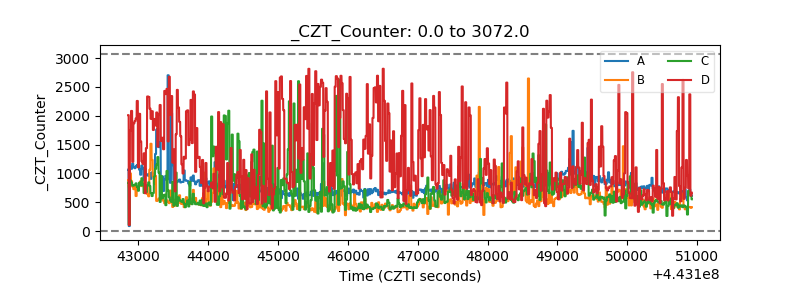 |
| +2.5 Volts monitor | 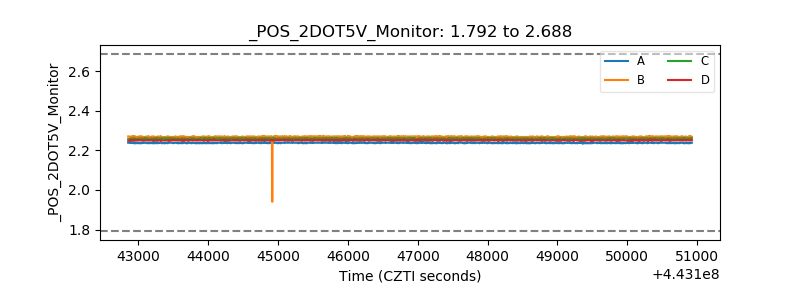 |
| +5 Volts monitor | 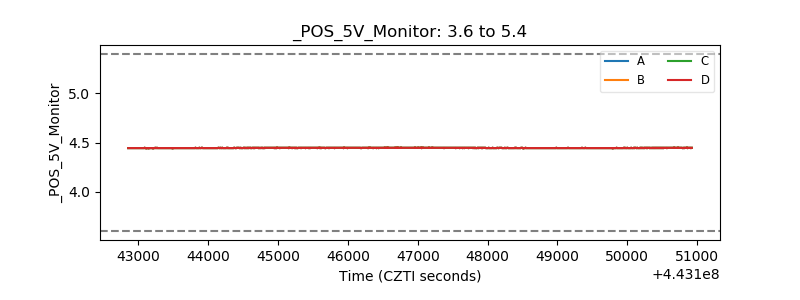 |
| _ROLL_ROT | 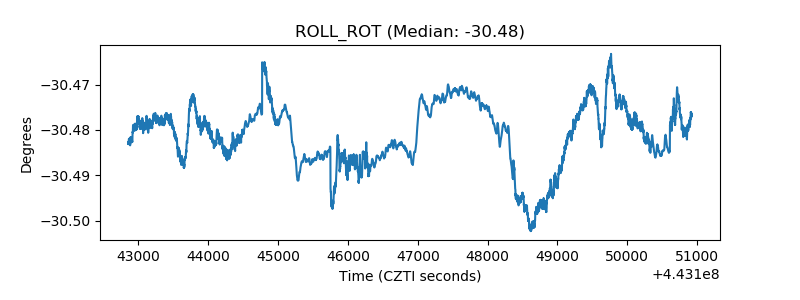 |
| _Roll_DEC | 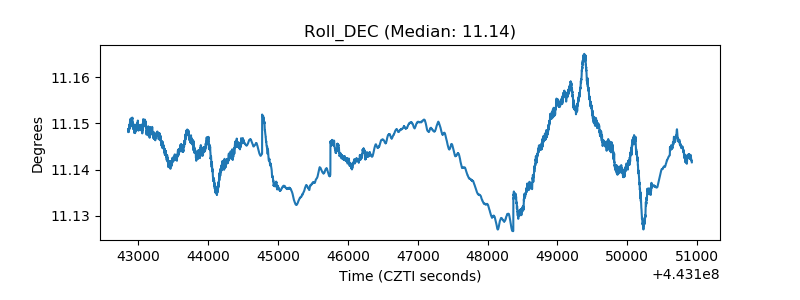 |
| _Roll_RA | 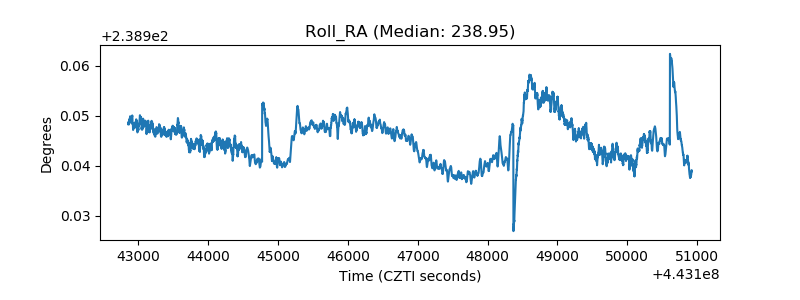 |
| Veto Counter |  |