| Param | Original file | Final file |
|---|---|---|
| Filename | modeM0/AS1A13_017T02_9000006032_44903cztM0_level2.fits | modeM0/AS1A13_017T02_9000006032_44903cztM0_level2_quad_clean.evt |
| Size (bytes) | 2,302,482,240 | 389,678,400 |
| Size | 2.1 GB | 371.6 MB |
| Events in quadrant A | 19,650,354 | 2,694,957 |
| Events in quadrant B | 14,606,698 | 2,751,242 |
| Events in quadrant C | 16,452,867 | 2,646,756 |
| Events in quadrant D | 32,570,127 | 1,962,999 |
| Mode SS | |||
|---|---|---|---|
| Quadrant | BADHDUFLAG | Total packets | Discarded packets |
| A | 0 | 514 | 0 |
| B | 0 | 514 | 0 |
| C | 0 | 514 | 0 |
| D | 0 | 514 | 0 |
| Mode M0 | |||
|---|---|---|---|
| Quadrant | BADHDUFLAG | Total packets | Discarded packets |
| A | 0 | 78729 | 4 |
| B | 0 | 60747 | 7 |
| C | 0 | 65874 | 4 |
| D | 0 | 114411 | 15 |
| Mode M9 | |||
|---|---|---|---|
| Quadrant | BADHDUFLAG | Total packets | Discarded packets |
| A | 0 | 14 | 0 |
| B | 0 | 14 | 0 |
| C | 0 | 14 | 0 |
| D | 0 | 14 | 0 |
| Quadrant | Total seconds | Saturated seconds | Saturation percentage |
|---|---|---|---|
| A | 25310 | 538 | 2.125642% |
| B | 25308 | 797 | 3.149202% |
| C | 25310 | 690 | 2.726195% |
| D | 25308 | 6153 | 24.312470% |
Noise dominated data is calculated using 1-second bins in cleaned event files. If a bin has >2000 counts, and if more than 50% of those come from <1% of pixels, then it is considered to be noise-dominated and hence unusable.
| Quadrant | # 1 sec bins | Bins with >0 counts | Bins with >2000 counts | High rate bins dominated by noise | Noise dominated (total time) | Noise dominated (detector-on time) | Marked lightcurve |
|---|---|---|---|---|---|---|---|
| A | 26845 | 25315 | 114 | 114 | 0.42% | 0.45% | 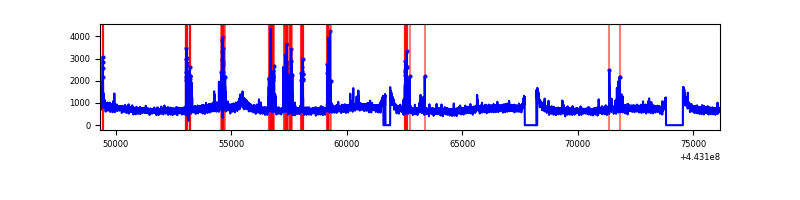 |
| B | 26845 | 25314 | 276 | 276 | 1.03% | 1.09% | 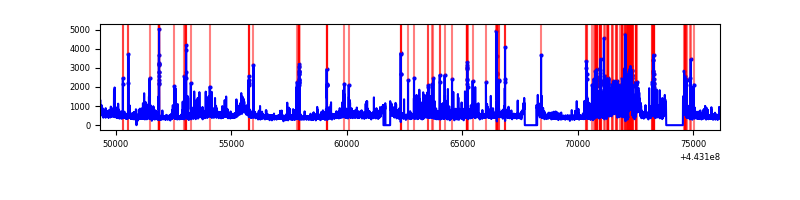 |
| C | 26845 | 25315 | 662 | 662 | 2.47% | 2.62% | 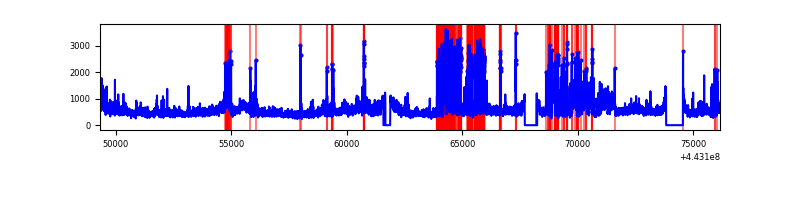 |
| D | 26845 | 25313 | 4771 | 4771 | 17.77% | 18.85% | 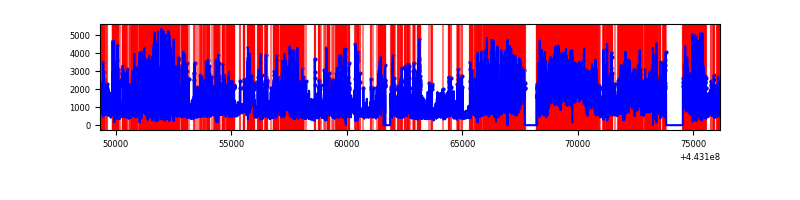 |
Top three noisy pixels from each quadrant. If the there are fewer than three noisy pixels in the level2.evt file, extra rows are filled as -1
| Pixel properties | Quadrant properties | ||||||
|---|---|---|---|---|---|---|---|
| Quadrant | DetID | PixID | Counts | Sigma | Mean | Median | Sigma |
| A | 10 | 83 | 7827394 | 13211.16 | 2859 | 2802 | 592.3 |
| A | 13 | 248 | 744040 | 1251.52 | 2859 | 2802 | 592.3 |
| A | 13 | 254 | 34507 | 53.53 | 2859 | 2802 | 592.3 |
| B | 0 | 219 | 1893332 | 3371.95 | 2844 | 2748 | 560.7 |
| B | 0 | 190 | 263808 | 465.61 | 2844 | 2748 | 560.7 |
| B | 0 | 155 | 194722 | 342.4 | 2844 | 2748 | 560.7 |
| C | 9 | 54 | 5076208 | 7678.2 | 2797 | 2819 | 660.8 |
| C | 15 | 208 | 212908 | 317.95 | 2797 | 2819 | 660.8 |
| C | 1 | 3 | 70253 | 102.06 | 2797 | 2819 | 660.8 |
| D | 12 | 33 | 7072726 | 10769.06 | 2557 | 2480 | 656.5 |
| D | 13 | 187 | 4766378 | 7256.14 | 2557 | 2480 | 656.5 |
| D | 13 | 249 | 2406251 | 3661.31 | 2557 | 2480 | 656.5 |
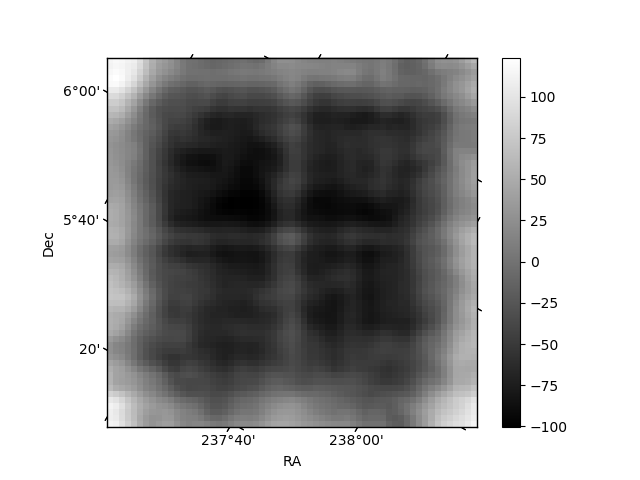
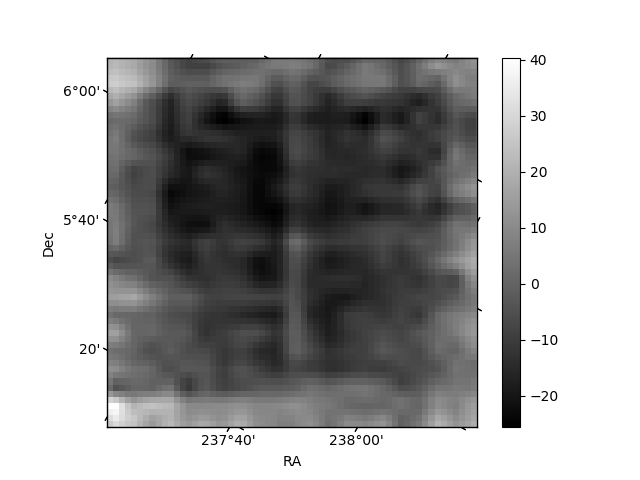
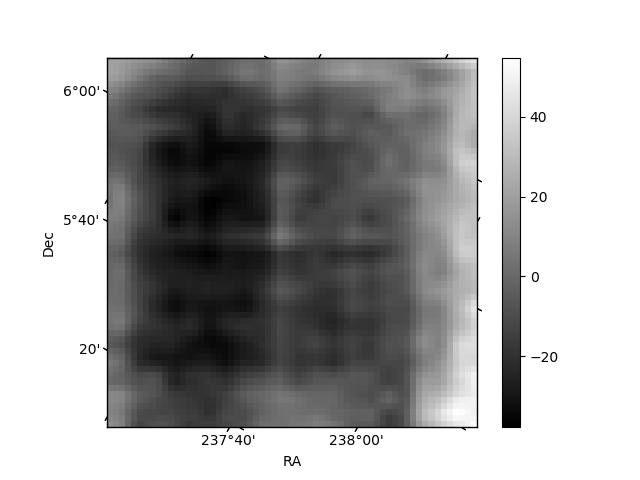
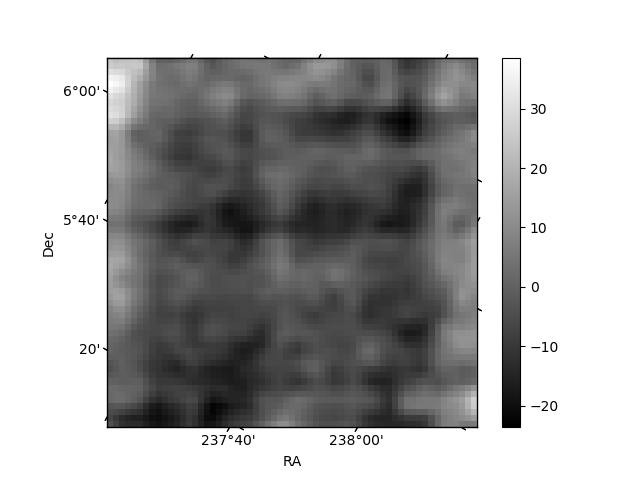
Histogram calculated using DETX and DETY for each event in the final _common_clean file
| Quadrant A | 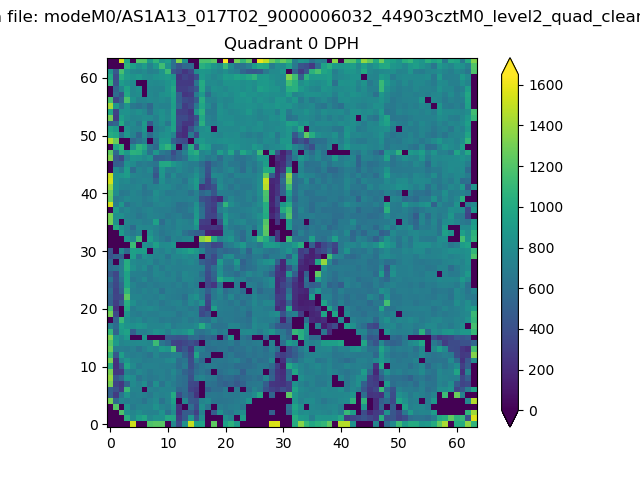 |
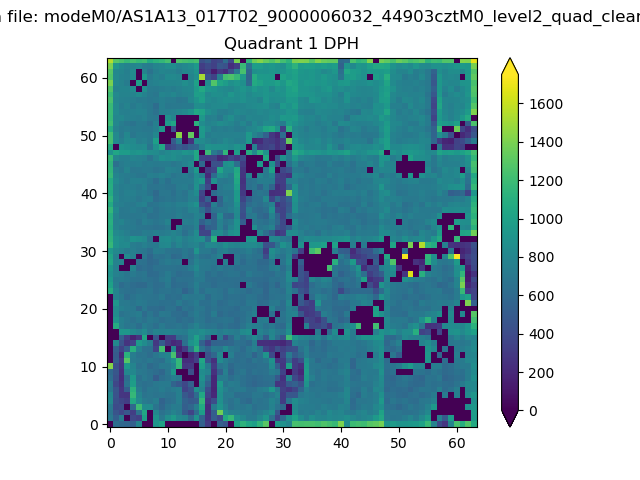 |
Quadrant B |
|---|---|---|---|
| Quadrant D | 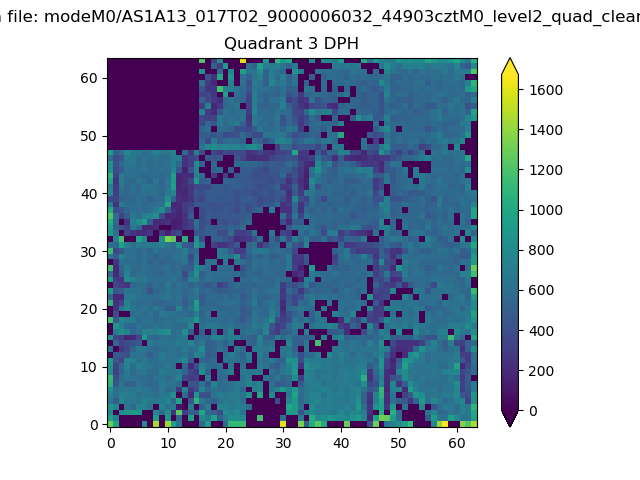 |
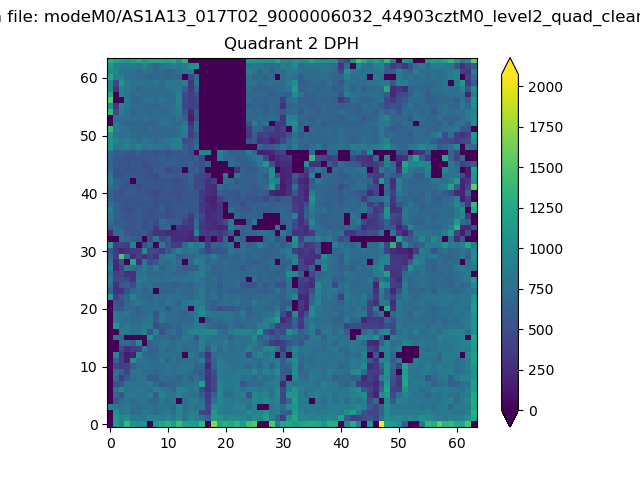 |
Quadrant C |
| Plot type | Count rate plots | Images |
|---|---|---|
| Comparison with Poisson distribution Blue bars denote a histogram of data divided into 1 sec bins. Red curve is a Poisson curve with rate = median count rate of data. |
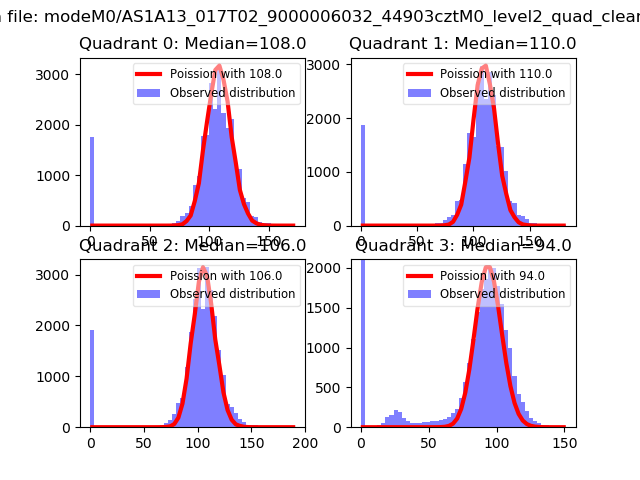 |
 |
| Quadrant-wise count rates Data is divided into 100 sec bins |
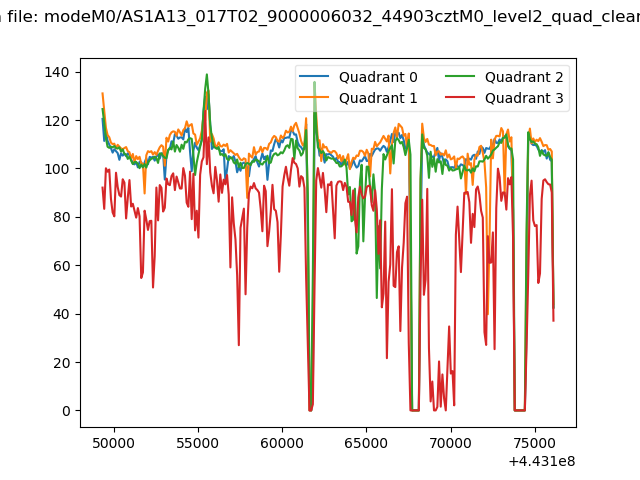 |
|
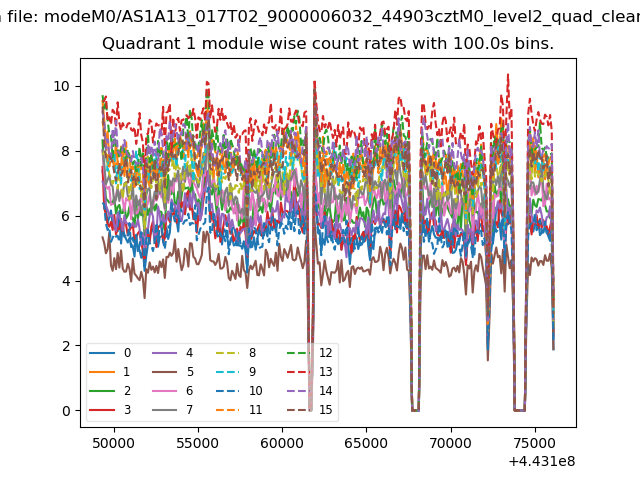
| Module-wise count rates for Quadrant A Data is divided into 100 sec bins |
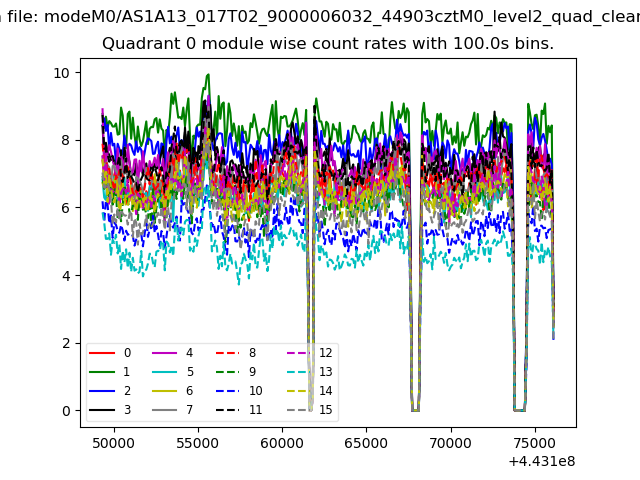 |
 |
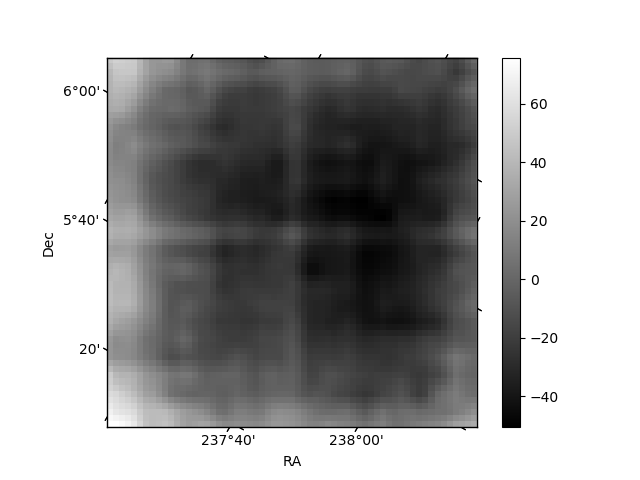
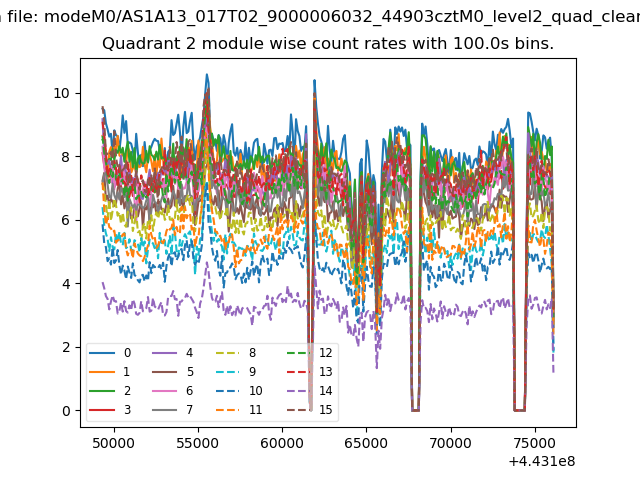
| Module-wise count rates for Quadrant B Data is divided into 100 sec bins |
 |
 |
| Module-wise count rates for Quadrant C Data is divided into 100 sec bins |
 |
 |
| Module-wise count rates for Quadrant D Data is divided into 100 sec bins |
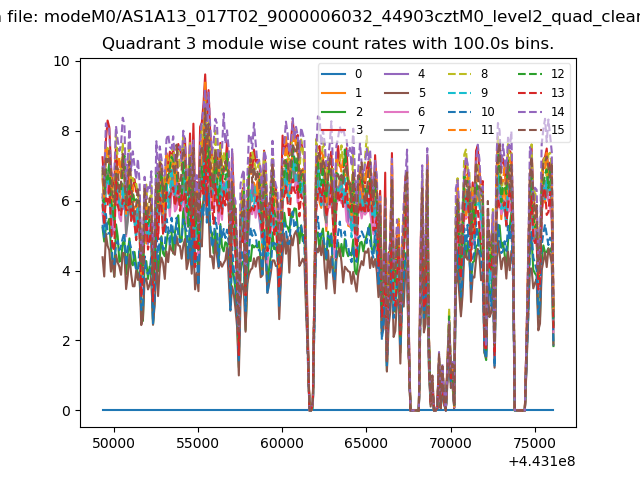 |
 |
| Parameter | Plot |
|---|---|
| CZT HV Monitor | 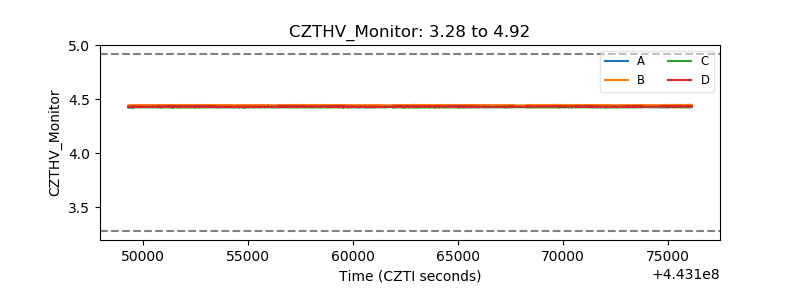 |
| D_VDD | 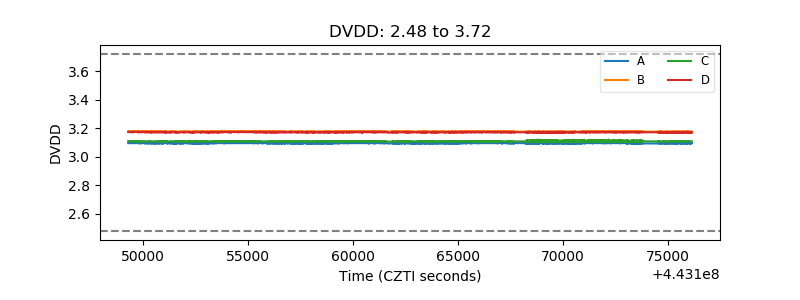 |
| Temperature 1 | 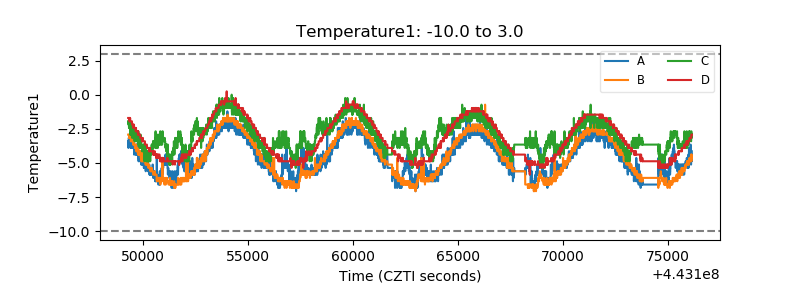 |
| Veto HV Monitor | 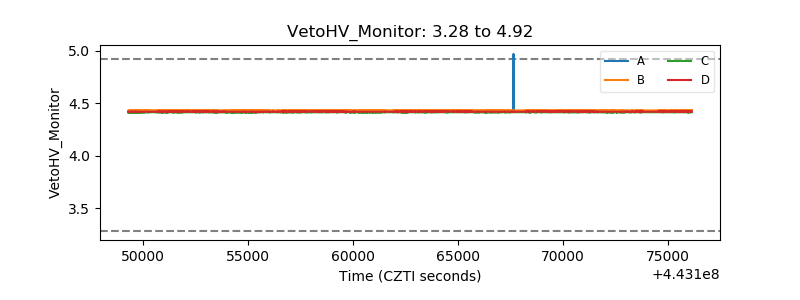 |
| Veto LLD | 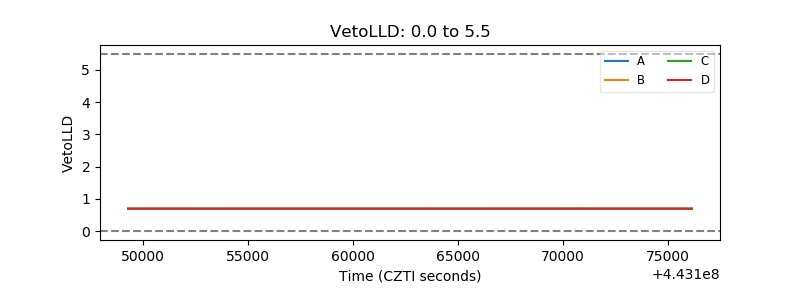 |
| Alpha Counter | 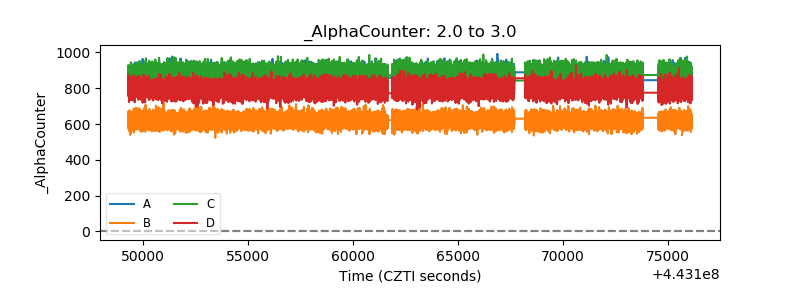 |
| _CPM_Rate | 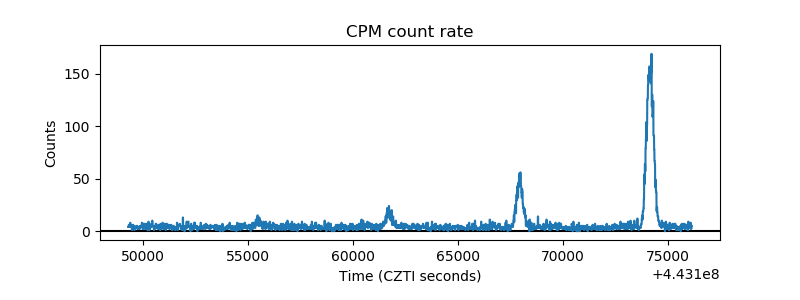 |
| CZT Counter | 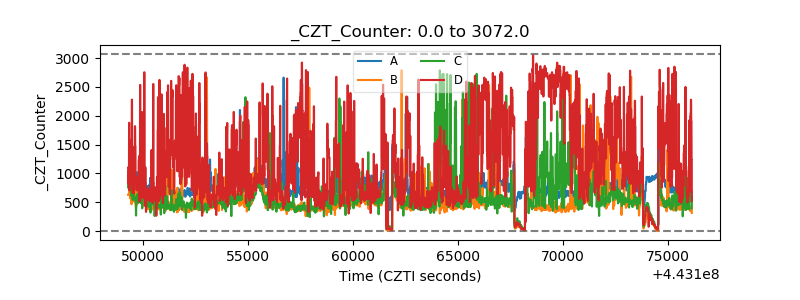 |
| +2.5 Volts monitor | 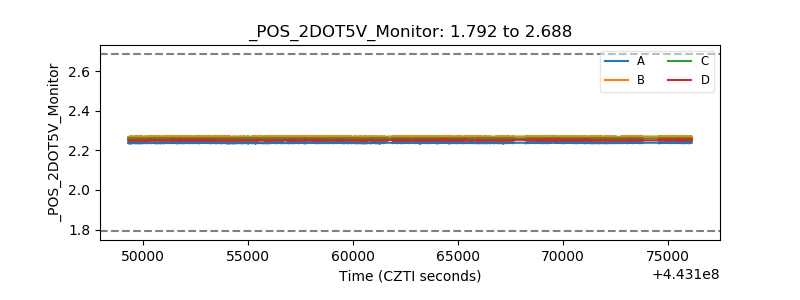 |
| +5 Volts monitor | 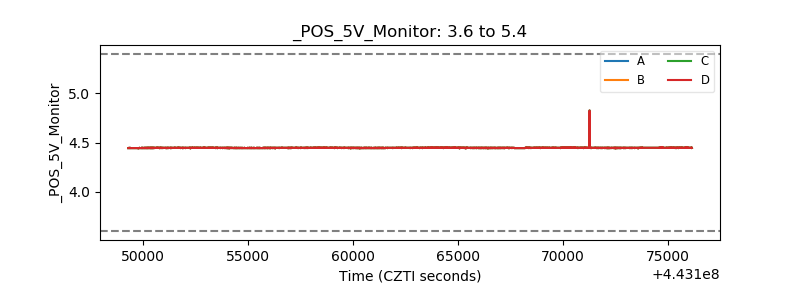 |
| _ROLL_ROT | 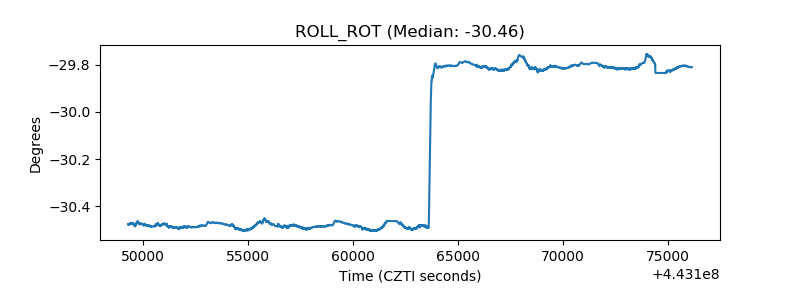 |
| _Roll_DEC | 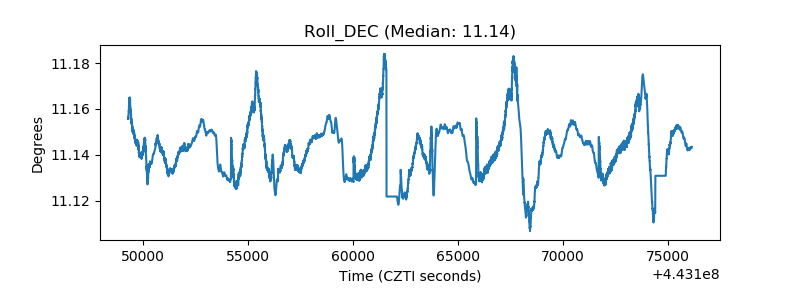 |
| _Roll_RA | 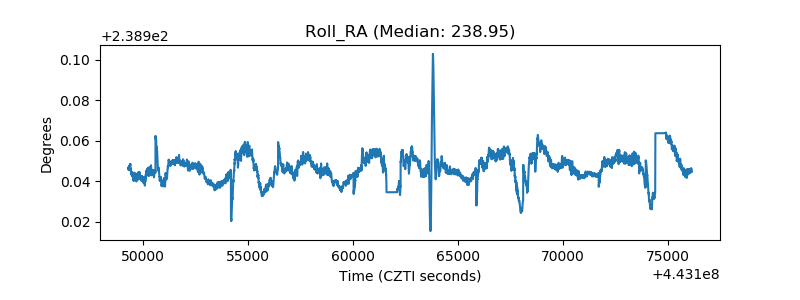 |
| Veto Counter | 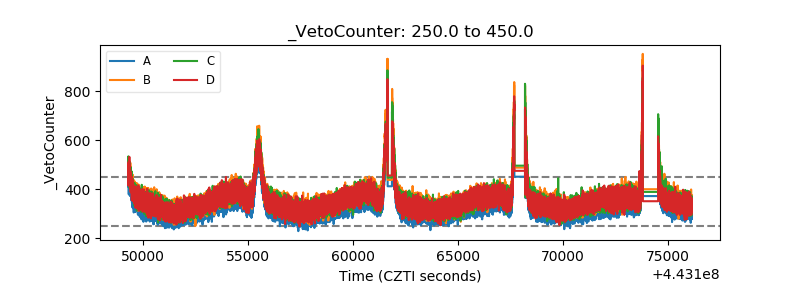 |