| Param | Original file | Final file |
|---|---|---|
| Filename | modeM0/AS1A13_017T02_9000006032_44904cztM0_level2.fits | modeM0/AS1A13_017T02_9000006032_44904cztM0_level2_quad_clean.evt |
| Size (bytes) | 623,966,400 | 92,053,440 |
| Size | 595.1 MB | 87.8 MB |
| Events in quadrant A | 4,650,284 | 654,941 |
| Events in quadrant B | 3,464,193 | 675,350 |
| Events in quadrant C | 3,830,131 | 650,808 |
| Events in quadrant D | 10,677,490 | 377,532 |
| Mode SS | |||
|---|---|---|---|
| Quadrant | BADHDUFLAG | Total packets | Discarded packets |
| A | 0 | 126 | 0 |
| B | 0 | 126 | 0 |
| C | 0 | 126 | 0 |
| D | 0 | 126 | 0 |
| Mode M0 | |||
|---|---|---|---|
| Quadrant | BADHDUFLAG | Total packets | Discarded packets |
| A | 0 | 18792 | 1 |
| B | 0 | 14421 | 1 |
| C | 0 | 15642 | 1 |
| D | 0 | 35968 | 4 |
| Mode M9 | |||
|---|---|---|---|
| Quadrant | BADHDUFLAG | Total packets | Discarded packets |
| A | 0 | 8 | 0 |
| B | 0 | 8 | 0 |
| C | 0 | 8 | 0 |
| D | 0 | 8 | 0 |
| Quadrant | Total seconds | Saturated seconds | Saturation percentage |
|---|---|---|---|
| A | 6131 | 127 | 2.071440% |
| B | 6131 | 134 | 2.185614% |
| C | 6131 | 75 | 1.223291% |
| D | 6130 | 2650 | 43.230016% |
Noise dominated data is calculated using 1-second bins in cleaned event files. If a bin has >2000 counts, and if more than 50% of those come from <1% of pixels, then it is considered to be noise-dominated and hence unusable.
| Quadrant | # 1 sec bins | Bins with >0 counts | Bins with >2000 counts | High rate bins dominated by noise | Noise dominated (total time) | Noise dominated (detector-on time) | Marked lightcurve |
|---|---|---|---|---|---|---|---|
| A | 7006 | 6132 | 2 | 2 | 0.03% | 0.03% | 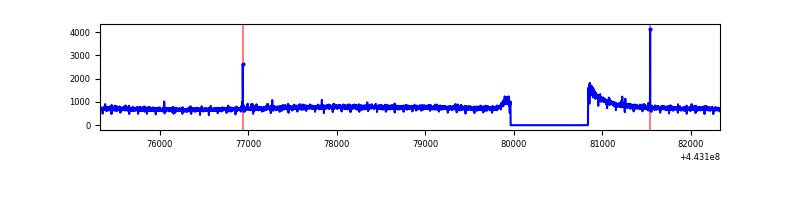 |
| B | 7006 | 6132 | 30 | 30 | 0.43% | 0.49% | 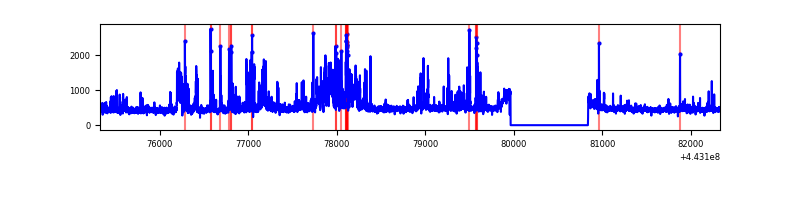 |
| C | 7006 | 6132 | 11 | 11 | 0.16% | 0.18% | 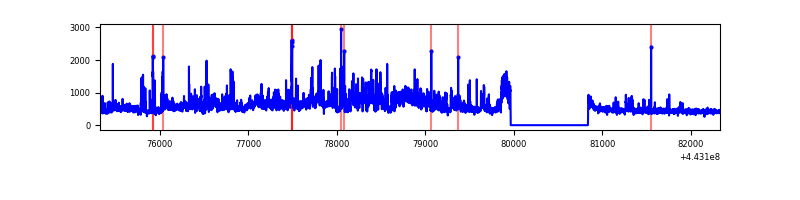 |
| D | 7005 | 6131 | 2353 | 2353 | 33.59% | 38.38% | 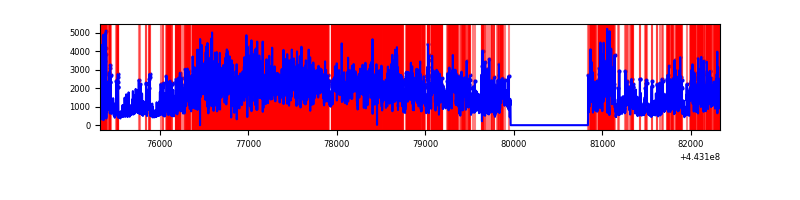 |
Top three noisy pixels from each quadrant. If the there are fewer than three noisy pixels in the level2.evt file, extra rows are filled as -1
| Pixel properties | Quadrant properties | ||||||
|---|---|---|---|---|---|---|---|
| Quadrant | DetID | PixID | Counts | Sigma | Mean | Median | Sigma |
| A | 10 | 83 | 1969963 | 13629.15 | 690 | 675 | 144.5 |
| A | 13 | 248 | 9458 | 60.78 | 690 | 675 | 144.5 |
| A | 3 | 137 | 7782 | 49.18 | 690 | 675 | 144.5 |
| B | 0 | 219 | 577681 | 4194.93 | 686 | 665 | 137.6 |
| B | 0 | 168 | 41689 | 298.25 | 686 | 665 | 137.6 |
| B | 0 | 190 | 33098 | 235.79 | 686 | 665 | 137.6 |
| C | 9 | 54 | 1136774 | 7052.15 | 678 | 684 | 161.1 |
| C | 2 | 14 | 18801 | 112.46 | 678 | 684 | 161.1 |
| C | 12 | 2 | 10003 | 57.85 | 678 | 684 | 161.1 |
| D | 12 | 33 | 5251295 | 35459.22 | 568 | 549 | 148.1 |
| D | 1 | 52 | 894191 | 6034.92 | 568 | 549 | 148.1 |
| D | 13 | 187 | 807267 | 5447.91 | 568 | 549 | 148.1 |
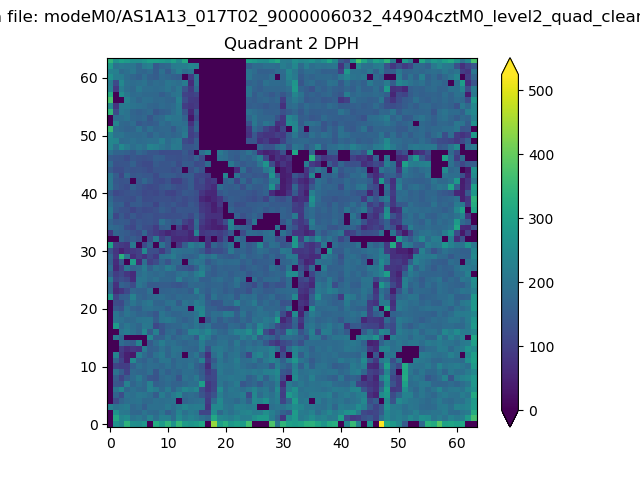
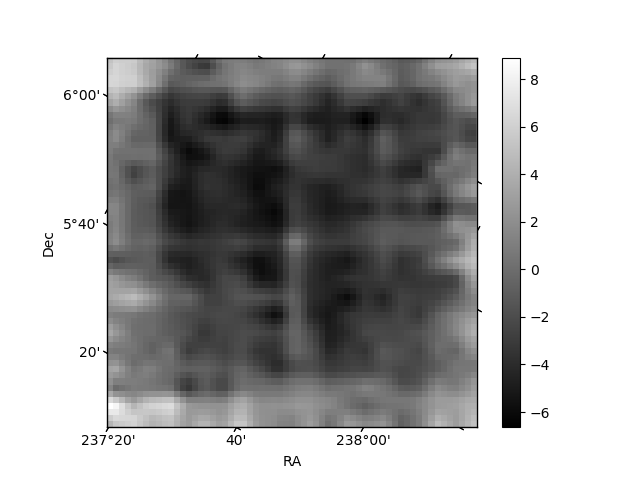
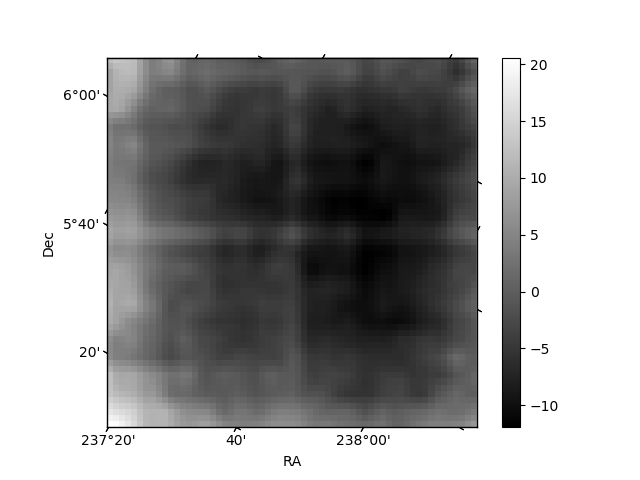
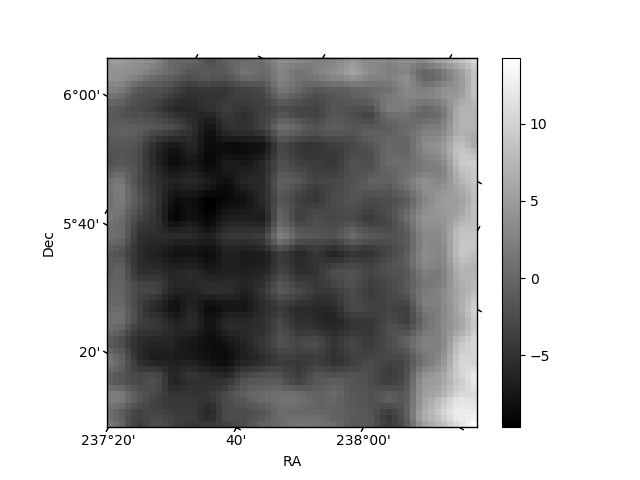
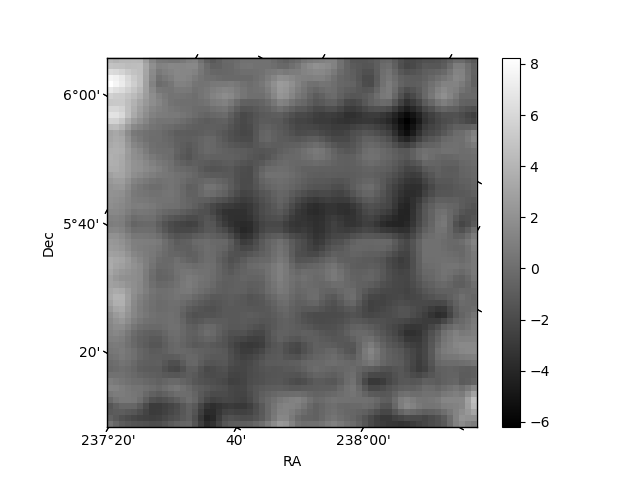
Histogram calculated using DETX and DETY for each event in the final _common_clean file
| Quadrant A | 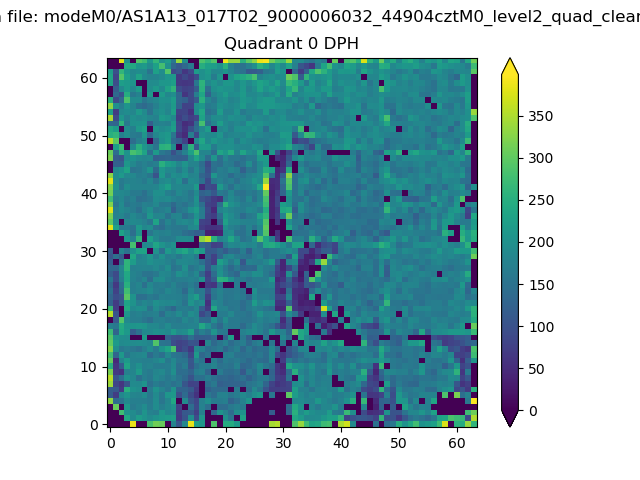 |
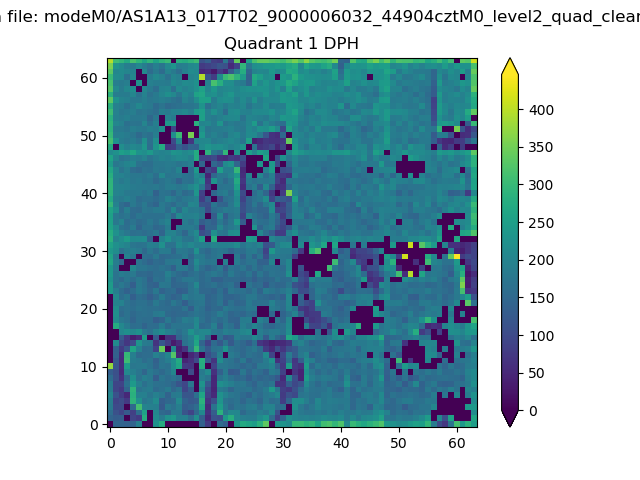 |
Quadrant B |
|---|---|---|---|
| Quadrant D | 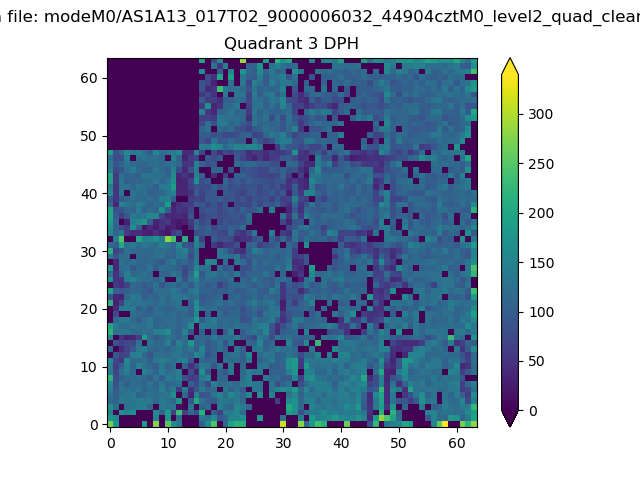 |
 |
Quadrant C |
| Plot type | Count rate plots | Images |
|---|---|---|
| Comparison with Poisson distribution Blue bars denote a histogram of data divided into 1 sec bins. Red curve is a Poisson curve with rate = median count rate of data. |
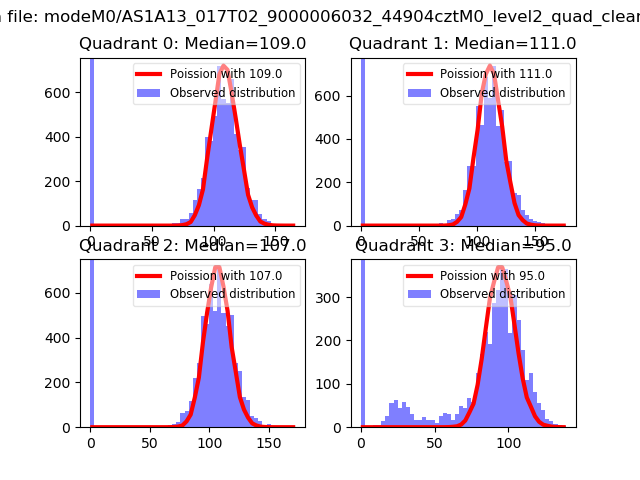 |
 |
| Quadrant-wise count rates Data is divided into 100 sec bins |
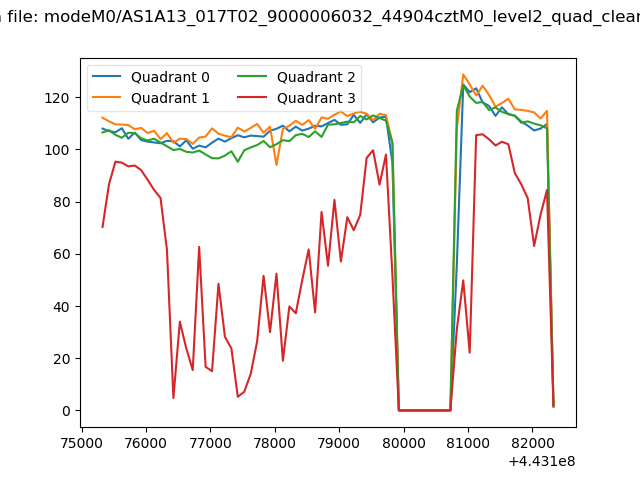 |
|
| Module-wise count rates for Quadrant A Data is divided into 100 sec bins |
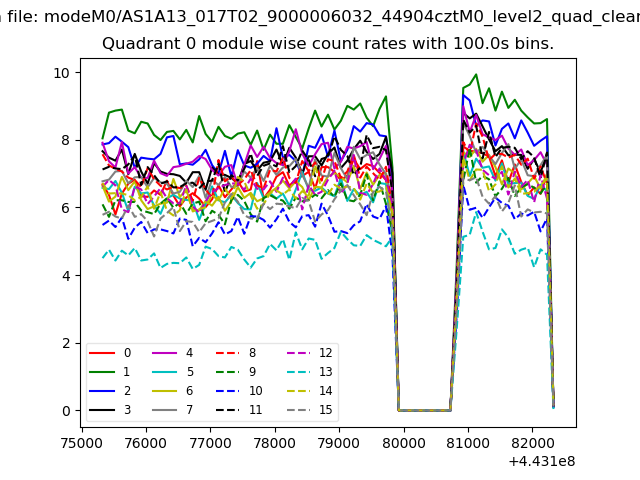 |
 |
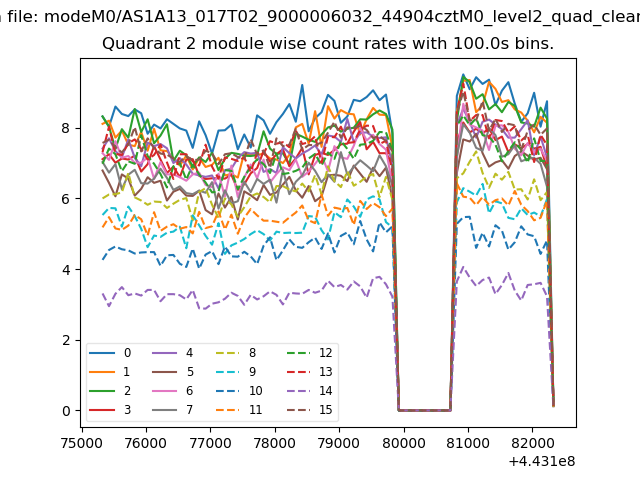
| Module-wise count rates for Quadrant B Data is divided into 100 sec bins |
 |
 |
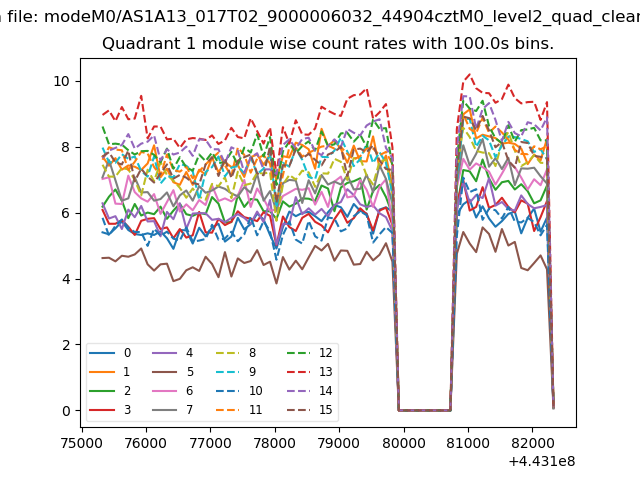
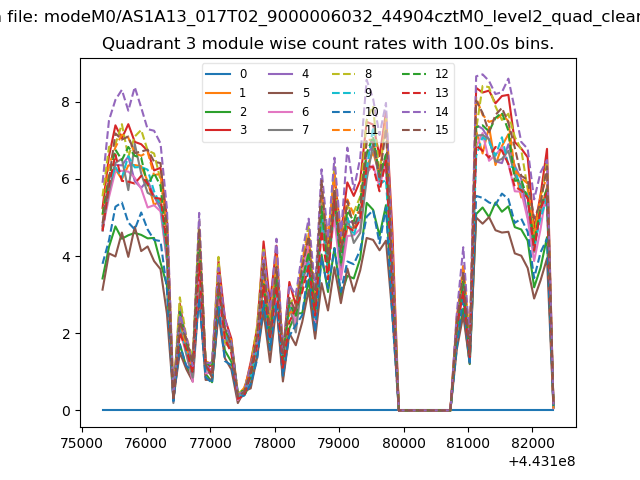
| Module-wise count rates for Quadrant C Data is divided into 100 sec bins |
 |
 |
| Module-wise count rates for Quadrant D Data is divided into 100 sec bins |
 |
 |
| Parameter | Plot |
|---|---|
| CZT HV Monitor | 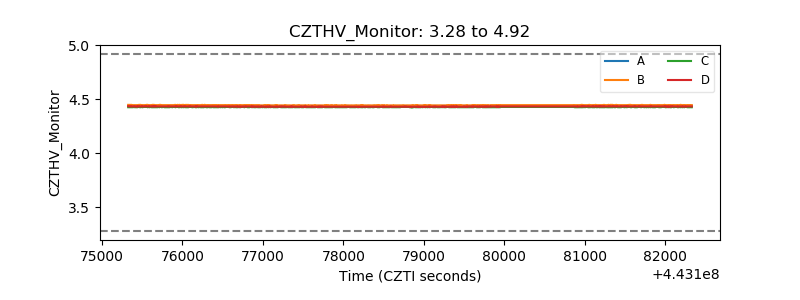 |
| D_VDD | 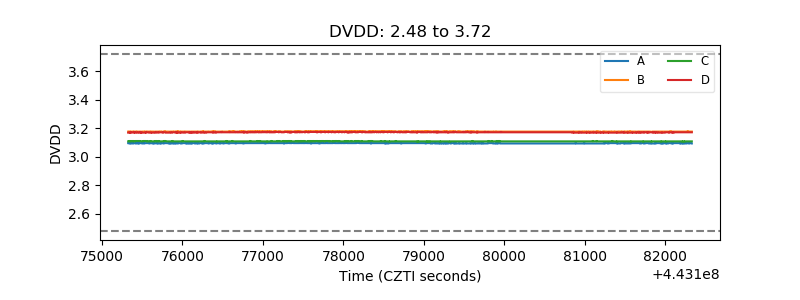 |
| Temperature 1 | 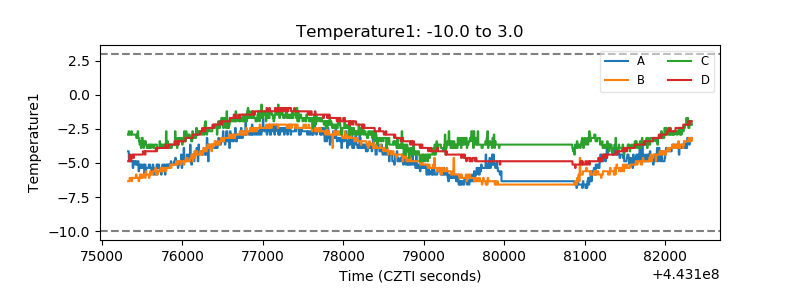 |
| Veto HV Monitor | 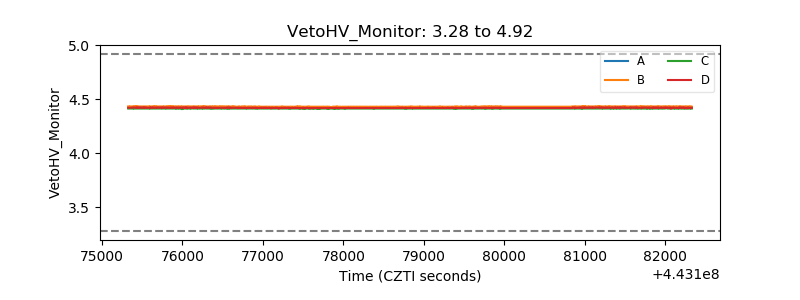 |
| Veto LLD | 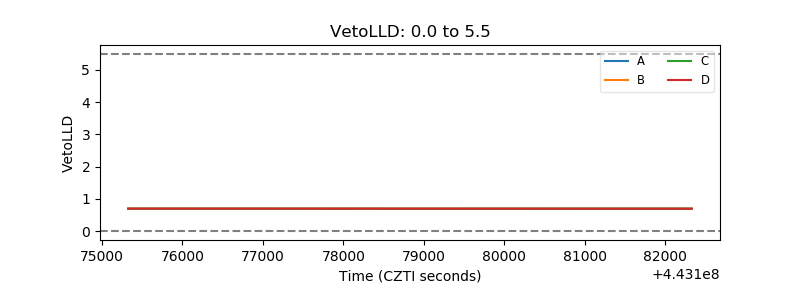 |
| Alpha Counter | 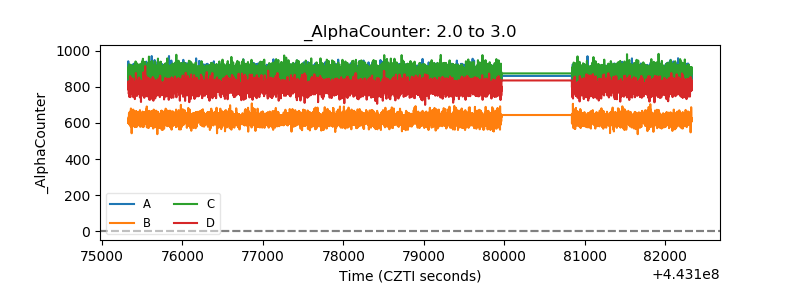 |
| _CPM_Rate | 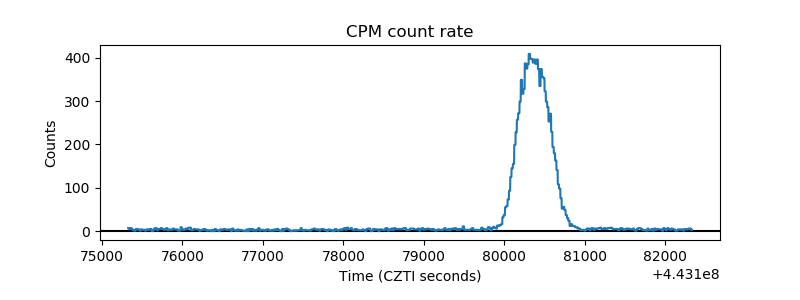 |
| CZT Counter | 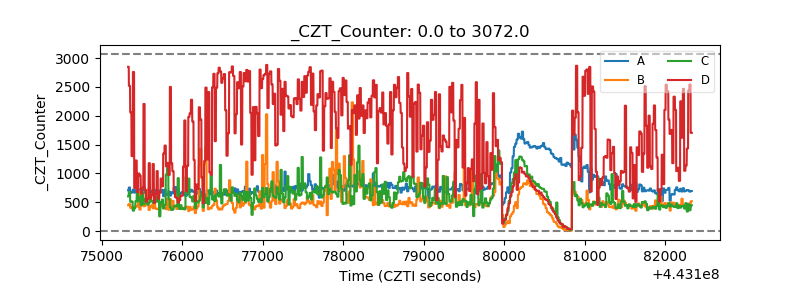 |
| +2.5 Volts monitor | 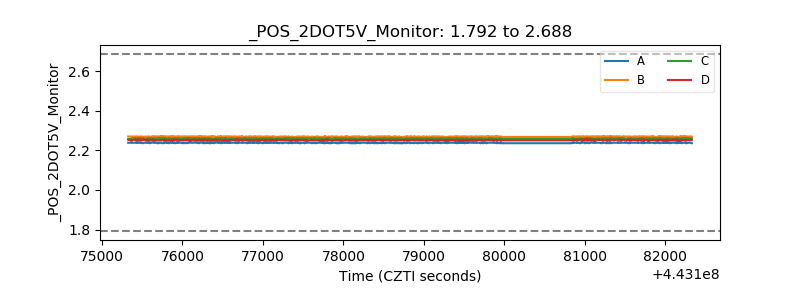 |
| +5 Volts monitor | 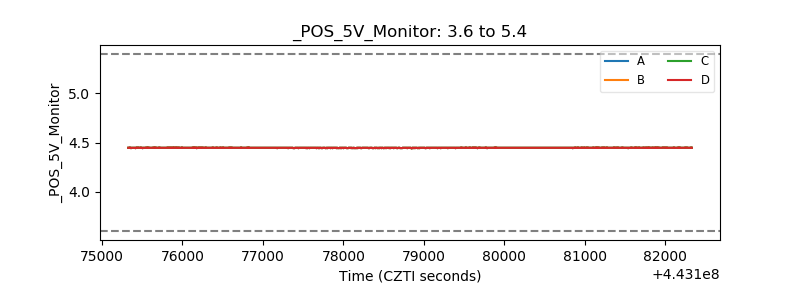 |
| _ROLL_ROT | 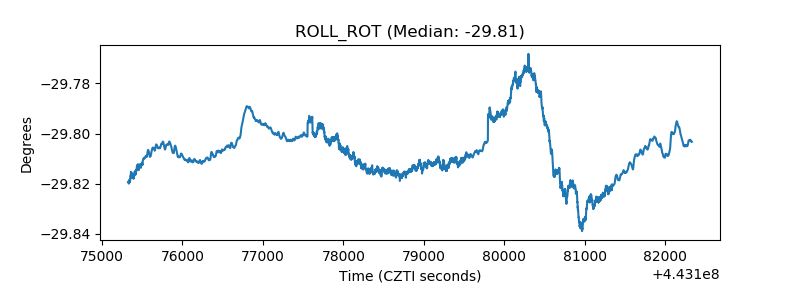 |
| _Roll_DEC | 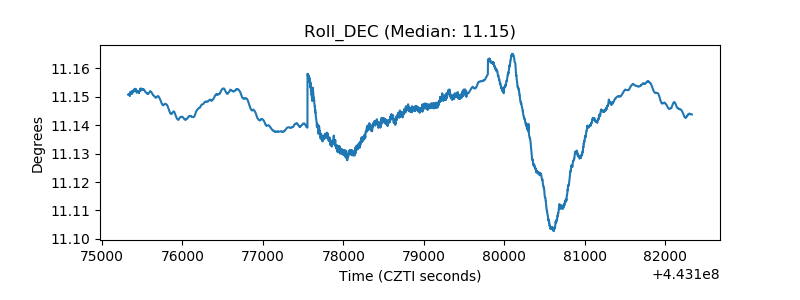 |
| _Roll_RA | 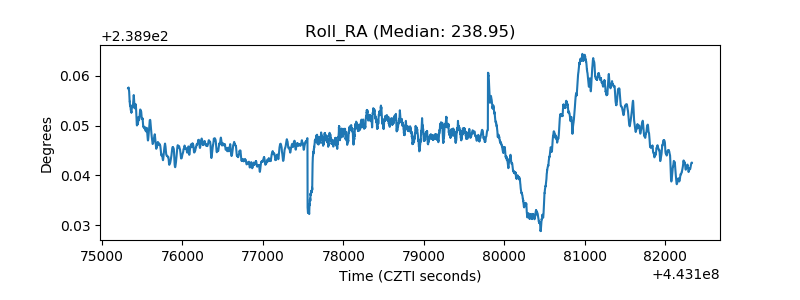 |
| Veto Counter | 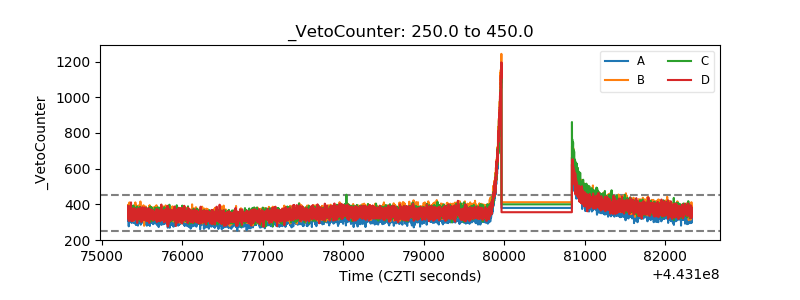 |