| Param | Original file | Final file |
|---|---|---|
| Filename | modeM0/AS1A13_017T02_9000006032_44906cztM0_level2.fits | modeM0/AS1A13_017T02_9000006032_44906cztM0_level2_quad_clean.evt |
| Size (bytes) | 556,606,080 | 105,857,280 |
| Size | 530.8 MB | 101.0 MB |
| Events in quadrant A | 5,285,283 | 727,322 |
| Events in quadrant B | 3,299,960 | 753,047 |
| Events in quadrant C | 2,983,743 | 729,634 |
| Events in quadrant D | 8,529,152 | 540,556 |
| Mode SS | |||
|---|---|---|---|
| Quadrant | BADHDUFLAG | Total packets | Discarded packets |
| A | 0 | 132 | 0 |
| B | 0 | 132 | 0 |
| C | 0 | 132 | 0 |
| D | 0 | 132 | 0 |
| Mode M0 | |||
|---|---|---|---|
| Quadrant | BADHDUFLAG | Total packets | Discarded packets |
| A | 0 | 20694 | 1 |
| B | 0 | 13919 | 1 |
| C | 0 | 13368 | 1 |
| D | 0 | 29844 | 1 |
| Mode M9 | |||
|---|---|---|---|
| Quadrant | BADHDUFLAG | Total packets | Discarded packets |
| A | 0 | 10 | 0 |
| B | 0 | 10 | 0 |
| C | 0 | 10 | 0 |
| D | 0 | 10 | 0 |
| Quadrant | Total seconds | Saturated seconds | Saturation percentage |
|---|---|---|---|
| A | 6520 | 171 | 2.622699% |
| B | 6520 | 103 | 1.579755% |
| C | 6521 | 49 | 0.751418% |
| D | 6521 | 1526 | 23.401319% |
Noise dominated data is calculated using 1-second bins in cleaned event files. If a bin has >2000 counts, and if more than 50% of those come from <1% of pixels, then it is considered to be noise-dominated and hence unusable.
| Quadrant | # 1 sec bins | Bins with >0 counts | Bins with >2000 counts | High rate bins dominated by noise | Noise dominated (total time) | Noise dominated (detector-on time) | Marked lightcurve |
|---|---|---|---|---|---|---|---|
| A | 7570 | 6521 | 34 | 34 | 0.45% | 0.52% | 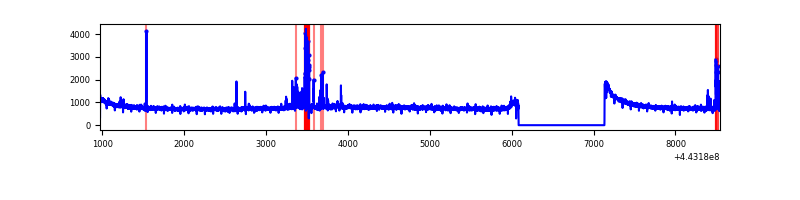 |
| B | 7570 | 6521 | 28 | 28 | 0.37% | 0.43% | 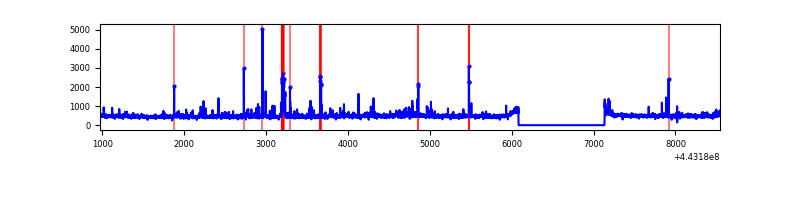 |
| C | 7571 | 6522 | 4 | 4 | 0.05% | 0.06% | 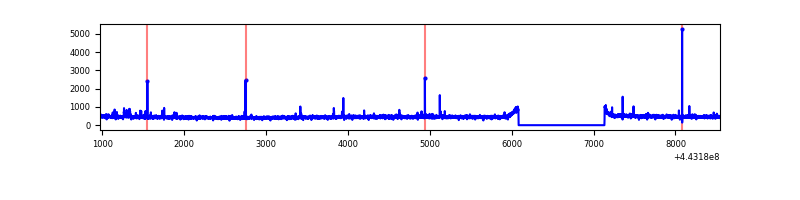 |
| D | 7571 | 6522 | 1355 | 1355 | 17.90% | 20.78% | 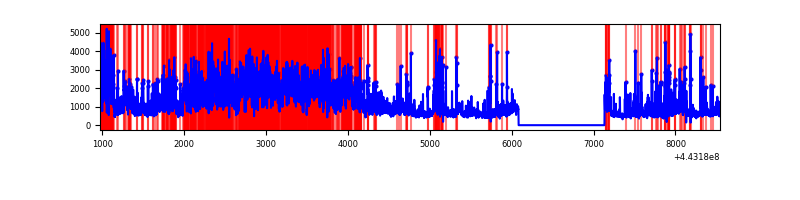 |
Top three noisy pixels from each quadrant. If the there are fewer than three noisy pixels in the level2.evt file, extra rows are filled as -1
| Pixel properties | Quadrant properties | ||||||
|---|---|---|---|---|---|---|---|
| Quadrant | DetID | PixID | Counts | Sigma | Mean | Median | Sigma |
| A | 10 | 83 | 2185897 | 14013.6 | 750 | 734 | 155.9 |
| A | 13 | 248 | 184618 | 1179.26 | 750 | 734 | 155.9 |
| A | 3 | 137 | 8222 | 48.02 | 750 | 734 | 155.9 |
| B | 0 | 168 | 109560 | 736.03 | 747 | 726 | 147.9 |
| B | 0 | 219 | 60920 | 407.08 | 747 | 726 | 147.9 |
| B | 0 | 183 | 35215 | 233.24 | 747 | 726 | 147.9 |
| C | 12 | 2 | 28939 | 162.07 | 742 | 746 | 174.0 |
| C | 9 | 54 | 27097 | 151.48 | 742 | 746 | 174.0 |
| C | 2 | 14 | 11635 | 62.59 | 742 | 746 | 174.0 |
| D | 12 | 33 | 3122293 | 18234.62 | 681 | 662 | 171.2 |
| D | 13 | 249 | 630798 | 3680.86 | 681 | 662 | 171.2 |
| D | 13 | 171 | 565232 | 3297.87 | 681 | 662 | 171.2 |
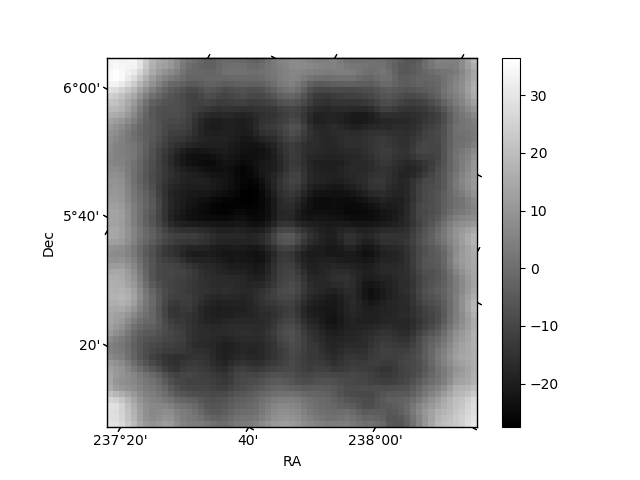
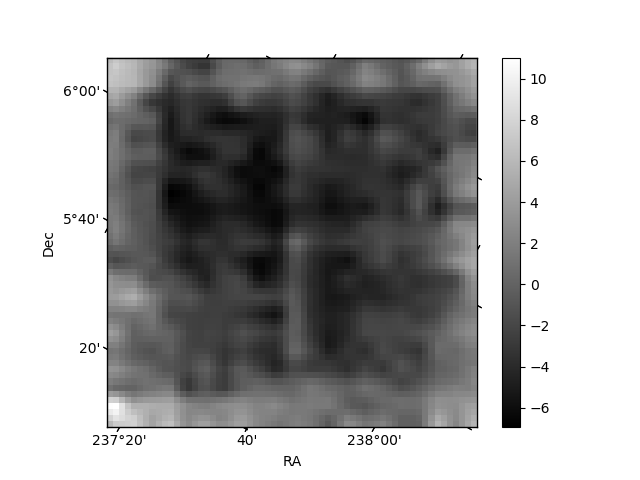
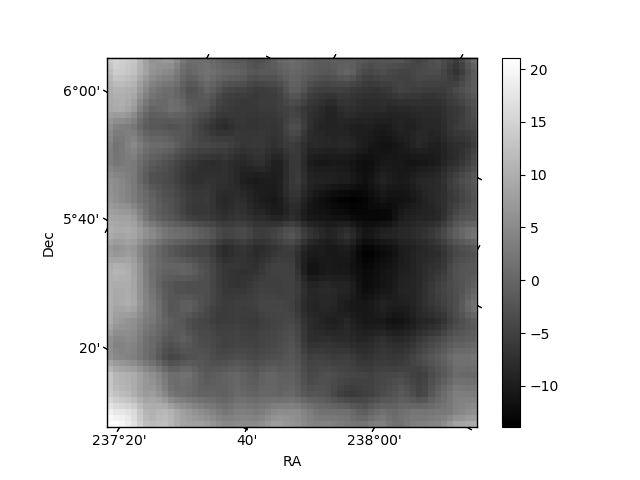
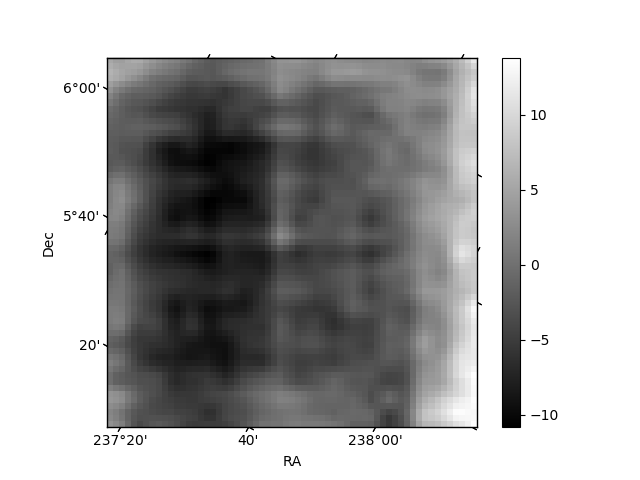
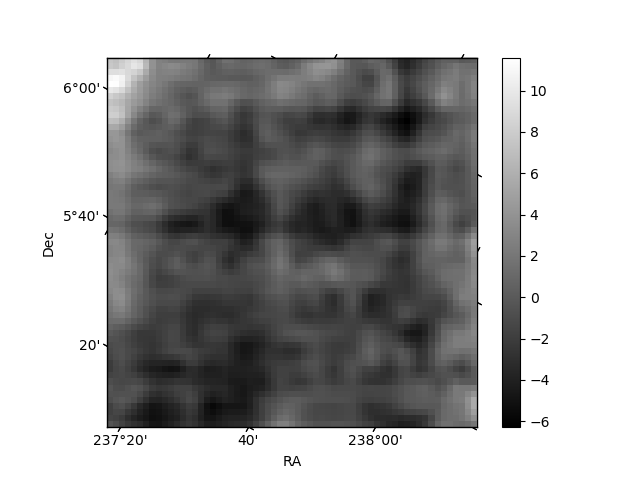
Histogram calculated using DETX and DETY for each event in the final _common_clean file
| Quadrant A | 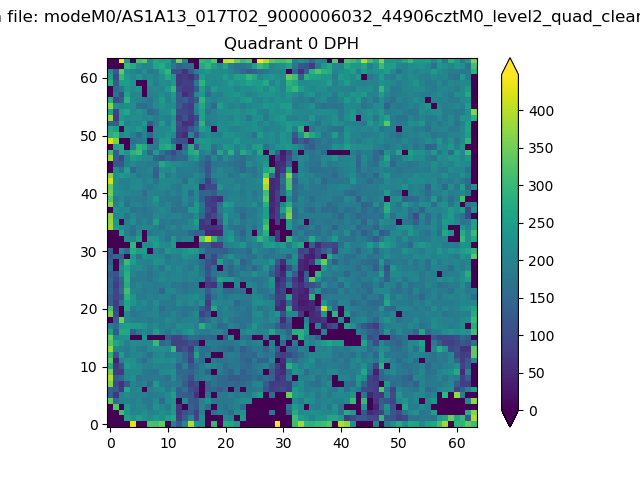 |
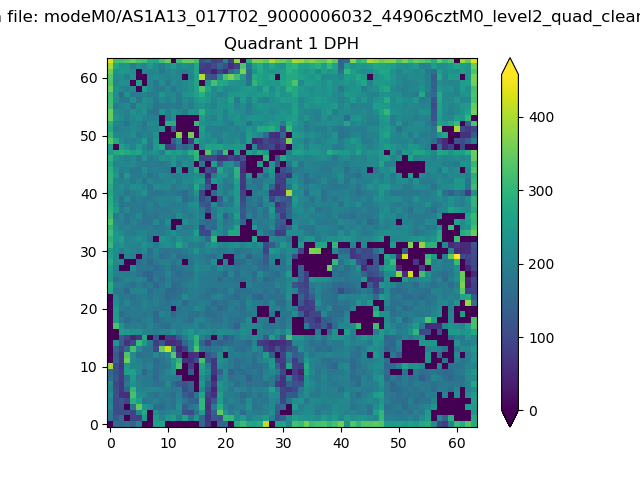 |
Quadrant B |
|---|---|---|---|
| Quadrant D | 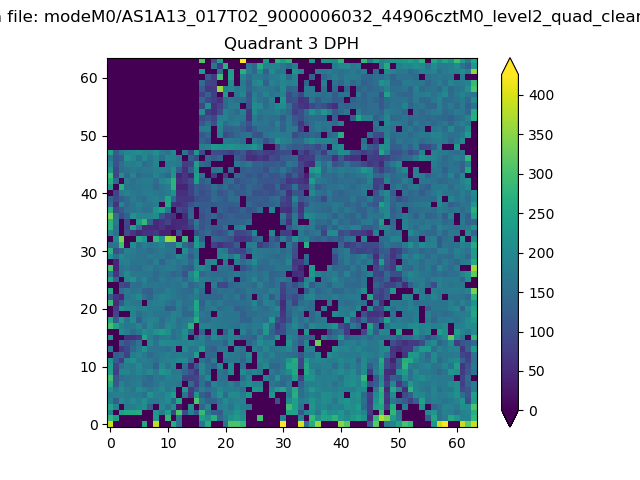 |
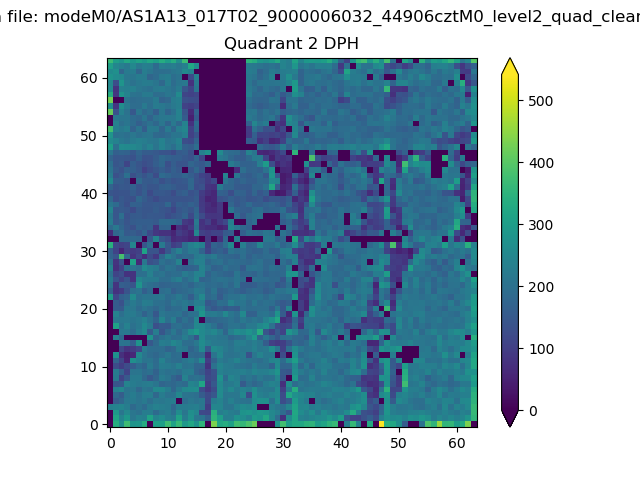 |
Quadrant C |
| Plot type | Count rate plots | Images |
|---|---|---|
| Comparison with Poisson distribution Blue bars denote a histogram of data divided into 1 sec bins. Red curve is a Poisson curve with rate = median count rate of data. |
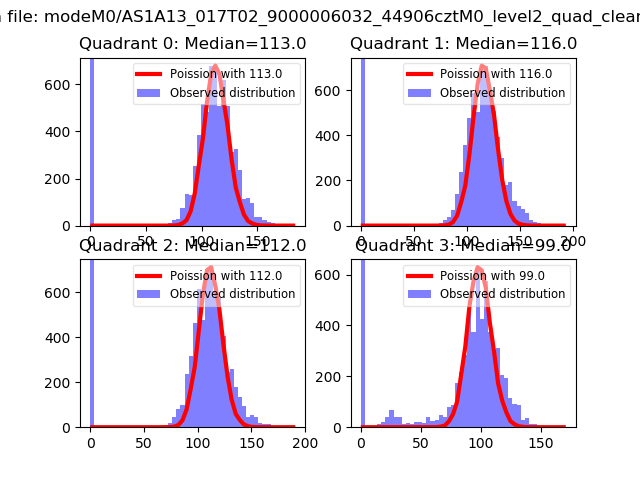 |
 |
| Quadrant-wise count rates Data is divided into 100 sec bins |
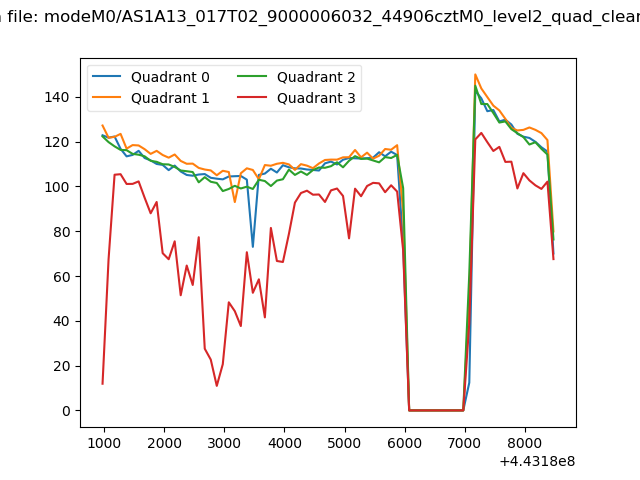 |
|
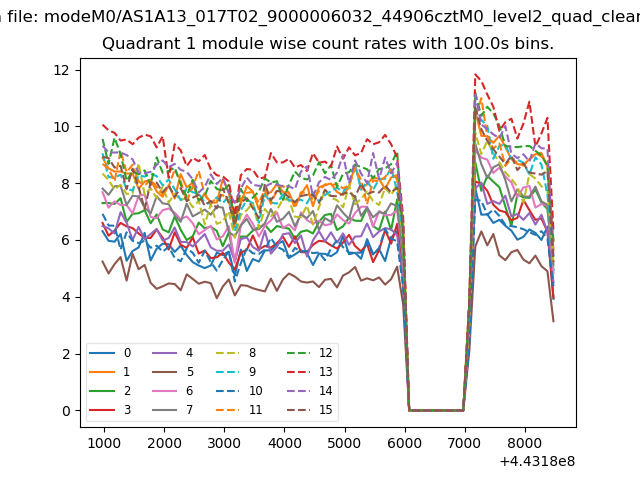
| Module-wise count rates for Quadrant A Data is divided into 100 sec bins |
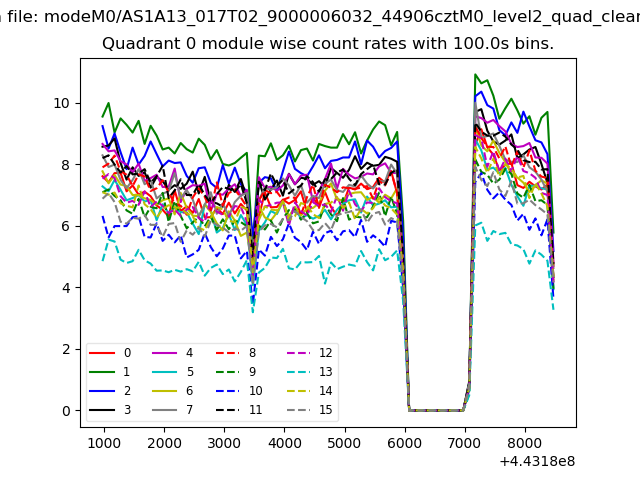 |
 |
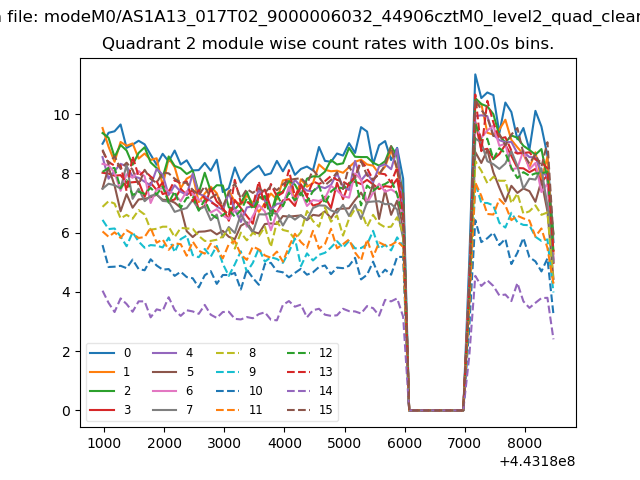
| Module-wise count rates for Quadrant B Data is divided into 100 sec bins |
 |
 |
| Module-wise count rates for Quadrant C Data is divided into 100 sec bins |
 |
 |
| Module-wise count rates for Quadrant D Data is divided into 100 sec bins |
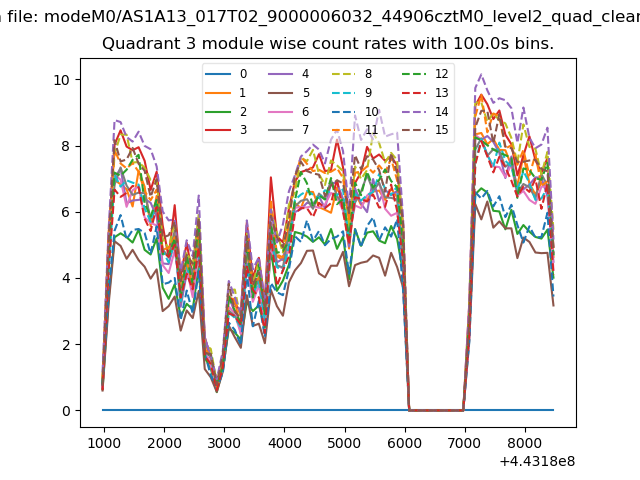 |
 |
| Parameter | Plot |
|---|---|
| CZT HV Monitor | 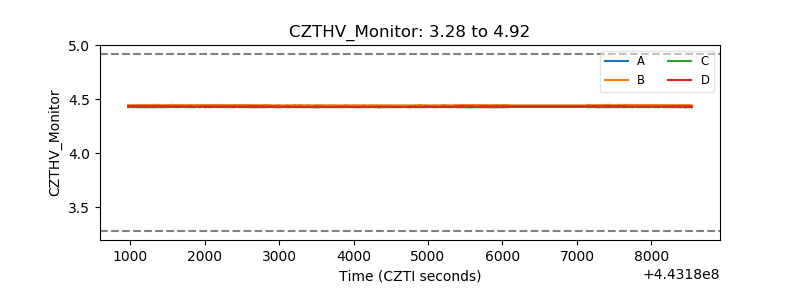 |
| D_VDD | 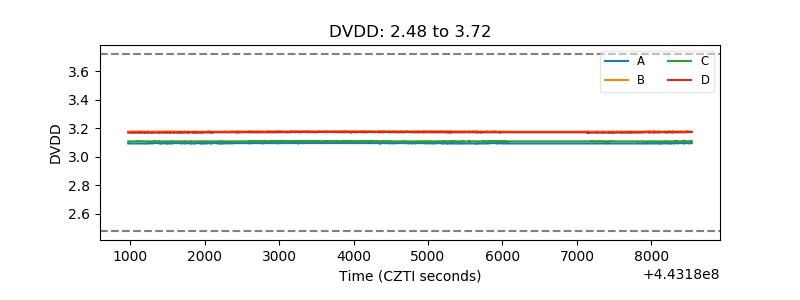 |
| Temperature 1 | 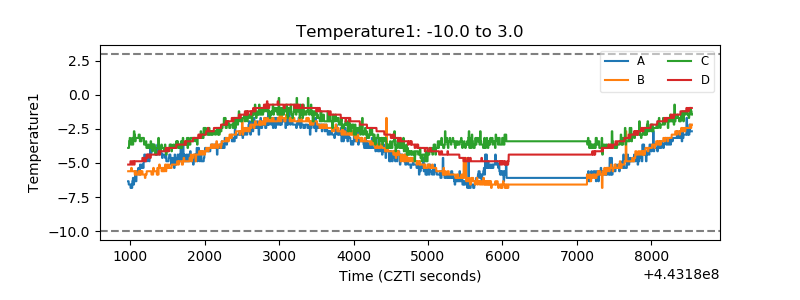 |
| Veto HV Monitor | 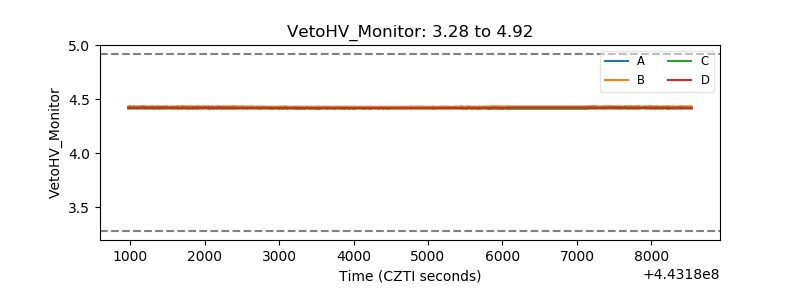 |
| Veto LLD | 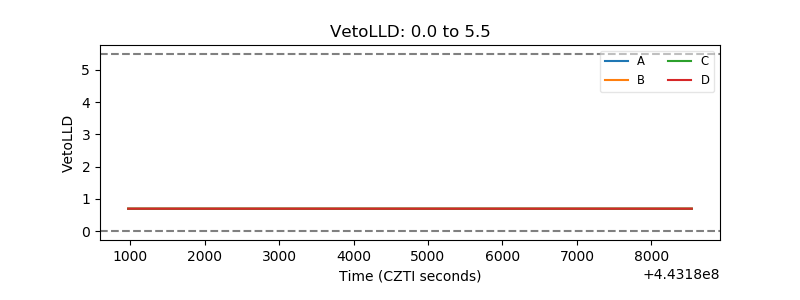 |
| Alpha Counter | 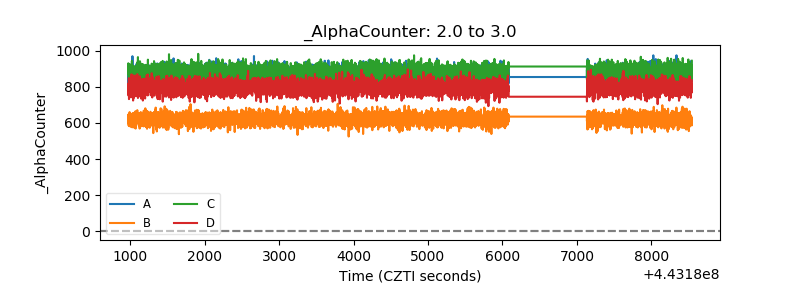 |
| _CPM_Rate | 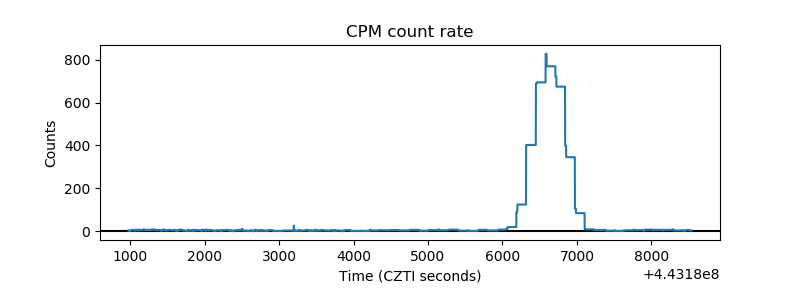 |
| CZT Counter | 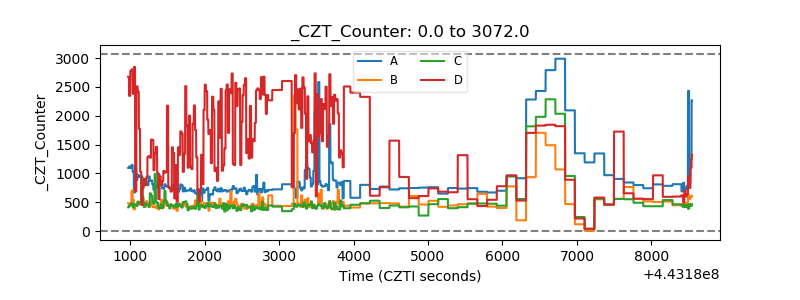 |
| +2.5 Volts monitor | 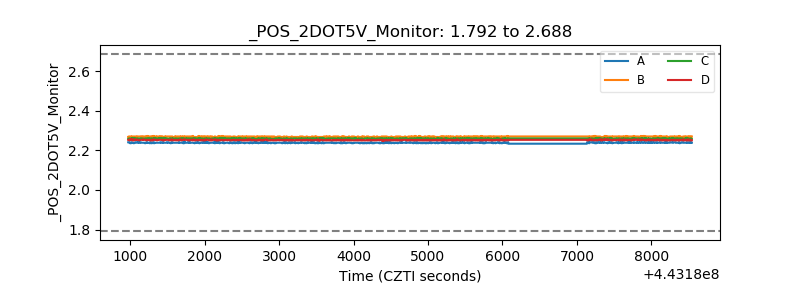 |
| +5 Volts monitor | 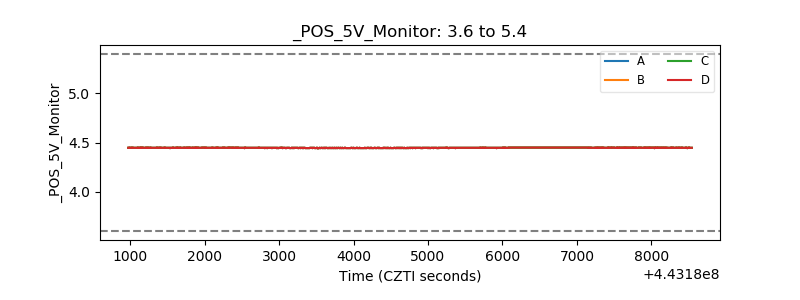 |
| _ROLL_ROT | 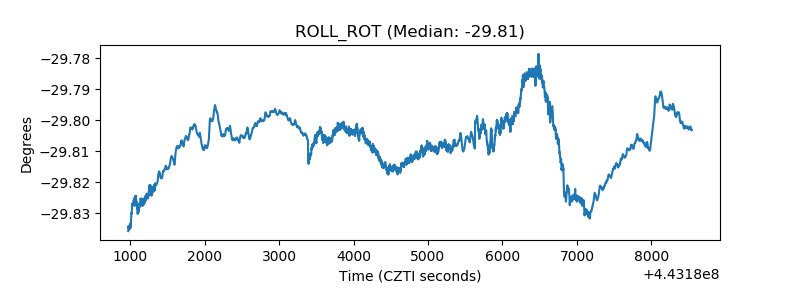 |
| _Roll_DEC | 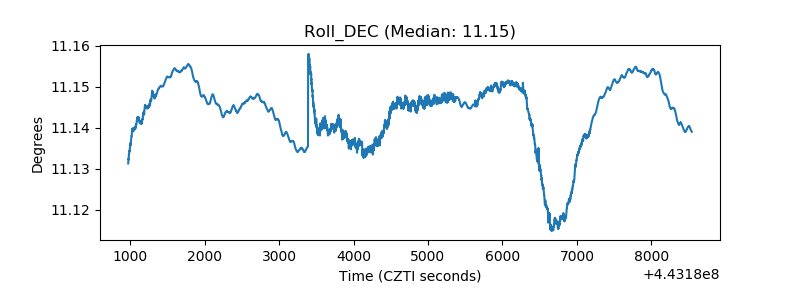 |
| _Roll_RA | 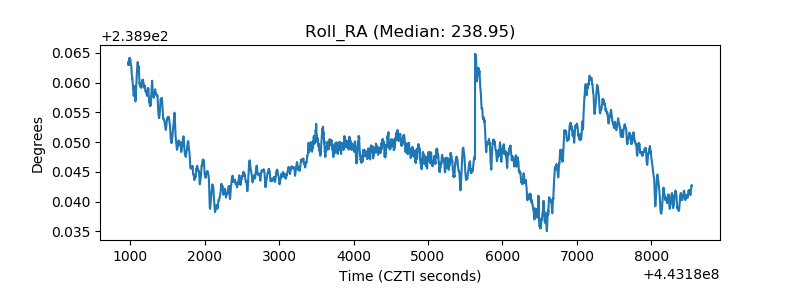 |
| Veto Counter | 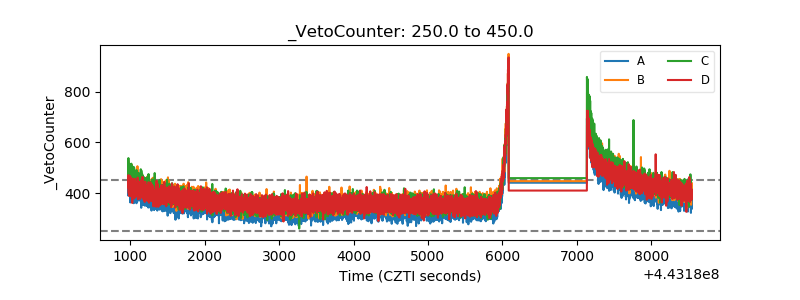 |