| Param | Original file | Final file |
|---|---|---|
| Filename | modeM0/AS1A13_017T02_9000006032_44907cztM0_level2.fits | modeM0/AS1A13_017T02_9000006032_44907cztM0_level2_quad_clean.evt |
| Size (bytes) | 498,605,760 | 102,602,880 |
| Size | 475.5 MB | 97.8 MB |
| Events in quadrant A | 4,849,348 | 692,505 |
| Events in quadrant B | 3,100,217 | 721,683 |
| Events in quadrant C | 3,941,919 | 691,956 |
| Events in quadrant D | 6,111,603 | 591,192 |
| Mode SS | |||
|---|---|---|---|
| Quadrant | BADHDUFLAG | Total packets | Discarded packets |
| A | 0 | 120 | 0 |
| B | 0 | 120 | 0 |
| C | 0 | 120 | 0 |
| D | 0 | 120 | 0 |
| Mode M0 | |||
|---|---|---|---|
| Quadrant | BADHDUFLAG | Total packets | Discarded packets |
| A | 0 | 18654 | 3 |
| B | 0 | 12852 | 1 |
| C | 0 | 15626 | 1 |
| D | 0 | 22336 | 1 |
| Mode M9 | |||
|---|---|---|---|
| Quadrant | BADHDUFLAG | Total packets | Discarded packets |
| A | 0 | 12 | 0 |
| B | 0 | 12 | 0 |
| C | 0 | 12 | 0 |
| D | 0 | 12 | 0 |
| Quadrant | Total seconds | Saturated seconds | Saturation percentage |
|---|---|---|---|
| A | 5855 | 123 | 2.100769% |
| B | 5856 | 40 | 0.683060% |
| C | 5856 | 39 | 0.665984% |
| D | 5856 | 612 | 10.450820% |
Noise dominated data is calculated using 1-second bins in cleaned event files. If a bin has >2000 counts, and if more than 50% of those come from <1% of pixels, then it is considered to be noise-dominated and hence unusable.
| Quadrant | # 1 sec bins | Bins with >0 counts | Bins with >2000 counts | High rate bins dominated by noise | Noise dominated (total time) | Noise dominated (detector-on time) | Marked lightcurve |
|---|---|---|---|---|---|---|---|
| A | 7060 | 5856 | 34 | 34 | 0.48% | 0.58% | 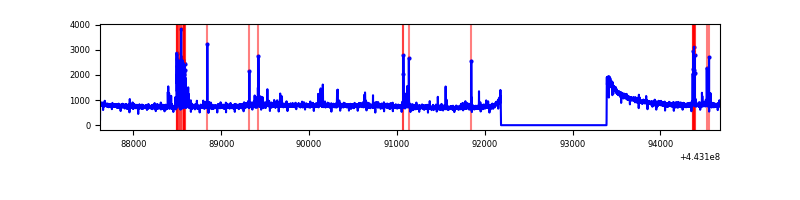 |
| B | 7061 | 5857 | 10 | 10 | 0.14% | 0.17% | 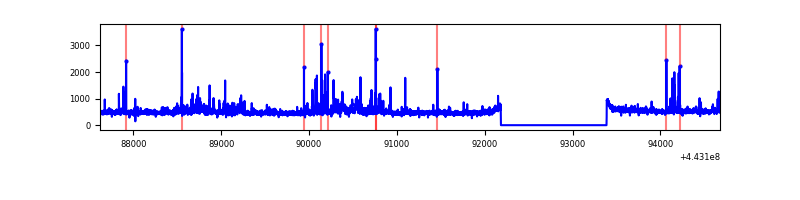 |
| C | 7061 | 5857 | 23 | 23 | 0.33% | 0.39% | 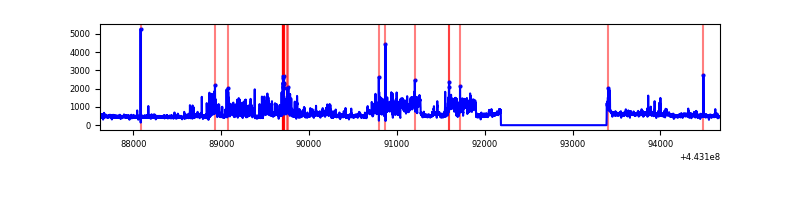 |
| D | 7061 | 5857 | 492 | 492 | 6.97% | 8.40% | 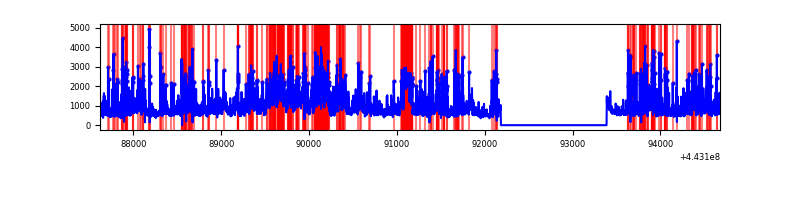 |
Top three noisy pixels from each quadrant. If the there are fewer than three noisy pixels in the level2.evt file, extra rows are filled as -1
| Pixel properties | Quadrant properties | ||||||
|---|---|---|---|---|---|---|---|
| Quadrant | DetID | PixID | Counts | Sigma | Mean | Median | Sigma |
| A | 10 | 83 | 1942923 | 13403.23 | 697 | 684 | 144.9 |
| A | 13 | 248 | 167091 | 1148.36 | 697 | 684 | 144.9 |
| A | 7 | 3 | 20891 | 139.45 | 697 | 684 | 144.9 |
| B | 0 | 155 | 63551 | 462.28 | 695 | 674 | 136.0 |
| B | 0 | 219 | 61610 | 448.0 | 695 | 674 | 136.0 |
| B | 0 | 168 | 55133 | 400.39 | 695 | 674 | 136.0 |
| C | 9 | 54 | 1154736 | 7151.26 | 688 | 695 | 161.4 |
| C | 15 | 208 | 27501 | 166.11 | 688 | 695 | 161.4 |
| C | 12 | 2 | 23096 | 138.81 | 688 | 695 | 161.4 |
| D | 1 | 52 | 941466 | 5579.29 | 667 | 645 | 168.6 |
| D | 12 | 33 | 594913 | 3524.15 | 667 | 645 | 168.6 |
| D | 13 | 249 | 588650 | 3487.0 | 667 | 645 | 168.6 |
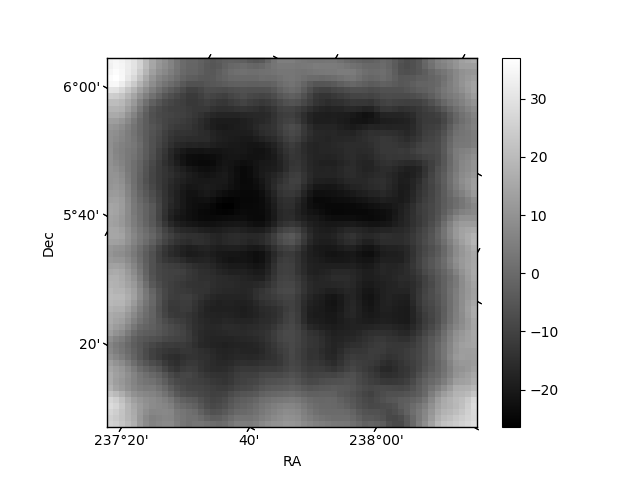
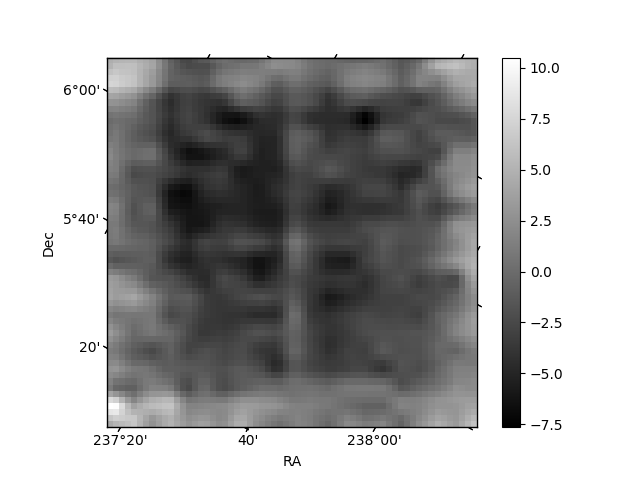
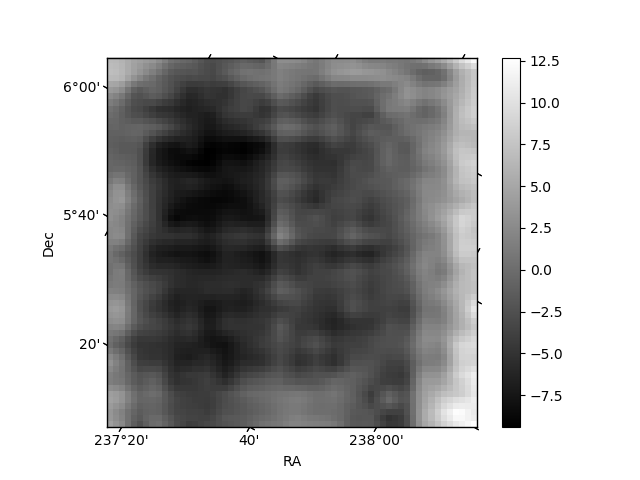
Histogram calculated using DETX and DETY for each event in the final _common_clean file
| Quadrant A | 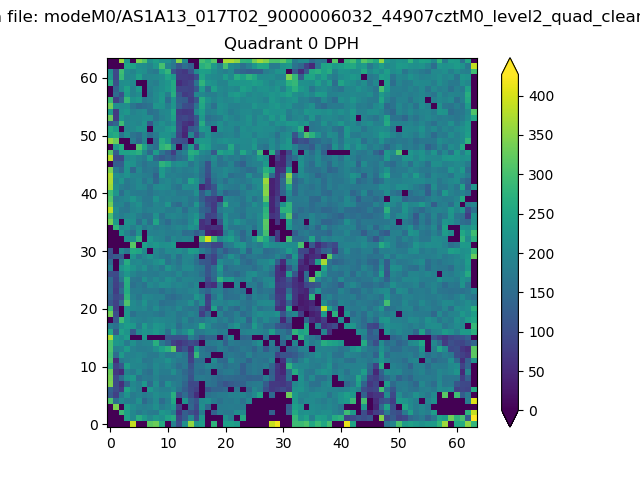 |
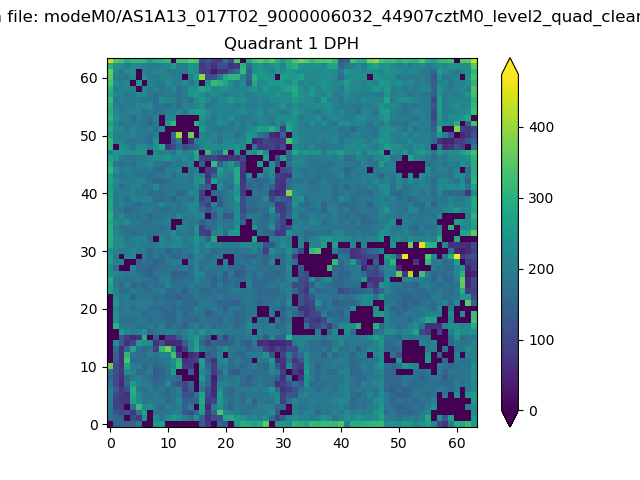 |
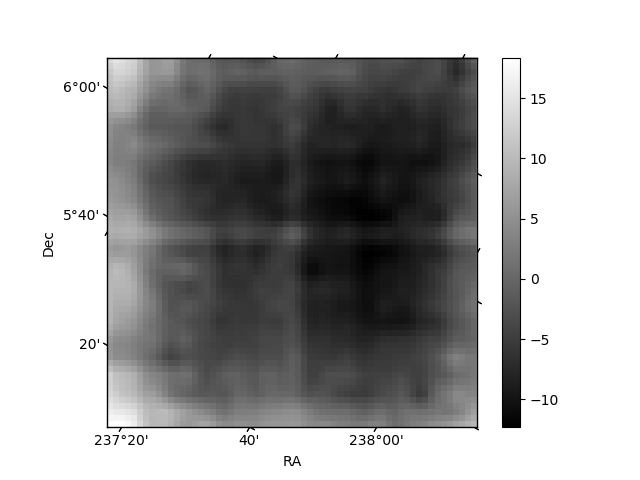
Quadrant B |
|---|---|---|---|
| Quadrant D | 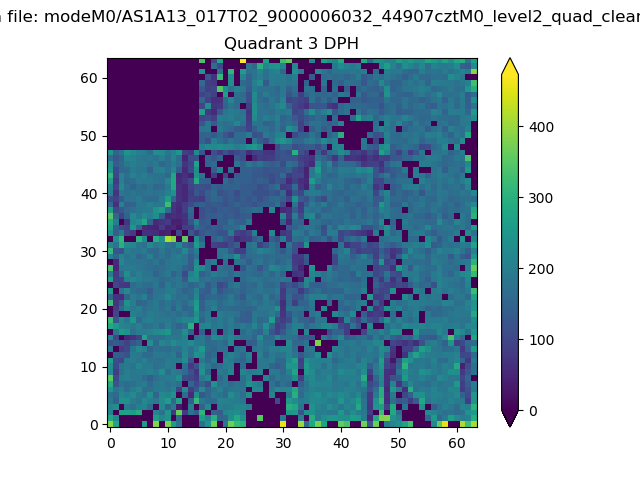 |
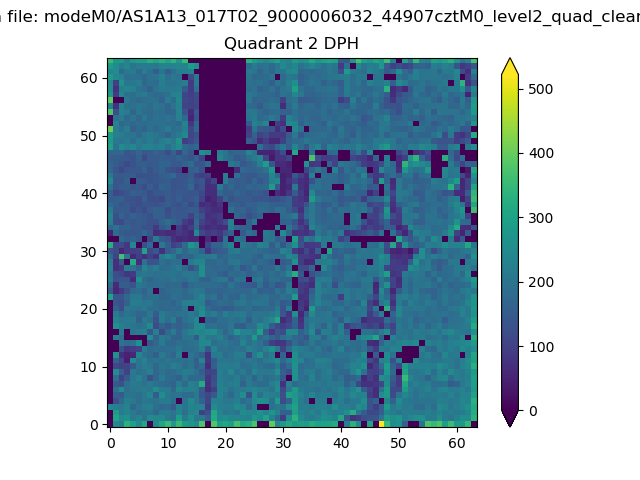 |
Quadrant C |
| Plot type | Count rate plots | Images |
|---|---|---|
| Comparison with Poisson distribution Blue bars denote a histogram of data divided into 1 sec bins. Red curve is a Poisson curve with rate = median count rate of data. |
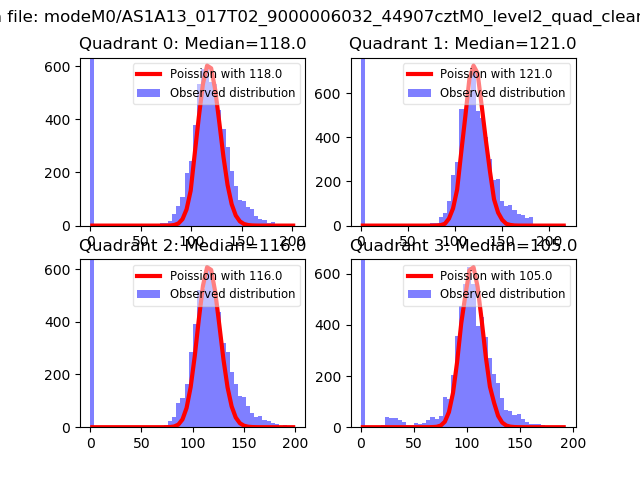 |
 |
| Quadrant-wise count rates Data is divided into 100 sec bins |
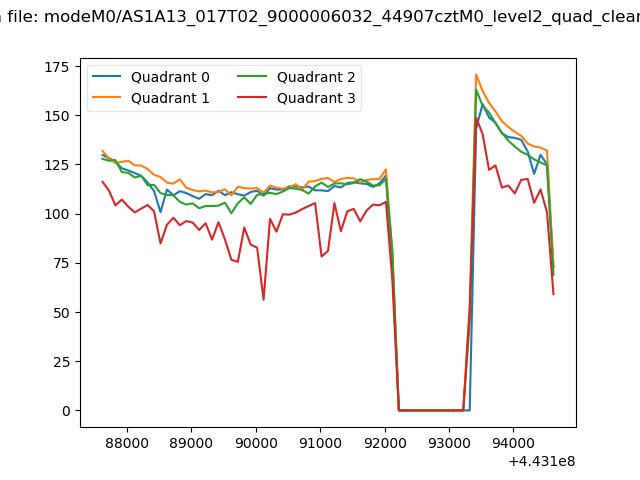 |
|
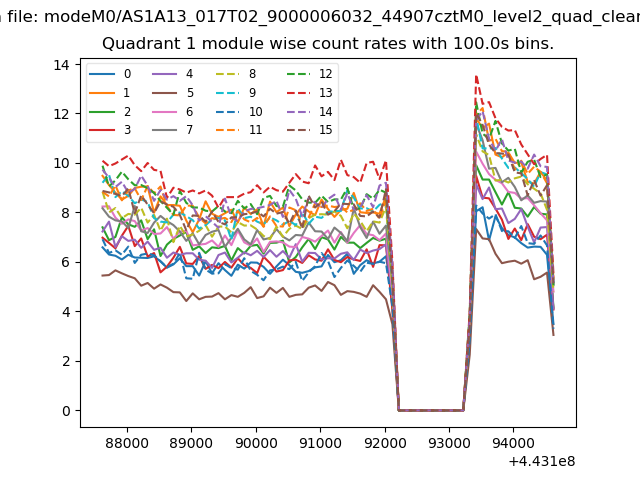
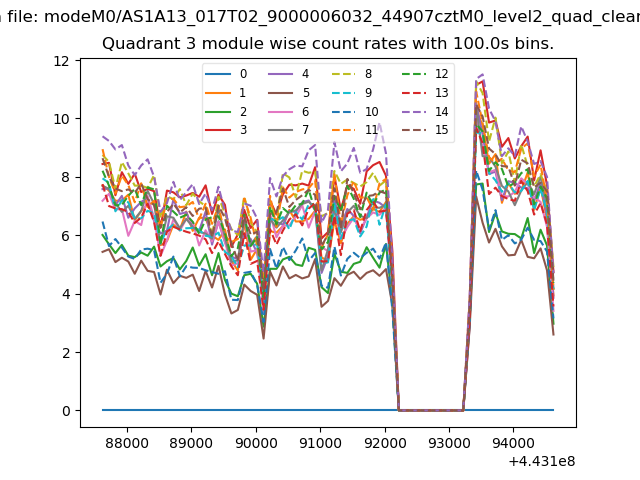
| Module-wise count rates for Quadrant A Data is divided into 100 sec bins |
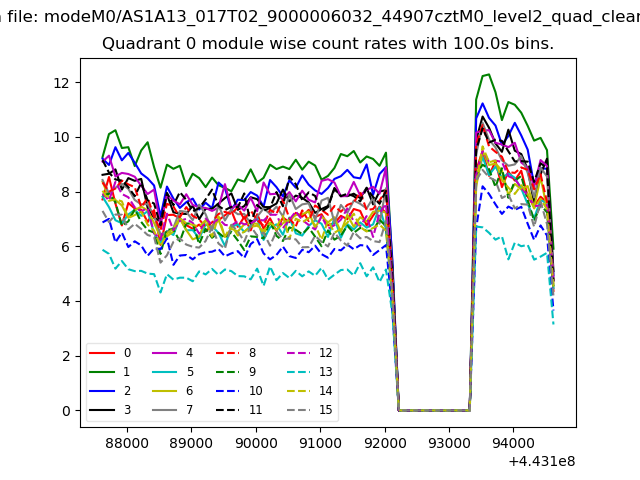 |
 |
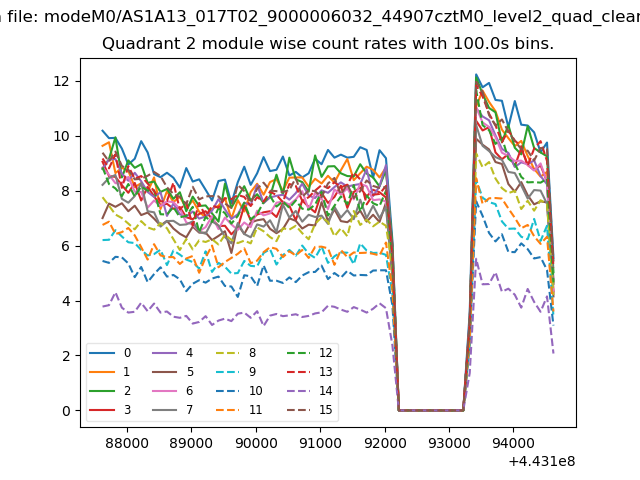
| Module-wise count rates for Quadrant B Data is divided into 100 sec bins |
 |
 |
| Module-wise count rates for Quadrant C Data is divided into 100 sec bins |
 |
 |
| Module-wise count rates for Quadrant D Data is divided into 100 sec bins |
 |
 |
| Parameter | Plot |
|---|---|
| CZT HV Monitor | 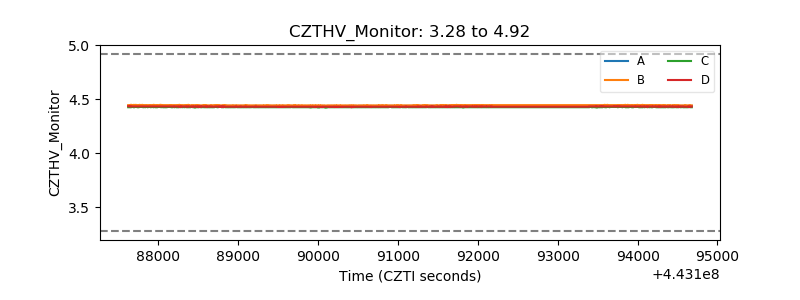 |
| D_VDD | 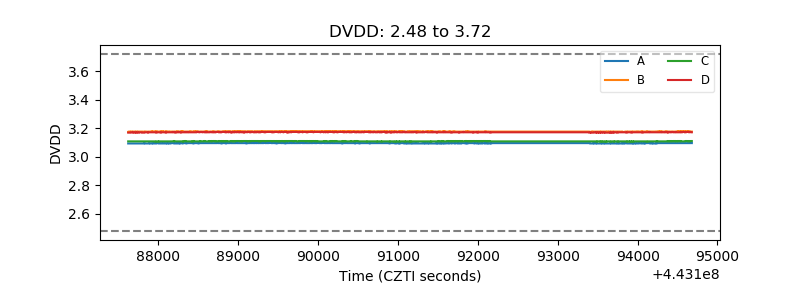 |
| Temperature 1 | 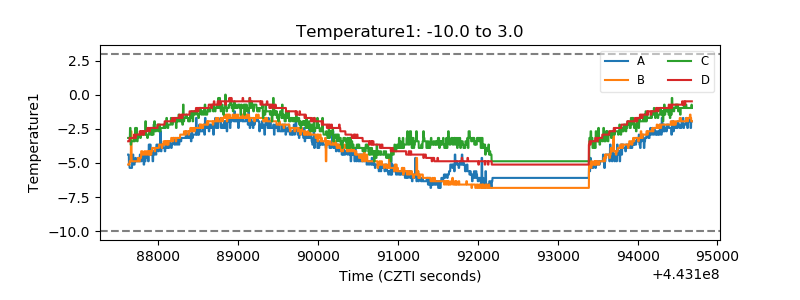 |
| Veto HV Monitor |  |
| Veto LLD | 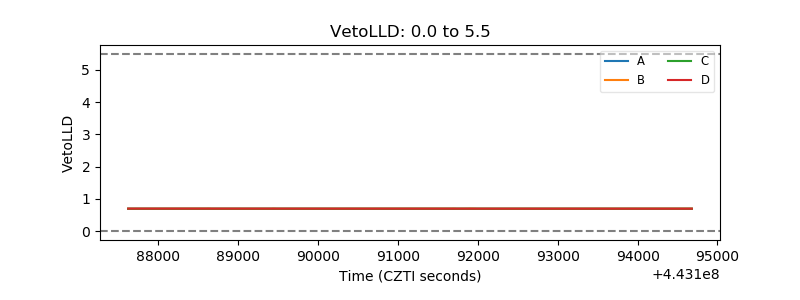 |
| Alpha Counter | 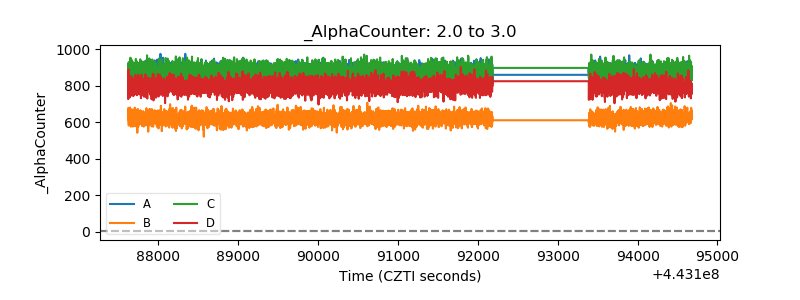 |
| _CPM_Rate | 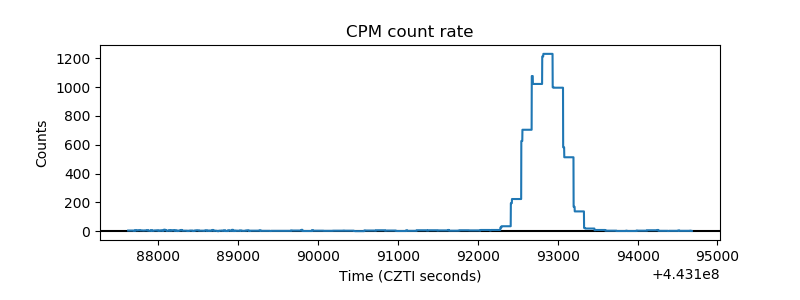 |
| CZT Counter | 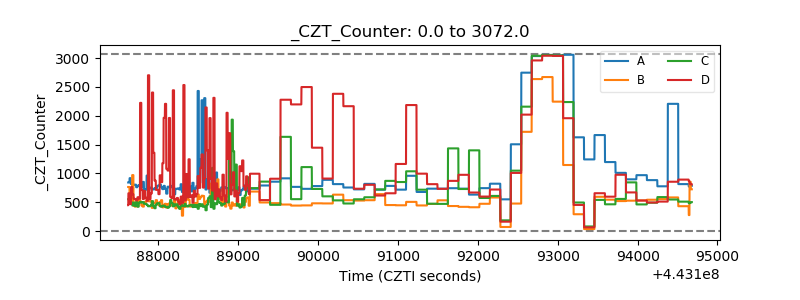 |
| +2.5 Volts monitor | 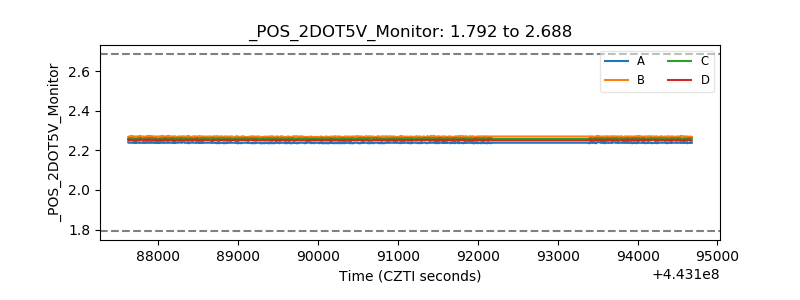 |
| +5 Volts monitor | 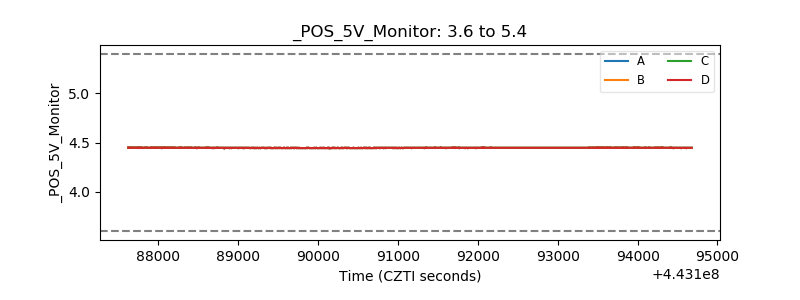 |
| _ROLL_ROT | 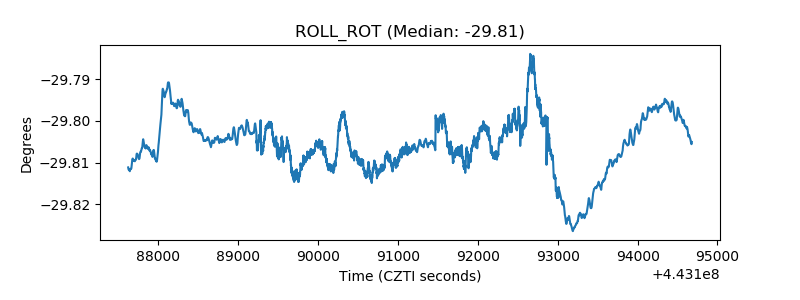 |
| _Roll_DEC | 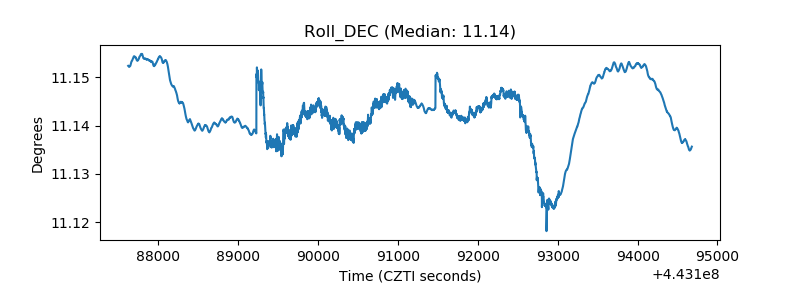 |
| _Roll_RA | 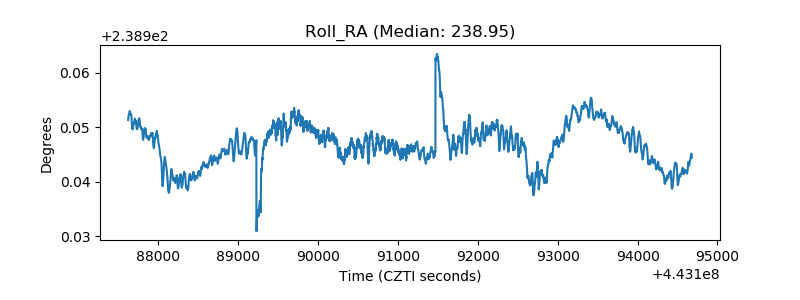 |
| Veto Counter | 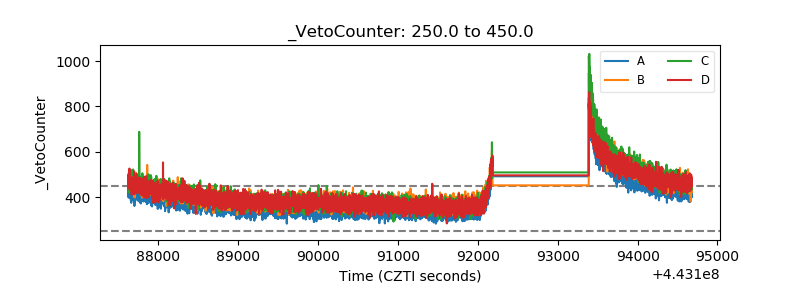 |