| Param | Original file | Final file |
|---|---|---|
| Filename | modeM0/AS1A13_017T02_9000006032_44908cztM0_level2.fits | modeM0/AS1A13_017T02_9000006032_44908cztM0_level2_quad_clean.evt |
| Size (bytes) | 474,816,960 | 111,790,080 |
| Size | 452.8 MB | 106.6 MB |
| Events in quadrant A | 5,218,076 | 755,365 |
| Events in quadrant B | 3,438,313 | 781,868 |
| Events in quadrant C | 3,117,002 | 760,281 |
| Events in quadrant D | 5,327,571 | 660,055 |
| Mode SS | |||
|---|---|---|---|
| Quadrant | BADHDUFLAG | Total packets | Discarded packets |
| A | 0 | 124 | 0 |
| B | 0 | 124 | 0 |
| C | 0 | 124 | 0 |
| D | 0 | 124 | 0 |
| Mode M0 | |||
|---|---|---|---|
| Quadrant | BADHDUFLAG | Total packets | Discarded packets |
| A | 0 | 19668 | 1 |
| B | 0 | 13975 | 1 |
| C | 0 | 13113 | 1 |
| D | 0 | 20085 | 1 |
| Mode M9 | |||
|---|---|---|---|
| Quadrant | BADHDUFLAG | Total packets | Discarded packets |
| A | 0 | 12 | 0 |
| B | 0 | 12 | 0 |
| C | 0 | 12 | 0 |
| D | 0 | 12 | 0 |
| Quadrant | Total seconds | Saturated seconds | Saturation percentage |
|---|---|---|---|
| A | 6126 | 206 | 3.362716% |
| B | 6127 | 170 | 2.774604% |
| C | 6127 | 86 | 1.403623% |
| D | 6127 | 472 | 7.703607% |
Noise dominated data is calculated using 1-second bins in cleaned event files. If a bin has >2000 counts, and if more than 50% of those come from <1% of pixels, then it is considered to be noise-dominated and hence unusable.
| Quadrant | # 1 sec bins | Bins with >0 counts | Bins with >2000 counts | High rate bins dominated by noise | Noise dominated (total time) | Noise dominated (detector-on time) | Marked lightcurve |
|---|---|---|---|---|---|---|---|
| A | 7316 | 6127 | 28 | 28 | 0.38% | 0.46% | 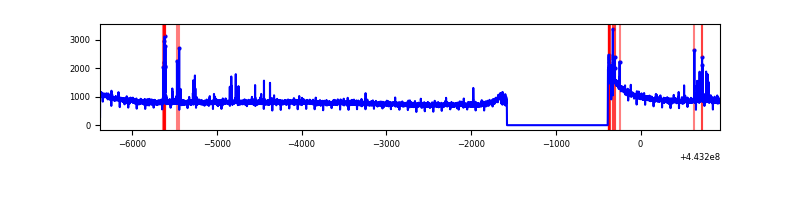 |
| B | 7317 | 6128 | 30 | 30 | 0.41% | 0.49% | 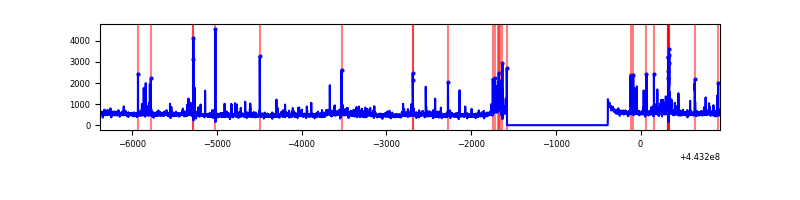 |
| C | 7317 | 6128 | 3 | 3 | 0.04% | 0.05% | 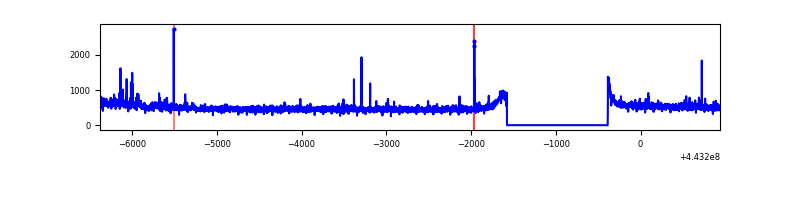 |
| D | 7317 | 6128 | 287 | 287 | 3.92% | 4.68% | 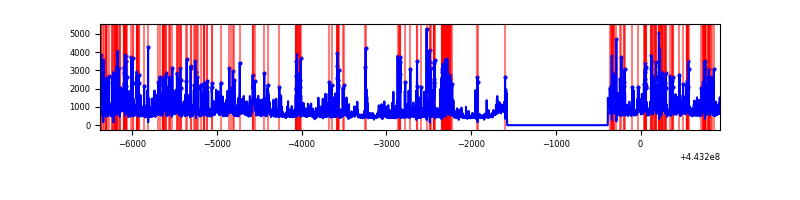 |
Top three noisy pixels from each quadrant. If the there are fewer than three noisy pixels in the level2.evt file, extra rows are filled as -1
| Pixel properties | Quadrant properties | ||||||
|---|---|---|---|---|---|---|---|
| Quadrant | DetID | PixID | Counts | Sigma | Mean | Median | Sigma |
| A | 10 | 83 | 2137520 | 13516.62 | 765 | 751 | 158.1 |
| A | 13 | 248 | 103755 | 651.58 | 765 | 751 | 158.1 |
| A | 7 | 3 | 9994 | 58.47 | 765 | 751 | 158.1 |
| B | 5 | 255 | 80824 | 542.21 | 759 | 737 | 147.7 |
| B | 5 | 172 | 58844 | 393.4 | 759 | 737 | 147.7 |
| B | 0 | 168 | 58669 | 392.21 | 759 | 737 | 147.7 |
| C | 9 | 54 | 64422 | 358.69 | 761 | 768 | 177.5 |
| C | 3 | 233 | 20689 | 112.25 | 761 | 768 | 177.5 |
| C | 12 | 2 | 17072 | 91.87 | 761 | 768 | 177.5 |
| D | 1 | 52 | 734732 | 3954.16 | 742 | 719 | 185.6 |
| D | 13 | 249 | 649996 | 3497.68 | 742 | 719 | 185.6 |
| D | 2 | 249 | 258580 | 1389.11 | 742 | 719 | 185.6 |
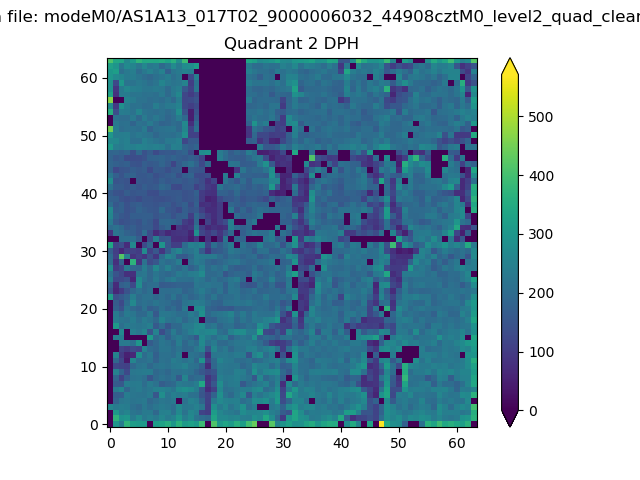
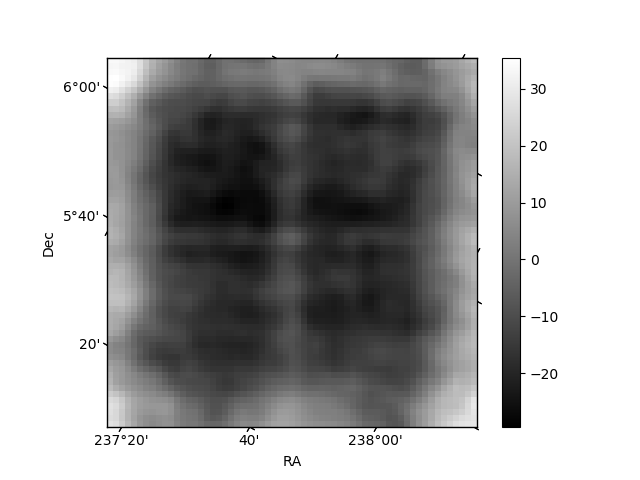
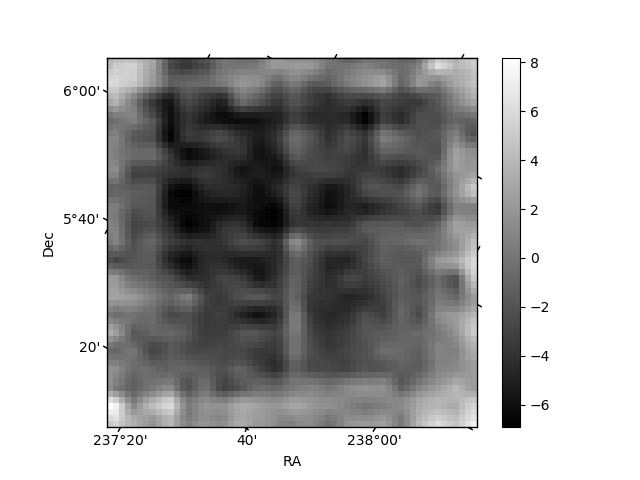
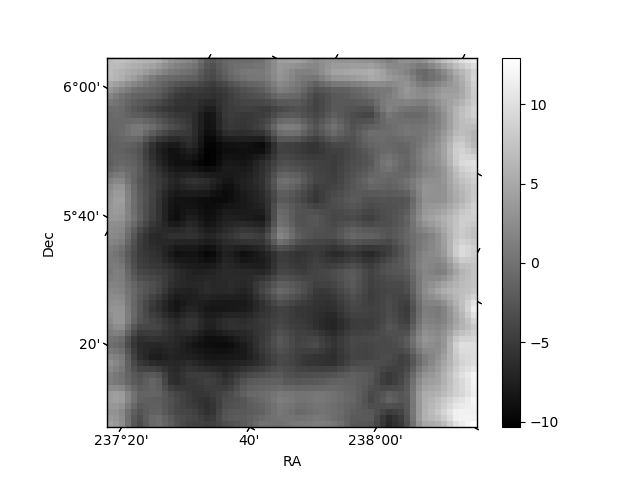
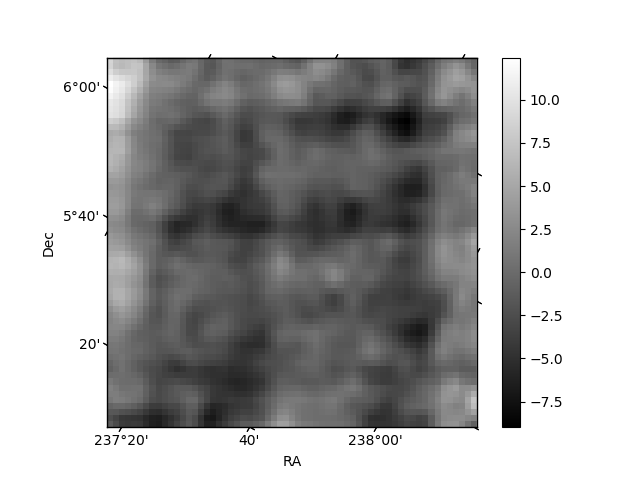
Histogram calculated using DETX and DETY for each event in the final _common_clean file
| Quadrant A | 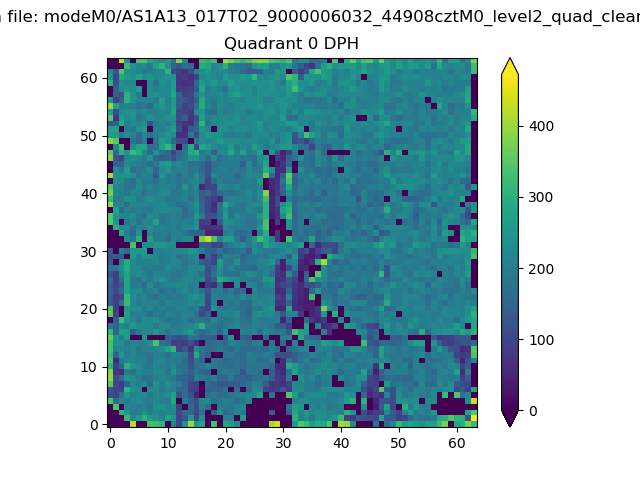 |
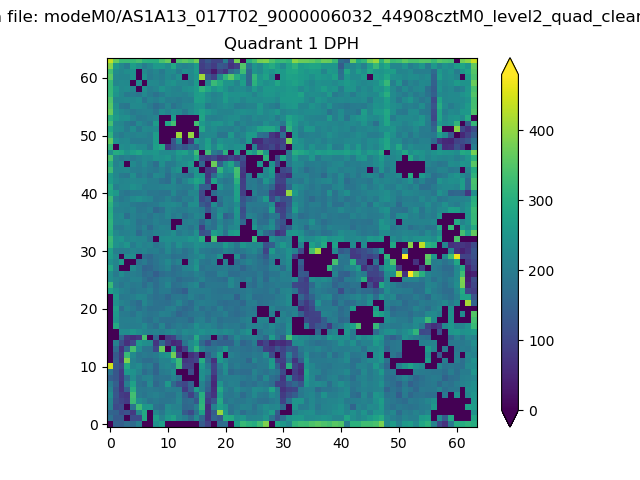 |
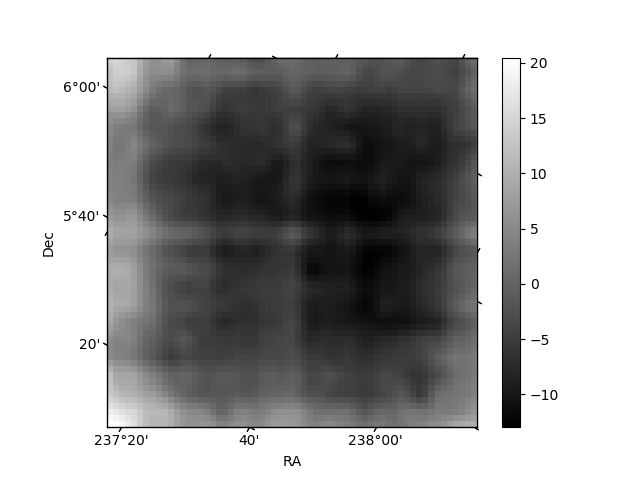
Quadrant B |
|---|---|---|---|
| Quadrant D | 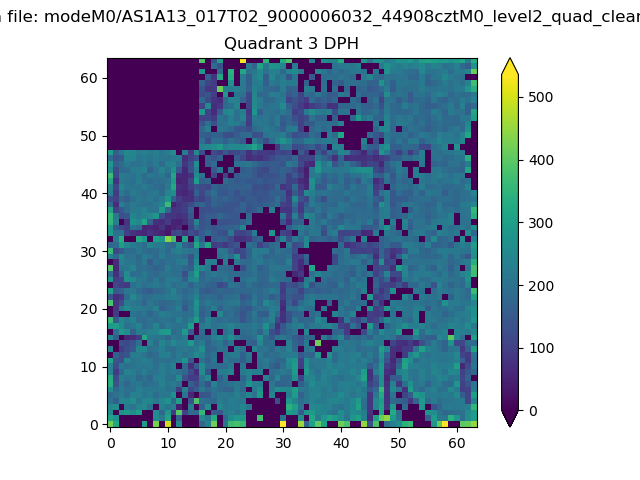 |
 |
Quadrant C |
| Plot type | Count rate plots | Images |
|---|---|---|
| Comparison with Poisson distribution Blue bars denote a histogram of data divided into 1 sec bins. Red curve is a Poisson curve with rate = median count rate of data. |
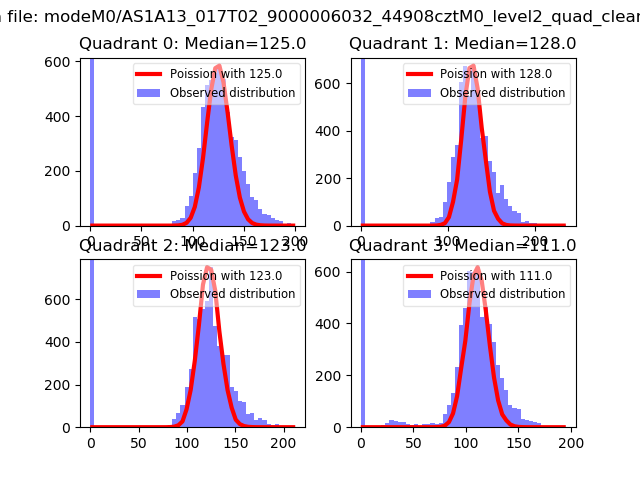 |
 |
| Quadrant-wise count rates Data is divided into 100 sec bins |
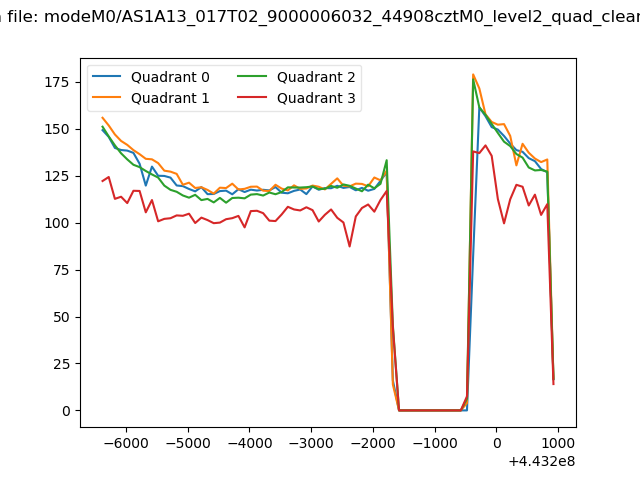 |
|
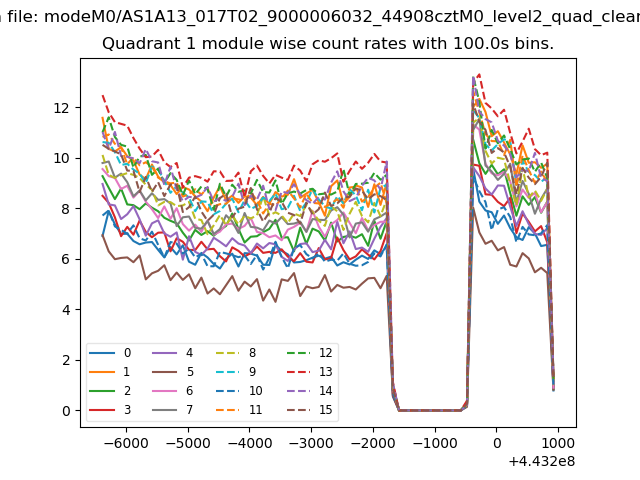
| Module-wise count rates for Quadrant A Data is divided into 100 sec bins |
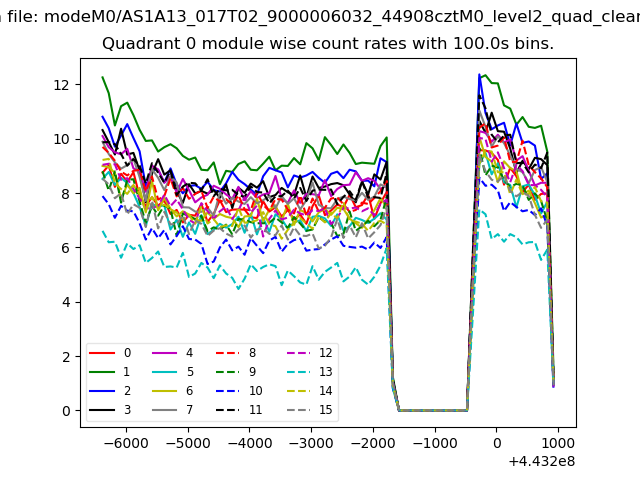 |
 |
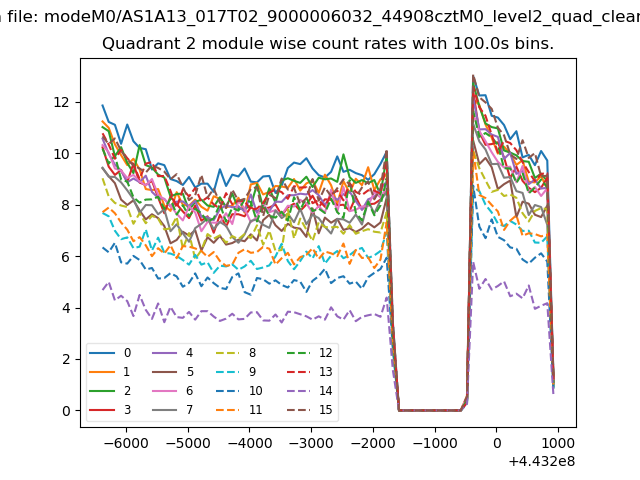
| Module-wise count rates for Quadrant B Data is divided into 100 sec bins |
 |
 |
| Module-wise count rates for Quadrant C Data is divided into 100 sec bins |
 |
 |
| Module-wise count rates for Quadrant D Data is divided into 100 sec bins |
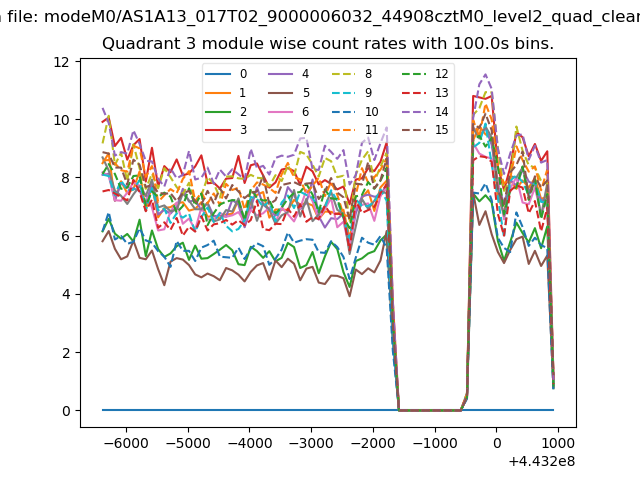 |
 |
| Parameter | Plot |
|---|---|
| CZT HV Monitor | 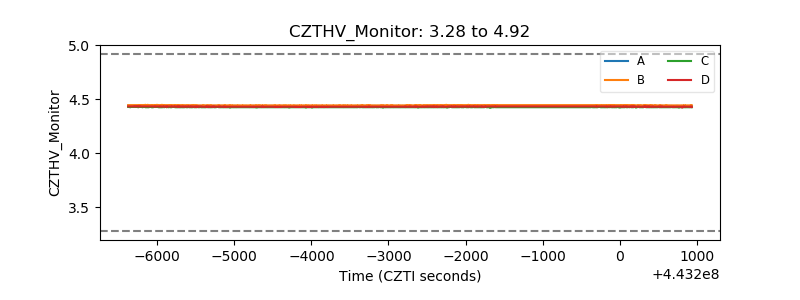 |
| D_VDD | 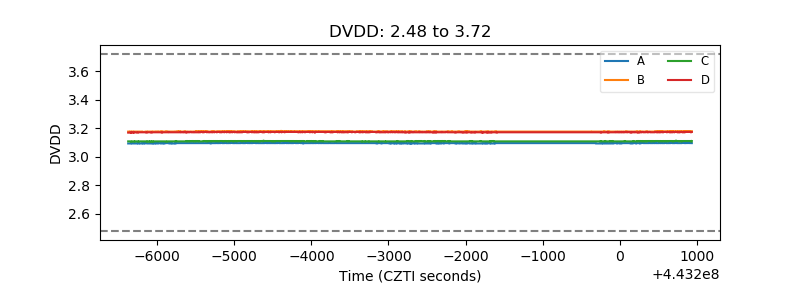 |
| Temperature 1 | 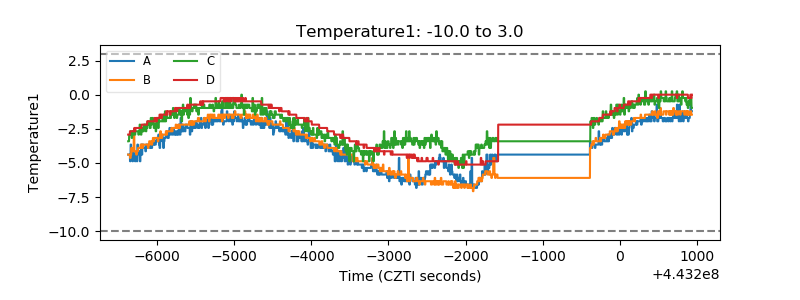 |
| Veto HV Monitor | 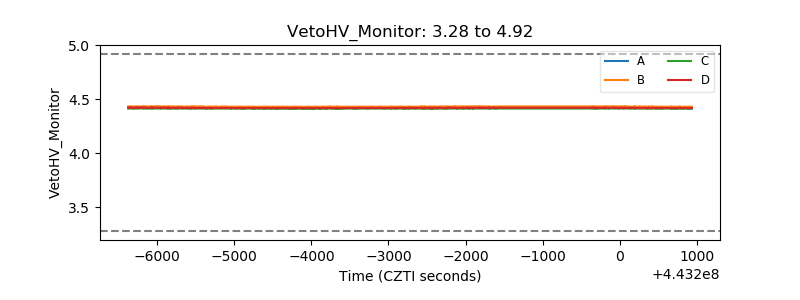 |
| Veto LLD | 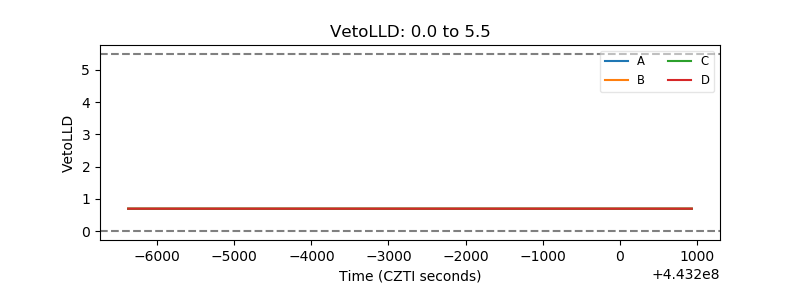 |
| Alpha Counter | 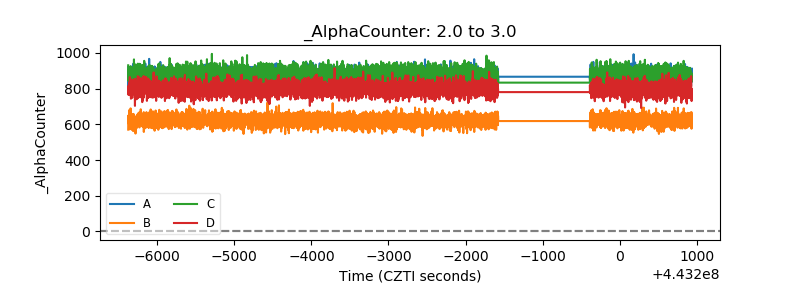 |
| _CPM_Rate | 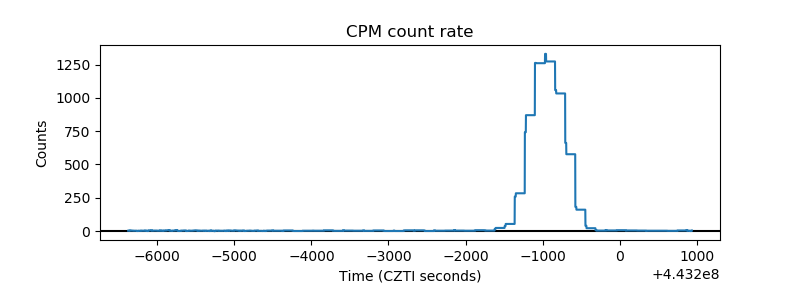 |
| CZT Counter |  |
| +2.5 Volts monitor | 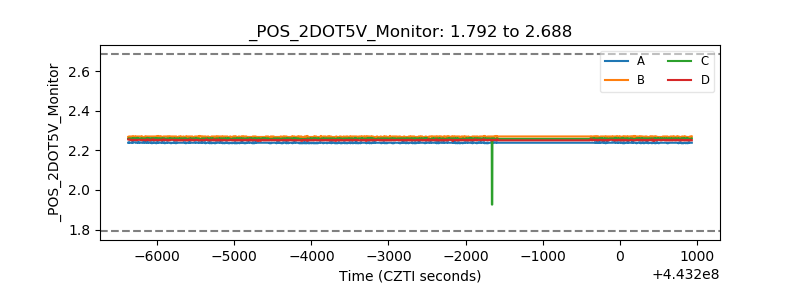 |
| +5 Volts monitor | 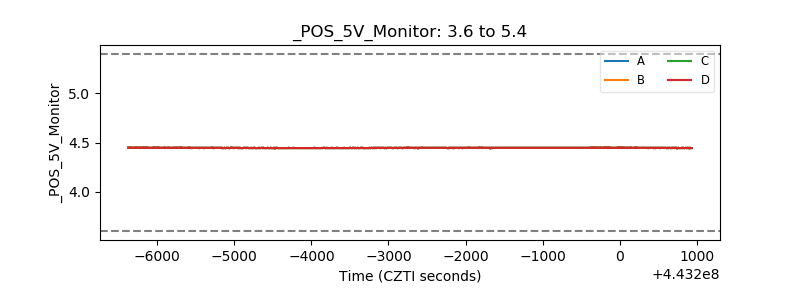 |
| _ROLL_ROT | 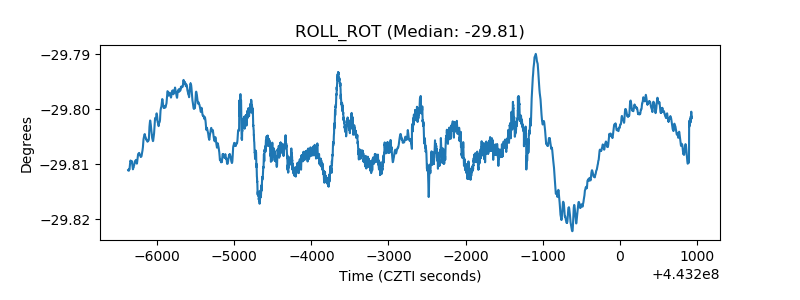 |
| _Roll_DEC | 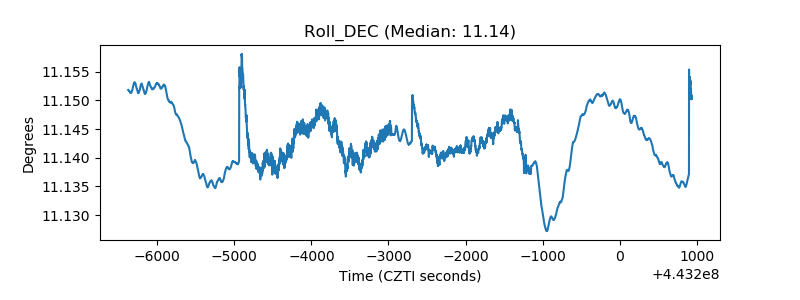 |
| _Roll_RA | 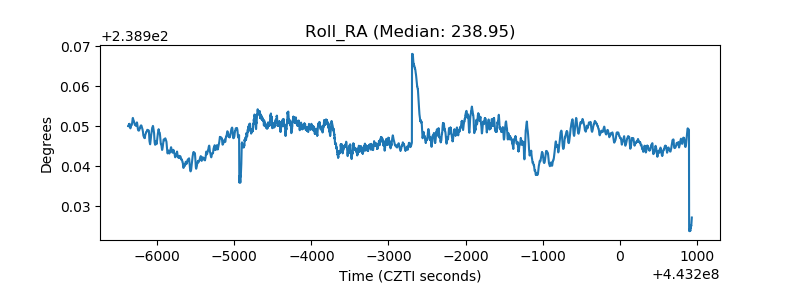 |
| Veto Counter | 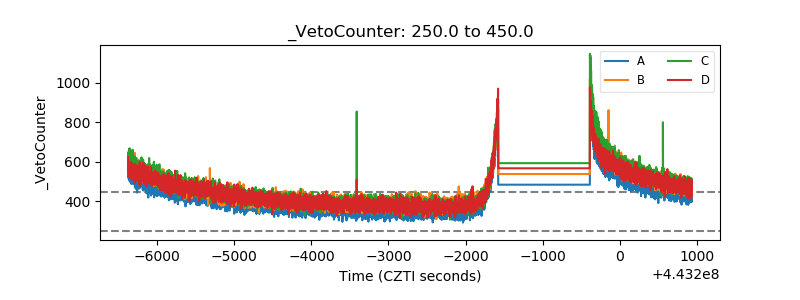 |