| Param | Original file | Final file |
|---|---|---|
| Filename | modeM0/AS1A13_017T02_9000006032_44909cztM0_level2.fits | modeM0/AS1A13_017T02_9000006032_44909cztM0_level2_quad_clean.evt |
| Size (bytes) | 553,242,240 | 117,146,880 |
| Size | 527.6 MB | 111.7 MB |
| Events in quadrant A | 6,025,004 | 787,663 |
| Events in quadrant B | 3,836,248 | 829,259 |
| Events in quadrant C | 3,321,525 | 813,061 |
| Events in quadrant D | 6,795,948 | 666,587 |
| Mode SS | |||
|---|---|---|---|
| Quadrant | BADHDUFLAG | Total packets | Discarded packets |
| A | 0 | 132 | 0 |
| B | 0 | 132 | 0 |
| C | 0 | 132 | 0 |
| D | 0 | 132 | 0 |
| Mode M0 | |||
|---|---|---|---|
| Quadrant | BADHDUFLAG | Total packets | Discarded packets |
| A | 0 | 22242 | 1 |
| B | 0 | 15538 | 1 |
| C | 0 | 13841 | 1 |
| D | 0 | 24744 | 1 |
| Mode M9 | |||
|---|---|---|---|
| Quadrant | BADHDUFLAG | Total packets | Discarded packets |
| A | 0 | 12 | 0 |
| B | 0 | 12 | 0 |
| C | 0 | 12 | 0 |
| D | 0 | 12 | 0 |
| Quadrant | Total seconds | Saturated seconds | Saturation percentage |
|---|---|---|---|
| A | 6459 | 389 | 6.022604% |
| B | 6460 | 161 | 2.492260% |
| C | 6460 | 80 | 1.238390% |
| D | 6460 | 842 | 13.034056% |
Noise dominated data is calculated using 1-second bins in cleaned event files. If a bin has >2000 counts, and if more than 50% of those come from <1% of pixels, then it is considered to be noise-dominated and hence unusable.
| Quadrant | # 1 sec bins | Bins with >0 counts | Bins with >2000 counts | High rate bins dominated by noise | Noise dominated (total time) | Noise dominated (detector-on time) | Marked lightcurve |
|---|---|---|---|---|---|---|---|
| A | 7679 | 6460 | 128 | 128 | 1.67% | 1.98% | 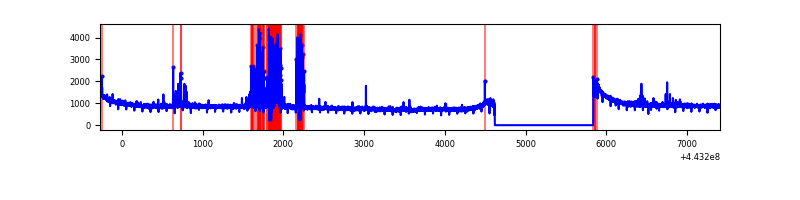 |
| B | 7680 | 6461 | 41 | 41 | 0.53% | 0.63% | 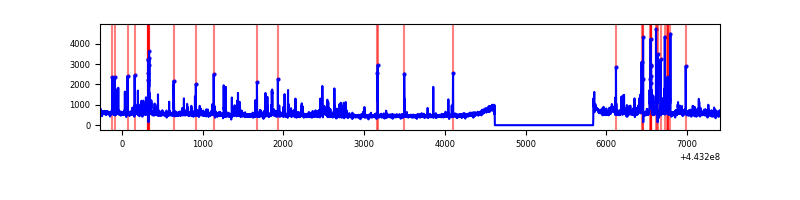 |
| C | 7680 | 6461 | 12 | 12 | 0.16% | 0.19% | 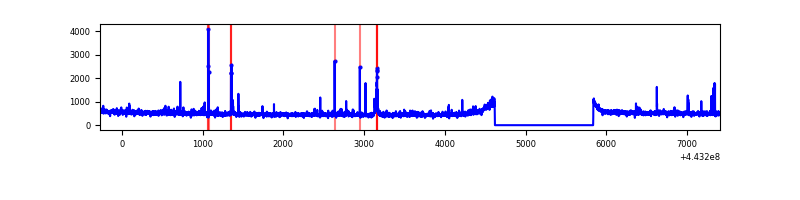 |
| D | 7680 | 6461 | 575 | 575 | 7.49% | 8.90% | 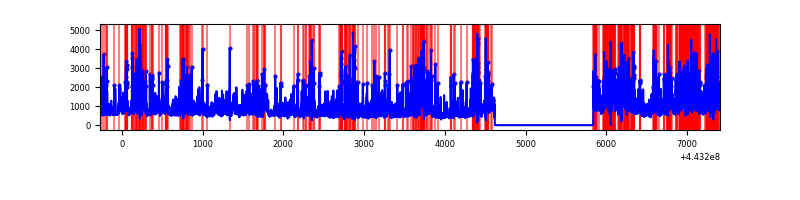 |
Top three noisy pixels from each quadrant. If the there are fewer than three noisy pixels in the level2.evt file, extra rows are filled as -1
| Pixel properties | Quadrant properties | ||||||
|---|---|---|---|---|---|---|---|
| Quadrant | DetID | PixID | Counts | Sigma | Mean | Median | Sigma |
| A | 10 | 83 | 2378259 | 14252.79 | 805 | 790 | 166.8 |
| A | 13 | 248 | 517899 | 3100.04 | 805 | 790 | 166.8 |
| A | 0 | 243 | 10782 | 59.9 | 805 | 790 | 166.8 |
| B | 15 | 36 | 107270 | 681.25 | 811 | 789 | 156.3 |
| B | 3 | 112 | 84542 | 535.84 | 811 | 789 | 156.3 |
| B | 0 | 183 | 70414 | 445.45 | 811 | 789 | 156.3 |
| C | 14 | 254 | 70742 | 370.32 | 810 | 817 | 188.8 |
| C | 15 | 208 | 25736 | 131.97 | 810 | 817 | 188.8 |
| C | 5 | 250 | 17401 | 87.83 | 810 | 817 | 188.8 |
| D | 1 | 52 | 1591013 | 8244.17 | 771 | 750 | 192.9 |
| D | 12 | 233 | 598415 | 3098.39 | 771 | 750 | 192.9 |
| D | 13 | 249 | 526677 | 2726.49 | 771 | 750 | 192.9 |
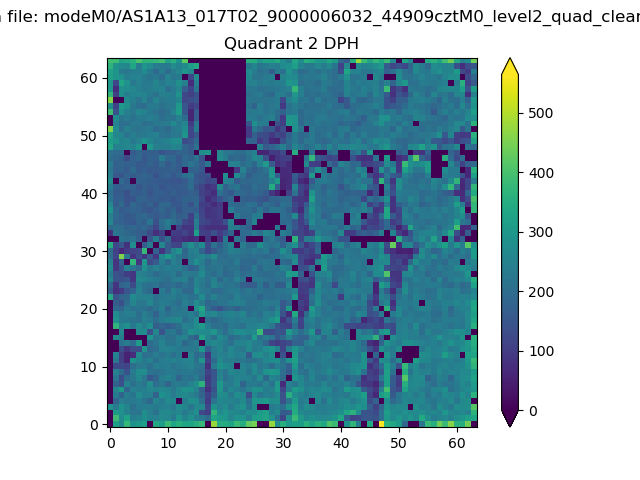
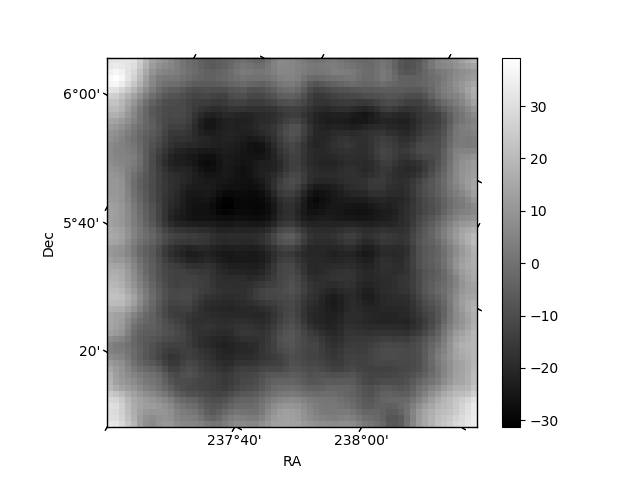
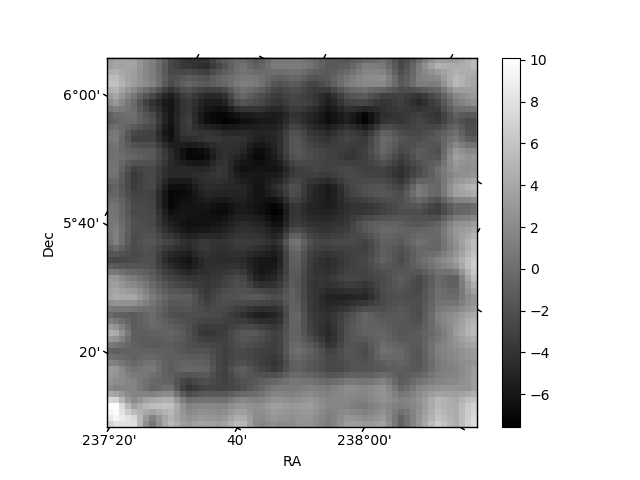
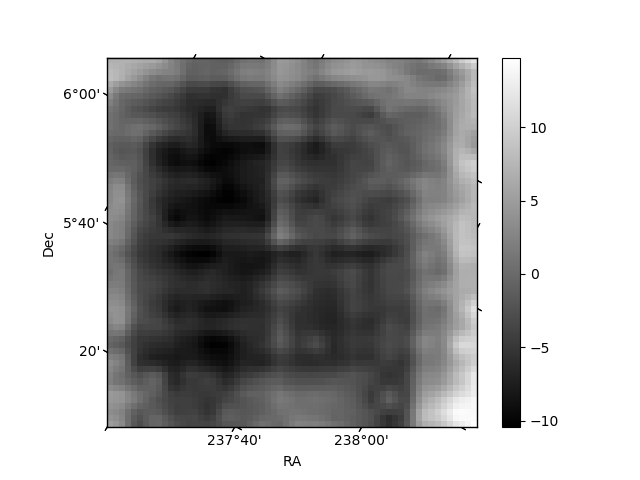
Histogram calculated using DETX and DETY for each event in the final _common_clean file
| Quadrant A | 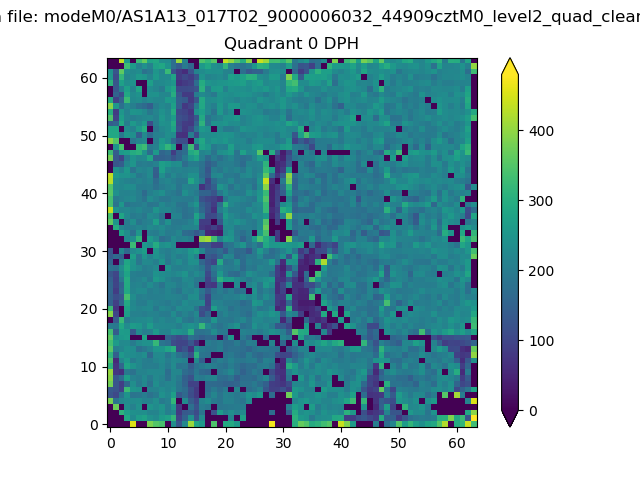 |
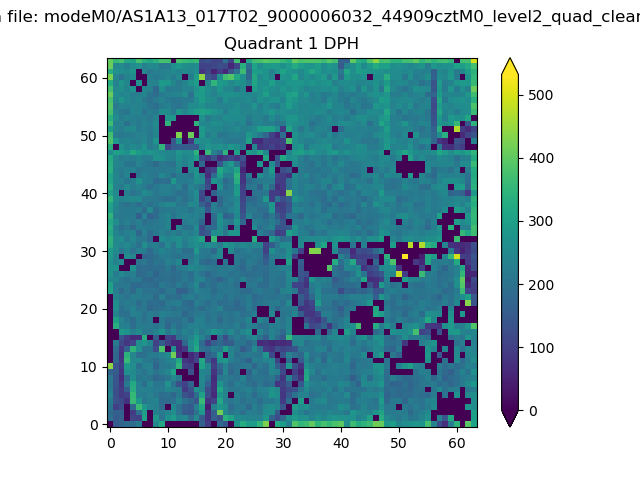 |
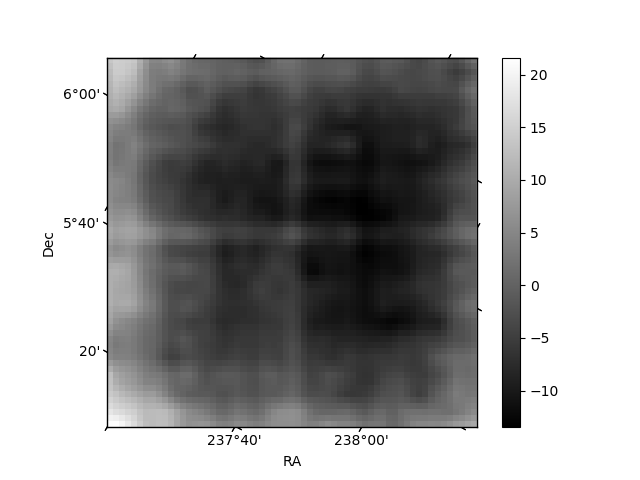
Quadrant B |
|---|---|---|---|
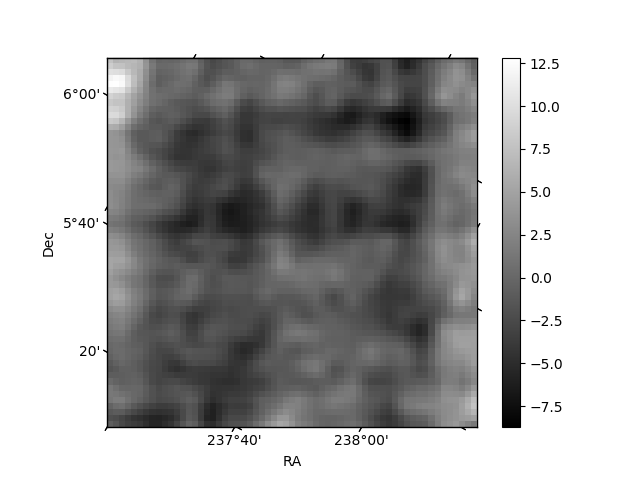
| Quadrant D | 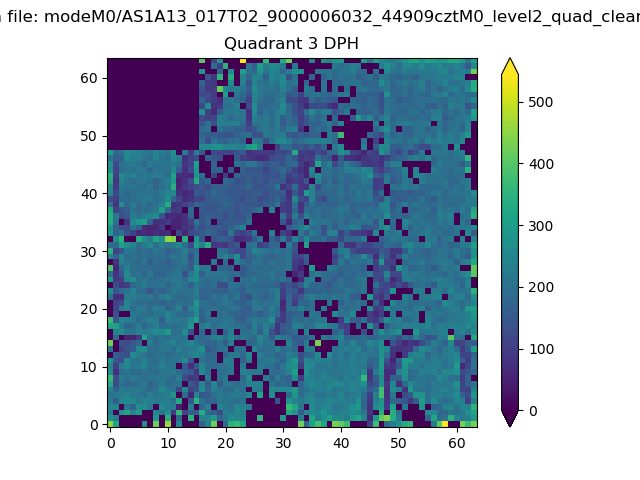 |
 |
Quadrant C |
| Plot type | Count rate plots | Images |
|---|---|---|
| Comparison with Poisson distribution Blue bars denote a histogram of data divided into 1 sec bins. Red curve is a Poisson curve with rate = median count rate of data. |
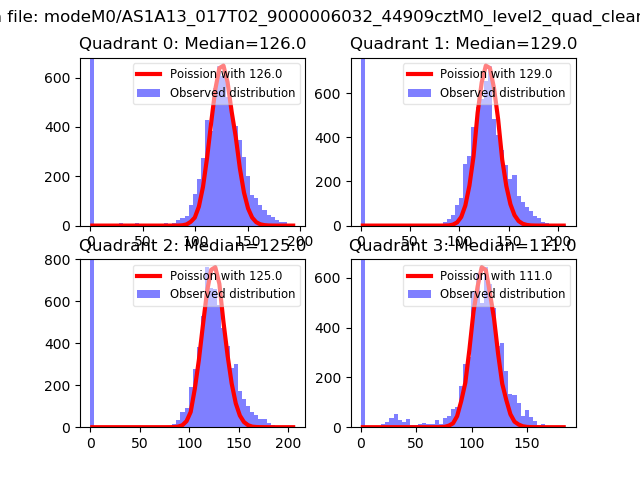 |
 |
| Quadrant-wise count rates Data is divided into 100 sec bins |
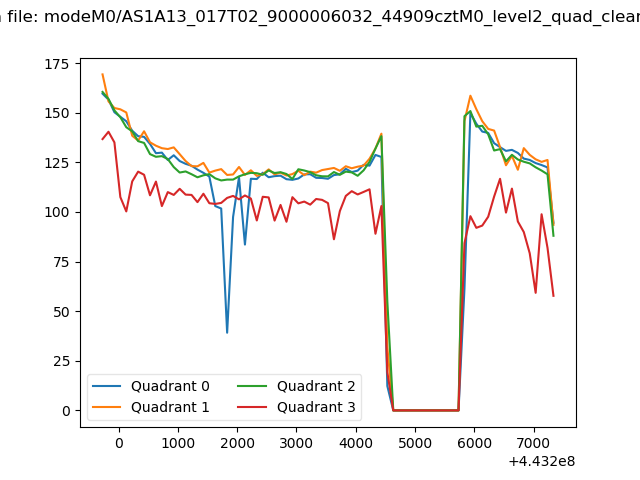 |
|
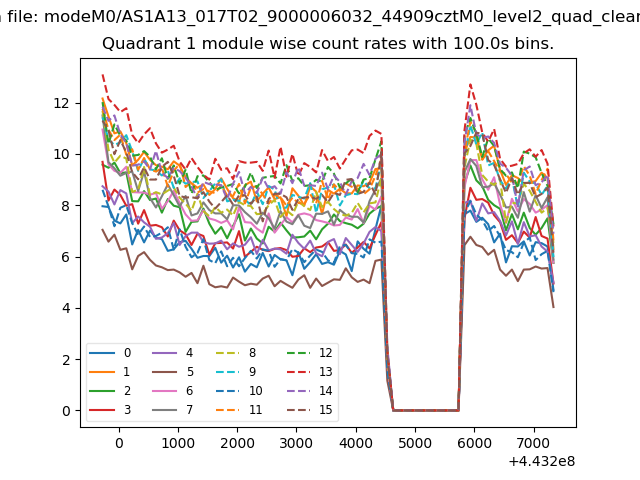
| Module-wise count rates for Quadrant A Data is divided into 100 sec bins |
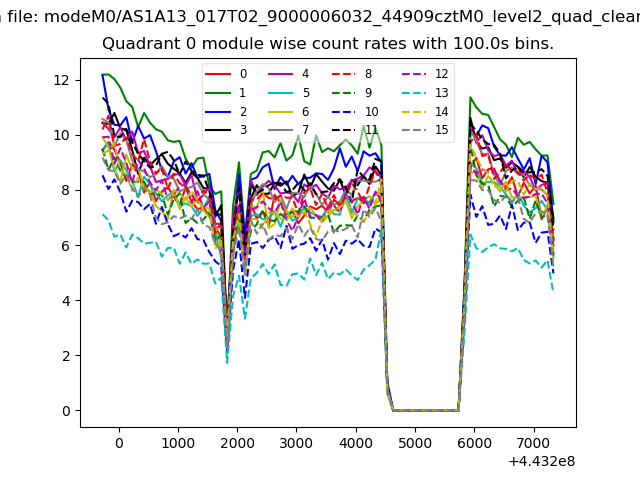 |
 |
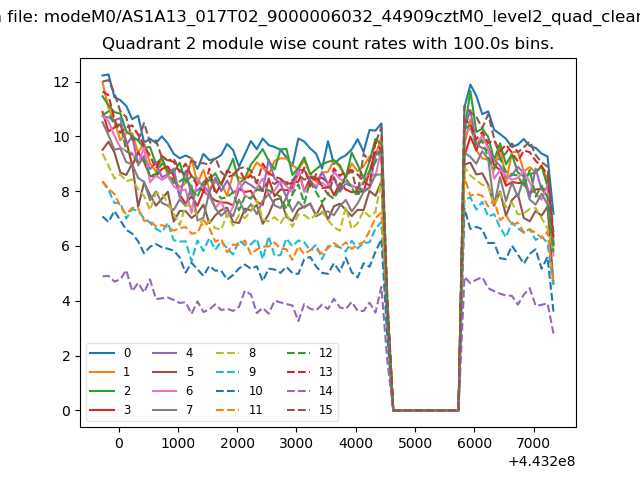
| Module-wise count rates for Quadrant B Data is divided into 100 sec bins |
 |
 |
| Module-wise count rates for Quadrant C Data is divided into 100 sec bins |
 |
 |
| Module-wise count rates for Quadrant D Data is divided into 100 sec bins |
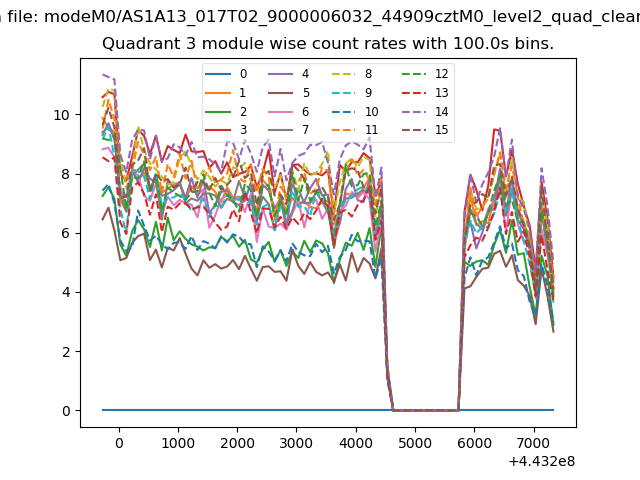 |
 |
| Parameter | Plot |
|---|---|
| CZT HV Monitor | 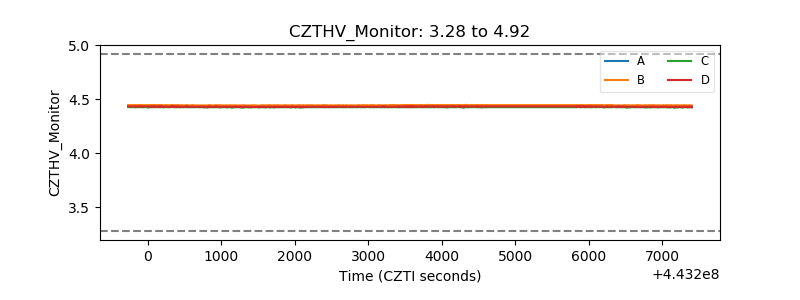 |
| D_VDD | 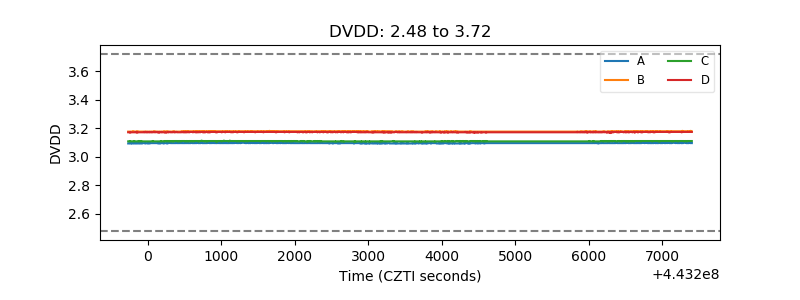 |
| Temperature 1 | 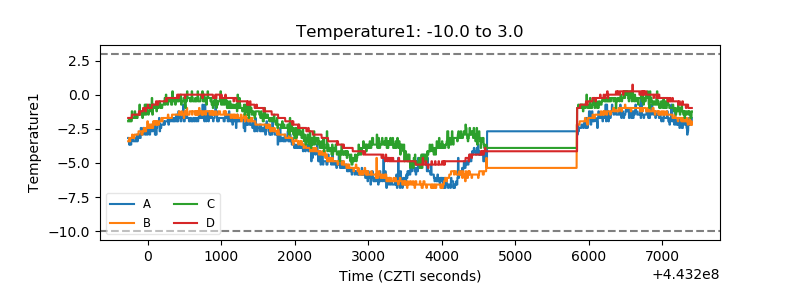 |
| Veto HV Monitor | 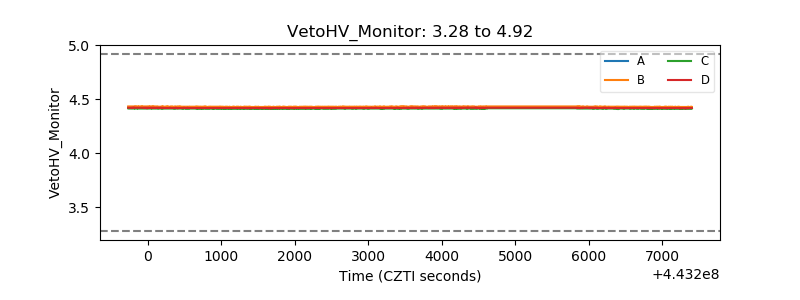 |
| Veto LLD | 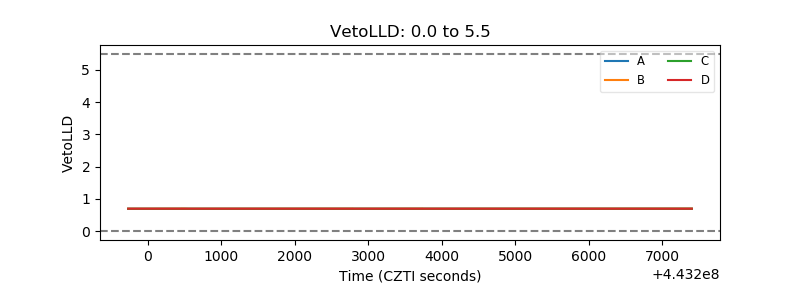 |
| Alpha Counter | 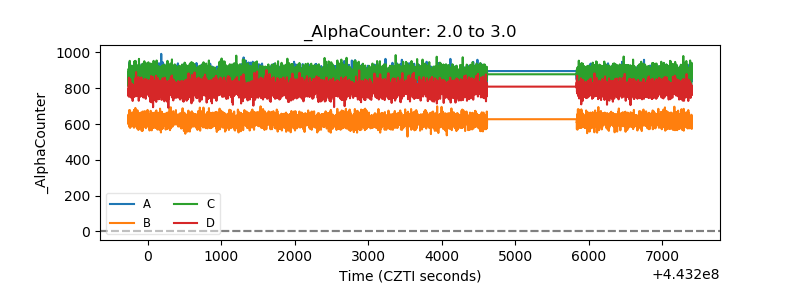 |
| _CPM_Rate | 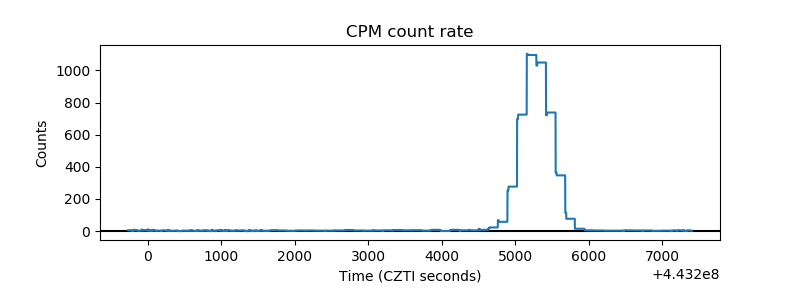 |
| CZT Counter | 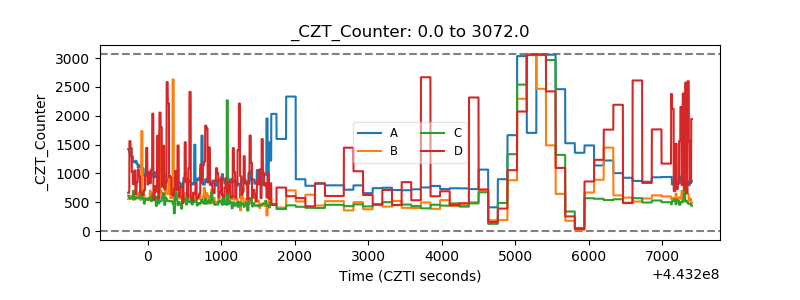 |
| +2.5 Volts monitor | 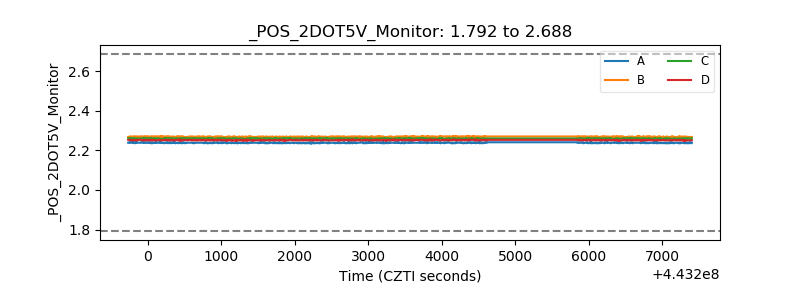 |
| +5 Volts monitor | 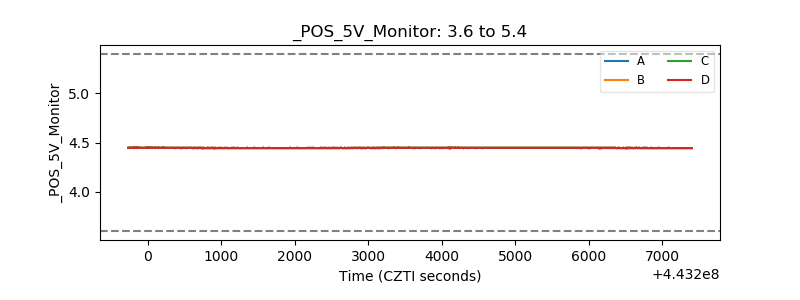 |
| _ROLL_ROT | 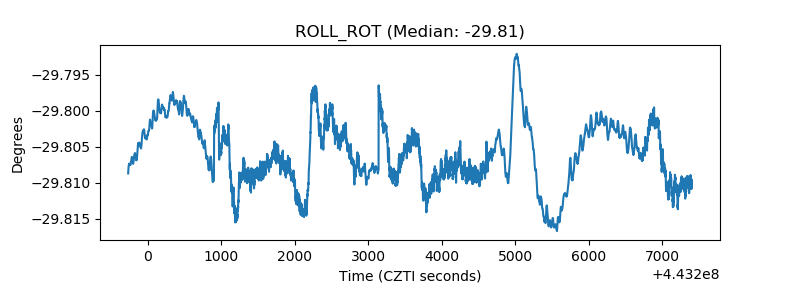 |
| _Roll_DEC | 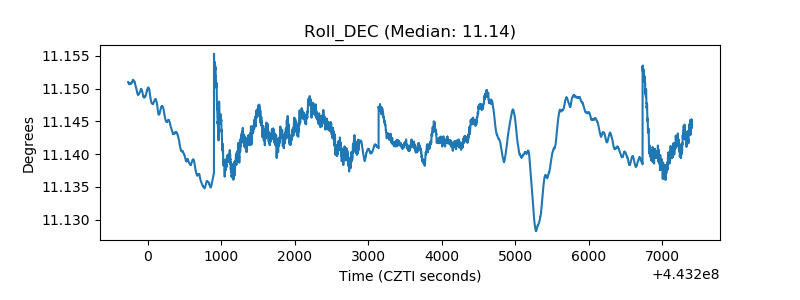 |
| _Roll_RA | 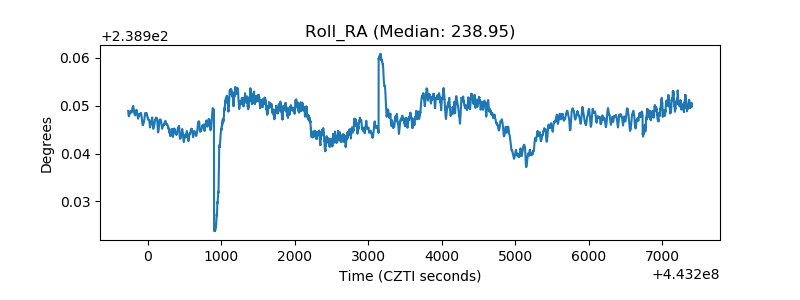 |
| Veto Counter | 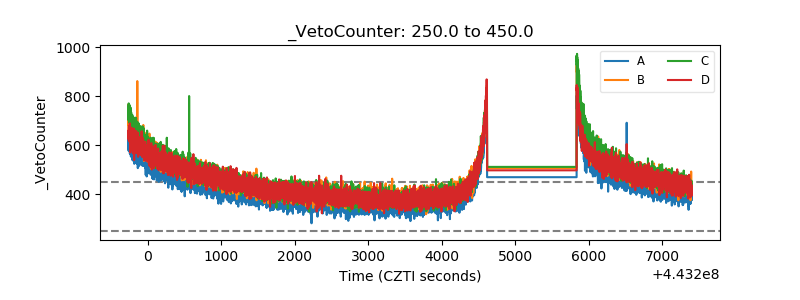 |