| Param | Original file | Final file |
|---|---|---|
| Filename | modeM0/AS1A13_017T02_9000006032_44910cztM0_level2.fits | modeM0/AS1A13_017T02_9000006032_44910cztM0_level2_quad_clean.evt |
| Size (bytes) | 565,191,360 | 117,780,480 |
| Size | 539.0 MB | 112.3 MB |
| Events in quadrant A | 6,245,302 | 789,926 |
| Events in quadrant B | 4,772,129 | 805,779 |
| Events in quadrant C | 3,429,206 | 814,487 |
| Events in quadrant D | 5,952,136 | 685,731 |
| Mode SS | |||
|---|---|---|---|
| Quadrant | BADHDUFLAG | Total packets | Discarded packets |
| A | 0 | 138 | 0 |
| B | 0 | 138 | 0 |
| C | 0 | 138 | 0 |
| D | 0 | 138 | 0 |
| Mode M0 | |||
|---|---|---|---|
| Quadrant | BADHDUFLAG | Total packets | Discarded packets |
| A | 0 | 23256 | 2 |
| B | 0 | 18736 | 2 |
| C | 0 | 14515 | 2 |
| D | 0 | 22318 | 2 |
| Mode M9 | |||
|---|---|---|---|
| Quadrant | BADHDUFLAG | Total packets | Discarded packets |
| A | 0 | 11 | 0 |
| B | 0 | 12 | 0 |
| C | 0 | 12 | 0 |
| D | 0 | 12 | 0 |
| Quadrant | Total seconds | Saturated seconds | Saturation percentage |
|---|---|---|---|
| A | 6746 | 412 | 6.107323% |
| B | 6746 | 450 | 6.670620% |
| C | 6746 | 108 | 1.600949% |
| D | 6746 | 698 | 10.346872% |
Noise dominated data is calculated using 1-second bins in cleaned event files. If a bin has >2000 counts, and if more than 50% of those come from <1% of pixels, then it is considered to be noise-dominated and hence unusable.
| Quadrant | # 1 sec bins | Bins with >0 counts | Bins with >2000 counts | High rate bins dominated by noise | Noise dominated (total time) | Noise dominated (detector-on time) | Marked lightcurve |
|---|---|---|---|---|---|---|---|
| A | 7891 | 6747 | 86 | 86 | 1.09% | 1.27% | 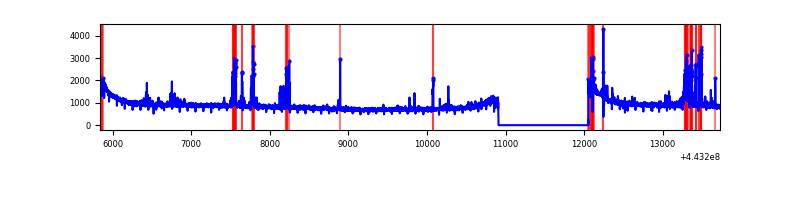 |
| B | 7891 | 6747 | 217 | 217 | 2.75% | 3.22% | 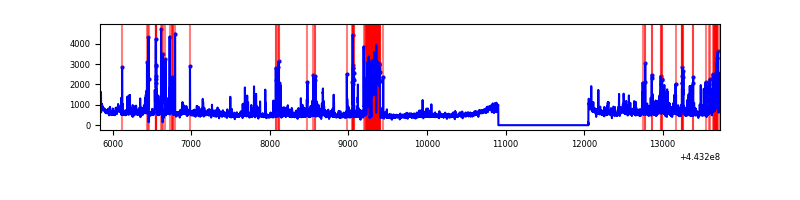 |
| C | 7891 | 6746 | 11 | 11 | 0.14% | 0.16% | 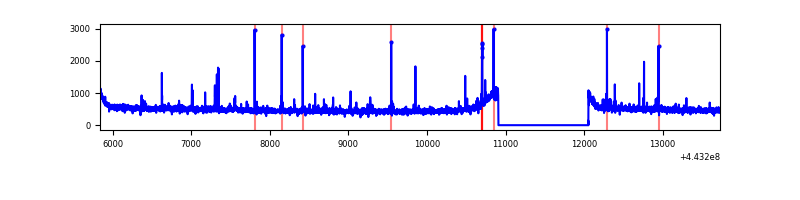 |
| D | 7891 | 6746 | 443 | 443 | 5.61% | 6.57% | 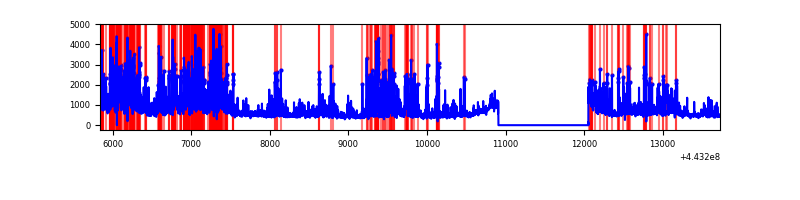 |
Top three noisy pixels from each quadrant. If the there are fewer than three noisy pixels in the level2.evt file, extra rows are filled as -1
| Pixel properties | Quadrant properties | ||||||
|---|---|---|---|---|---|---|---|
| Quadrant | DetID | PixID | Counts | Sigma | Mean | Median | Sigma |
| A | 10 | 83 | 2641167 | 15202.88 | 834 | 816 | 173.7 |
| A | 13 | 248 | 348297 | 2000.76 | 834 | 816 | 173.7 |
| A | 10 | 248 | 16391 | 89.68 | 834 | 816 | 173.7 |
| B | 4 | 171 | 834834 | 5076.9 | 830 | 806 | 164.3 |
| B | 0 | 155 | 152654 | 924.33 | 830 | 806 | 164.3 |
| B | 15 | 36 | 114324 | 691.01 | 830 | 806 | 164.3 |
| C | 15 | 208 | 64303 | 322.28 | 838 | 845 | 196.9 |
| C | 1 | 3 | 33069 | 163.65 | 838 | 845 | 196.9 |
| C | 3 | 233 | 23652 | 115.83 | 838 | 845 | 196.9 |
| D | 1 | 52 | 698472 | 3447.42 | 809 | 784 | 202.4 |
| D | 12 | 233 | 644439 | 3180.43 | 809 | 784 | 202.4 |
| D | 13 | 249 | 365165 | 1800.48 | 809 | 784 | 202.4 |
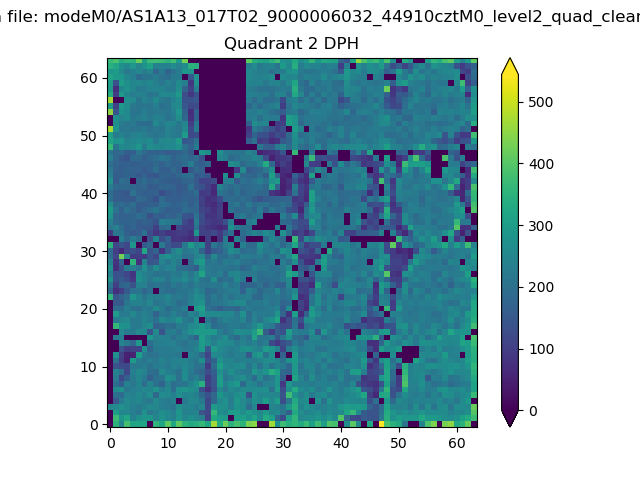
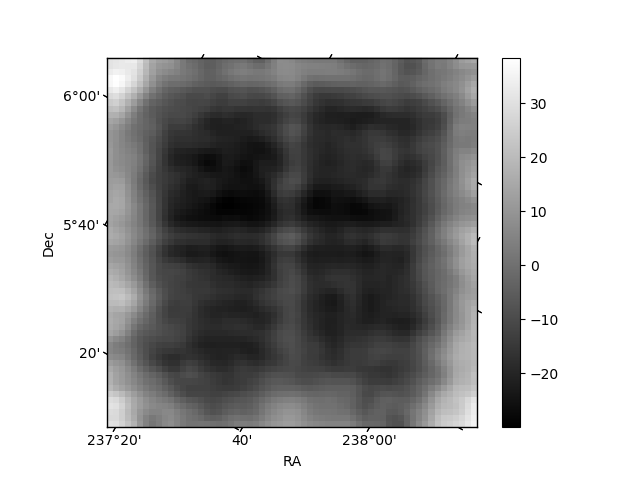
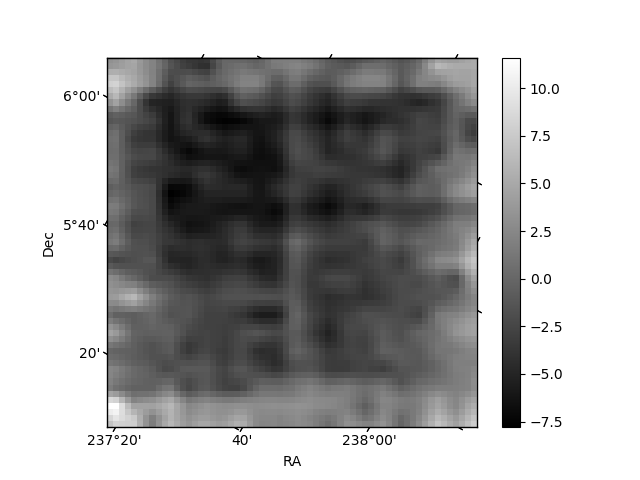
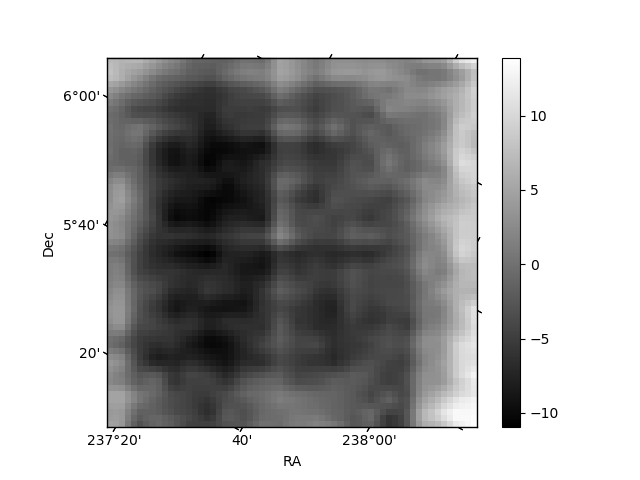
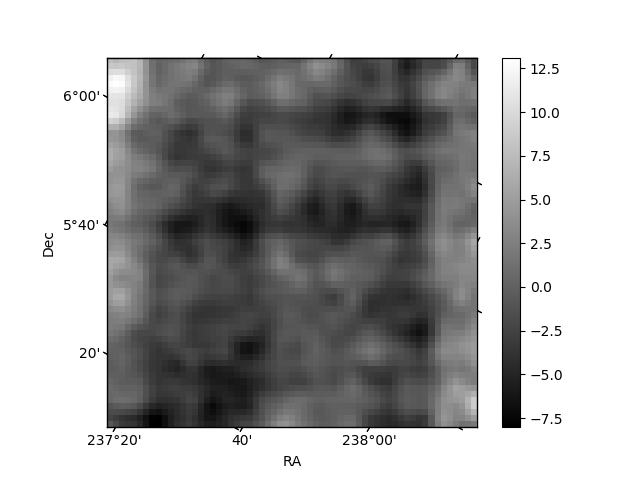
Histogram calculated using DETX and DETY for each event in the final _common_clean file
| Quadrant A | 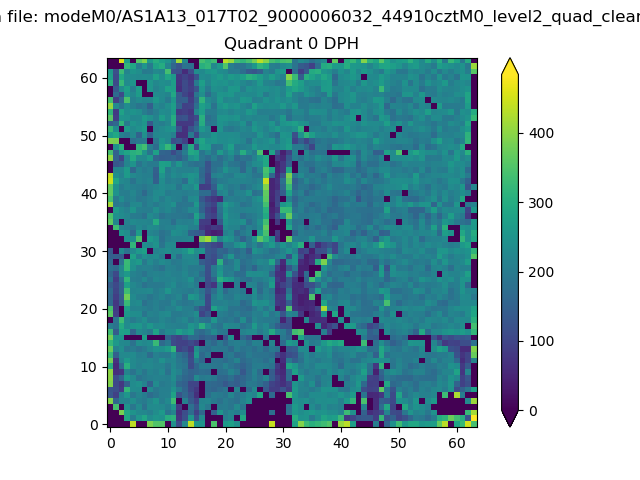 |
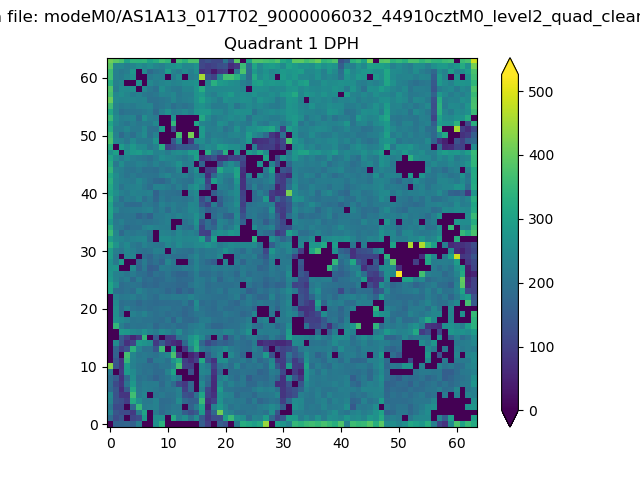 |
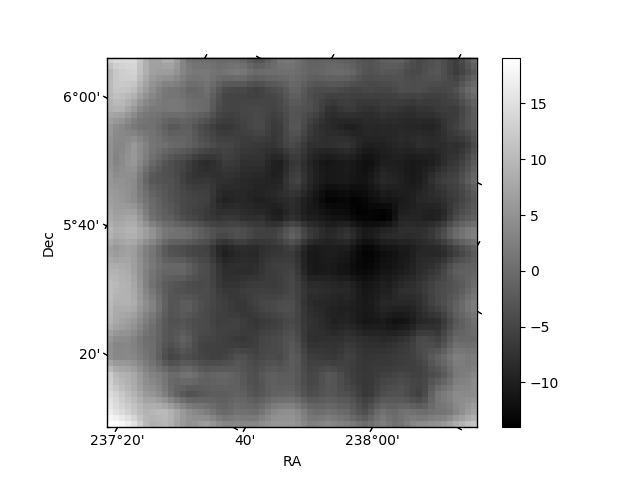
Quadrant B |
|---|---|---|---|
| Quadrant D | 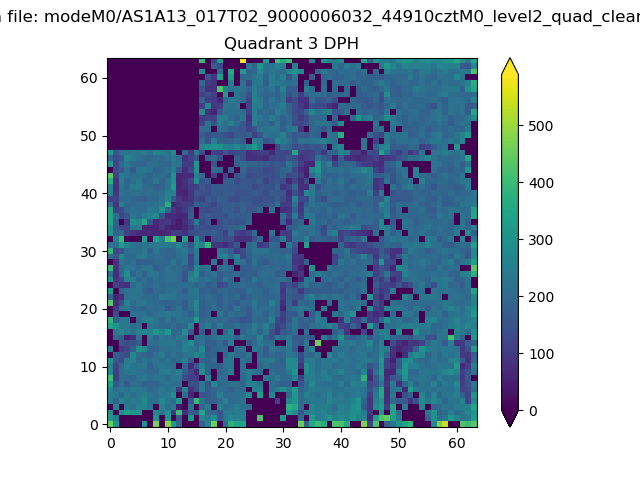 |
 |
Quadrant C |
| Plot type | Count rate plots | Images |
|---|---|---|
| Comparison with Poisson distribution Blue bars denote a histogram of data divided into 1 sec bins. Red curve is a Poisson curve with rate = median count rate of data. |
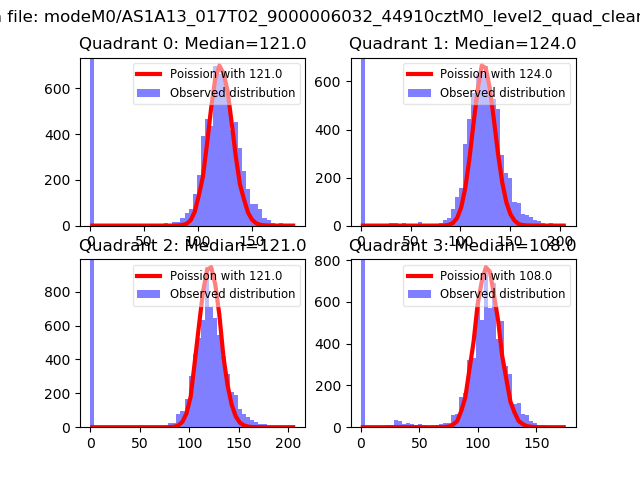 |
 |
| Quadrant-wise count rates Data is divided into 100 sec bins |
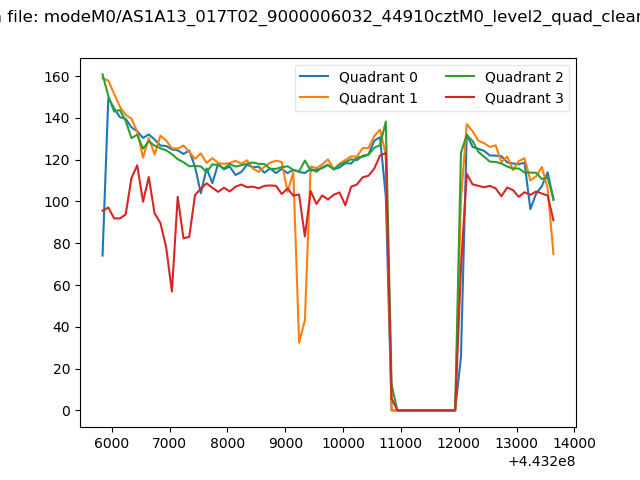 |
|
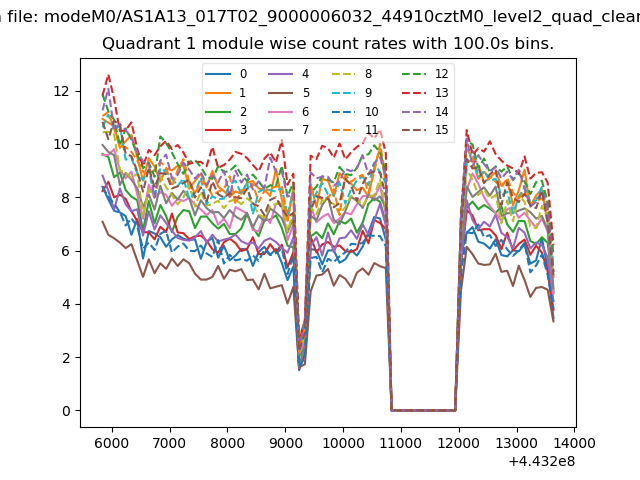
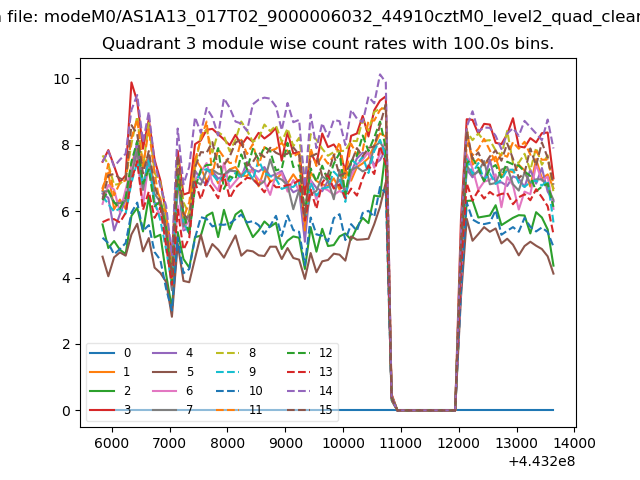
| Module-wise count rates for Quadrant A Data is divided into 100 sec bins |
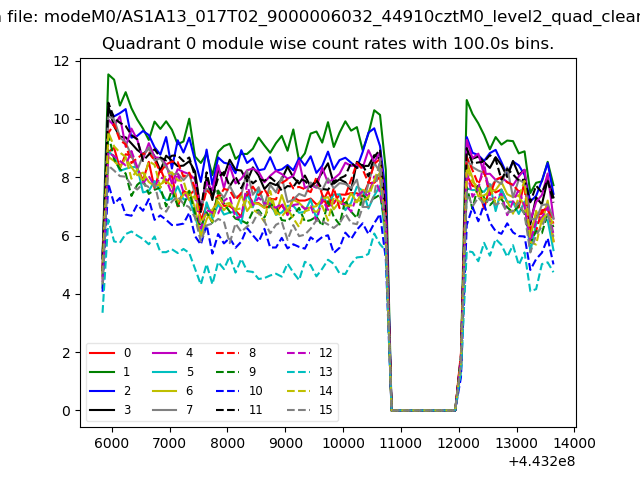 |
 |
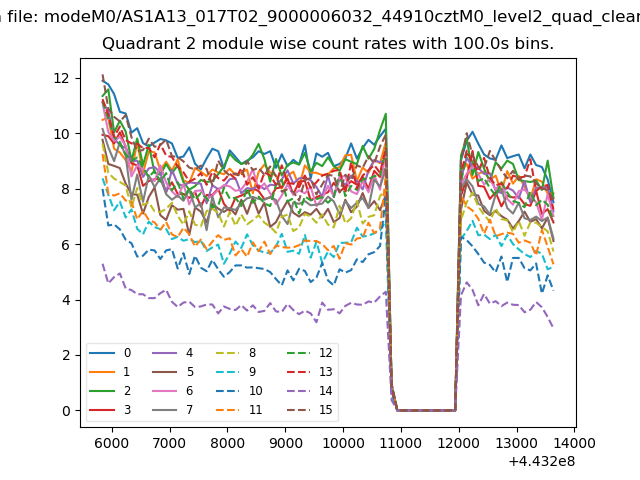
| Module-wise count rates for Quadrant B Data is divided into 100 sec bins |
 |
 |
| Module-wise count rates for Quadrant C Data is divided into 100 sec bins |
 |
 |
| Module-wise count rates for Quadrant D Data is divided into 100 sec bins |
 |
 |
| Parameter | Plot |
|---|---|
| CZT HV Monitor | 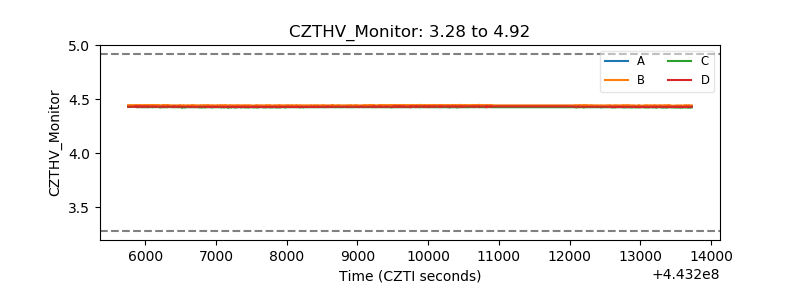 |
| D_VDD | 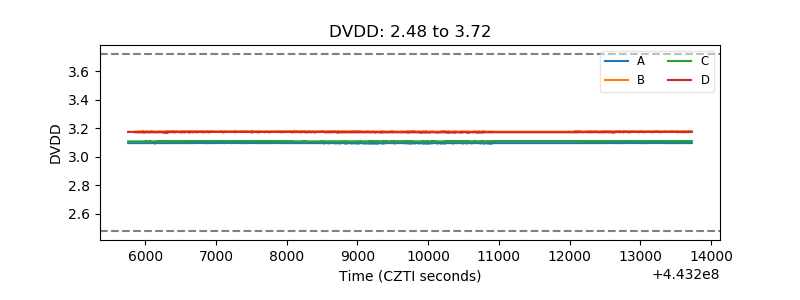 |
| Temperature 1 | 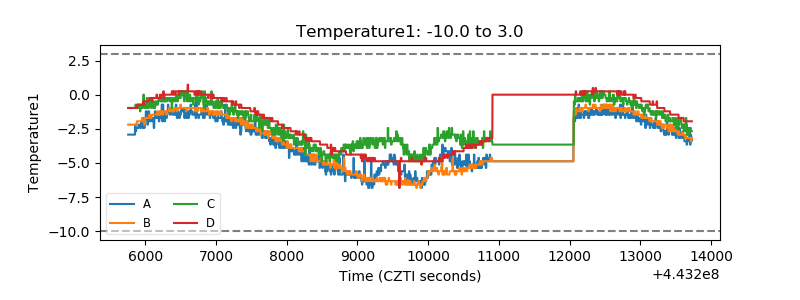 |
| Veto HV Monitor | 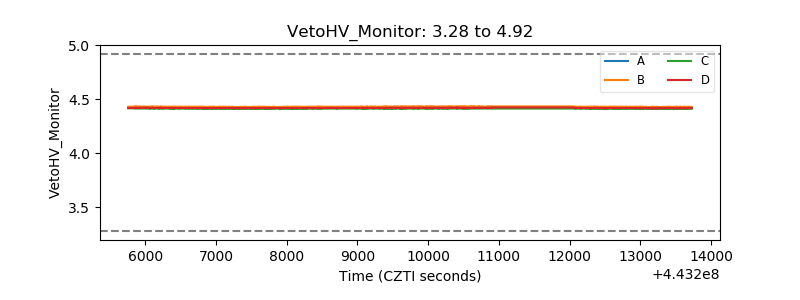 |
| Veto LLD | 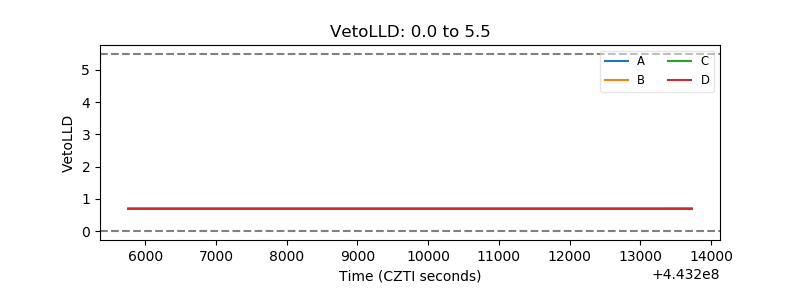 |
| Alpha Counter | 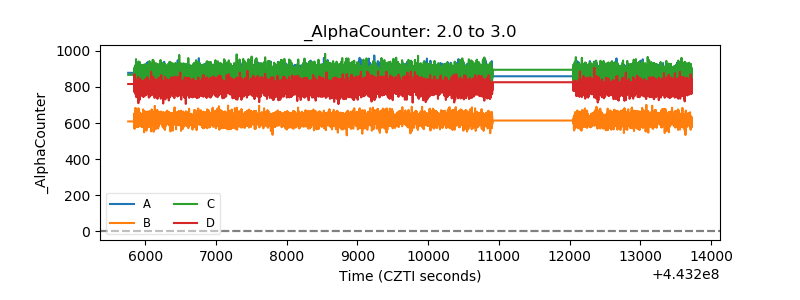 |
| _CPM_Rate | 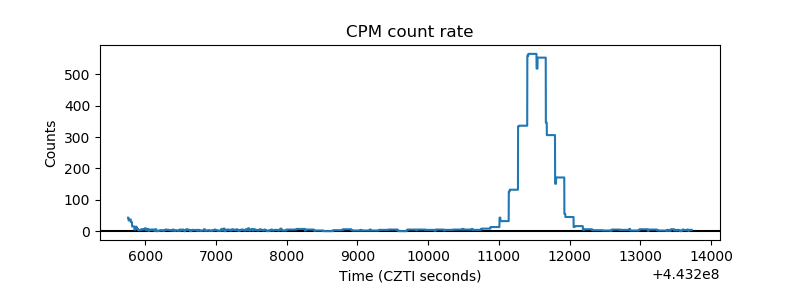 |
| CZT Counter | 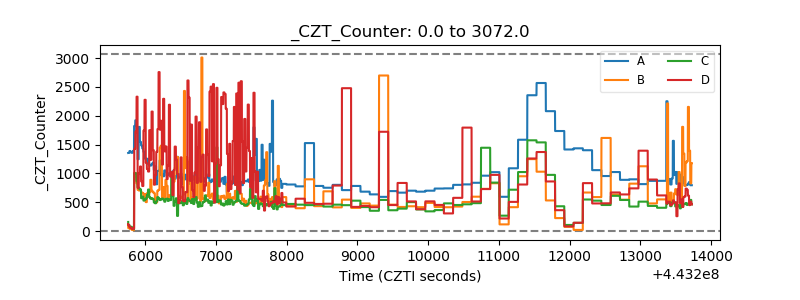 |
| +2.5 Volts monitor | 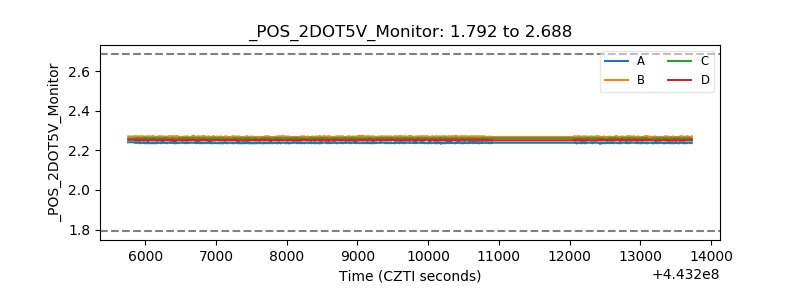 |
| +5 Volts monitor | 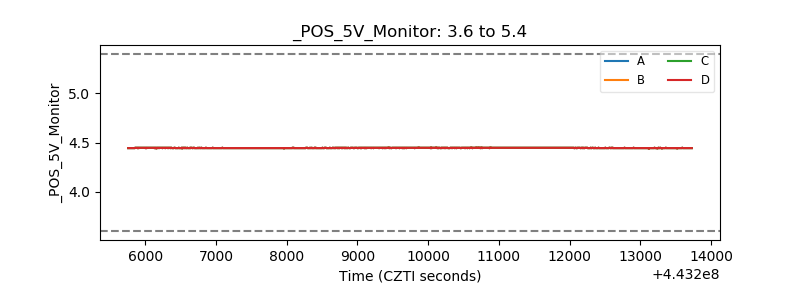 |
| _ROLL_ROT | 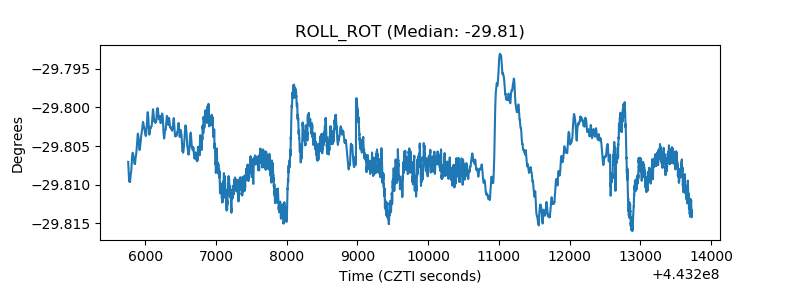 |
| _Roll_DEC | 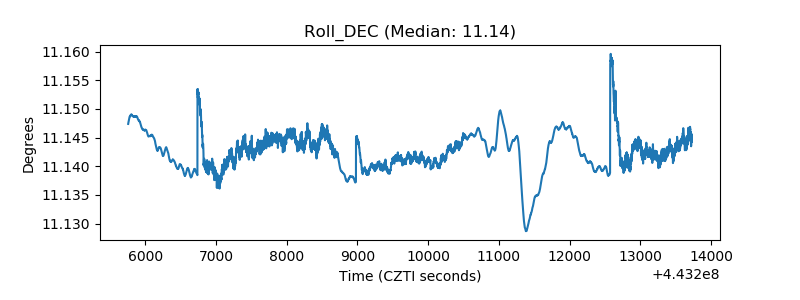 |
| _Roll_RA | 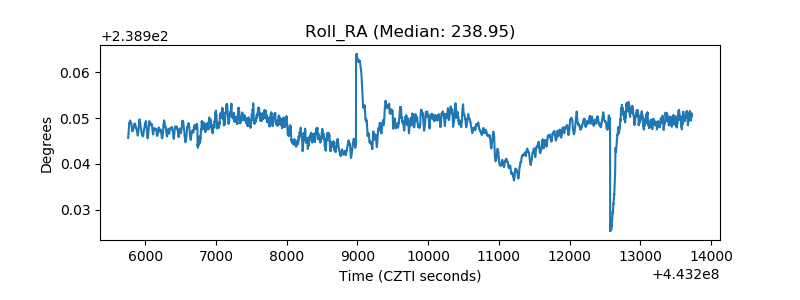 |
| Veto Counter | 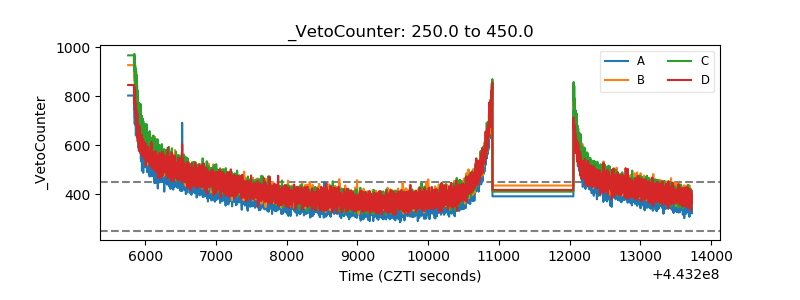 |