| Param | Original file | Final file |
|---|---|---|
| Filename | modeM0/AS1A13_017T02_9000006032_44911cztM0_level2.fits | modeM0/AS1A13_017T02_9000006032_44911cztM0_level2_quad_clean.evt |
| Size (bytes) | 545,711,040 | 112,173,120 |
| Size | 520.4 MB | 107.0 MB |
| Events in quadrant A | 5,981,682 | 741,416 |
| Events in quadrant B | 4,574,938 | 765,303 |
| Events in quadrant C | 3,313,972 | 765,509 |
| Events in quadrant D | 5,810,920 | 656,996 |
| Mode SS | |||
|---|---|---|---|
| Quadrant | BADHDUFLAG | Total packets | Discarded packets |
| A | 0 | 138 | 0 |
| B | 0 | 138 | 0 |
| C | 0 | 138 | 0 |
| D | 0 | 138 | 0 |
| Mode M0 | |||
|---|---|---|---|
| Quadrant | BADHDUFLAG | Total packets | Discarded packets |
| A | 0 | 22692 | 2 |
| B | 0 | 18190 | 2 |
| C | 0 | 14448 | 2 |
| D | 0 | 21883 | 2 |
| Mode M9 | |||
|---|---|---|---|
| Quadrant | BADHDUFLAG | Total packets | Discarded packets |
| A | 0 | 12 | 0 |
| B | 0 | 13 | 0 |
| C | 0 | 13 | 0 |
| D | 0 | 13 | 0 |
| Quadrant | Total seconds | Saturated seconds | Saturation percentage |
|---|---|---|---|
| A | 6694 | 406 | 6.065133% |
| B | 6693 | 401 | 5.991334% |
| C | 6693 | 108 | 1.613626% |
| D | 6693 | 587 | 8.770357% |
Noise dominated data is calculated using 1-second bins in cleaned event files. If a bin has >2000 counts, and if more than 50% of those come from <1% of pixels, then it is considered to be noise-dominated and hence unusable.
| Quadrant | # 1 sec bins | Bins with >0 counts | Bins with >2000 counts | High rate bins dominated by noise | Noise dominated (total time) | Noise dominated (detector-on time) | Marked lightcurve |
|---|---|---|---|---|---|---|---|
| A | 7614 | 6695 | 64 | 64 | 0.84% | 0.96% | 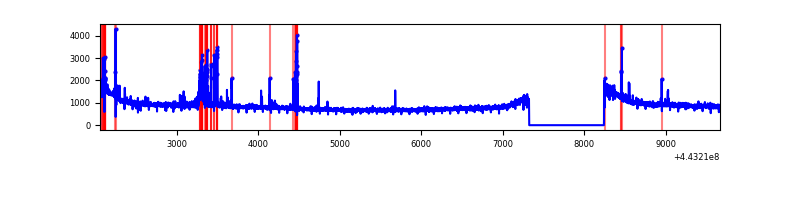 |
| B | 7613 | 6694 | 118 | 118 | 1.55% | 1.76% | 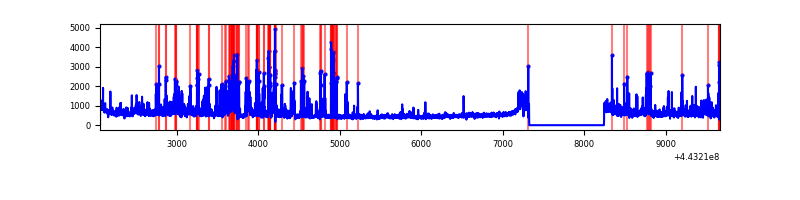 |
| C | 7613 | 6693 | 9 | 9 | 0.12% | 0.13% | 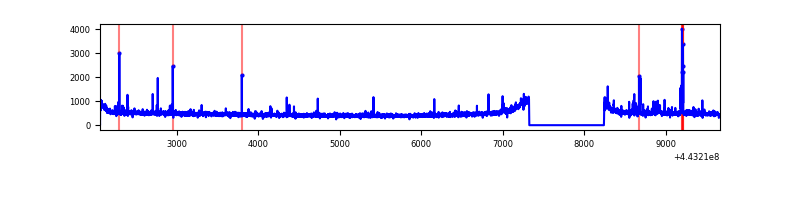 |
| D | 7613 | 6693 | 343 | 343 | 4.51% | 5.12% | 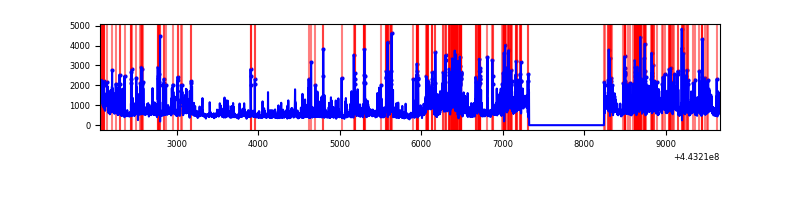 |
Top three noisy pixels from each quadrant. If the there are fewer than three noisy pixels in the level2.evt file, extra rows are filled as -1
| Pixel properties | Quadrant properties | ||||||
|---|---|---|---|---|---|---|---|
| Quadrant | DetID | PixID | Counts | Sigma | Mean | Median | Sigma |
| A | 10 | 83 | 2601191 | 15575.62 | 802 | 785 | 167.0 |
| A | 13 | 248 | 255755 | 1527.19 | 802 | 785 | 167.0 |
| A | 0 | 243 | 23276 | 134.71 | 802 | 785 | 167.0 |
| B | 4 | 171 | 634504 | 4005.72 | 801 | 777 | 158.2 |
| B | 0 | 190 | 110663 | 694.58 | 801 | 777 | 158.2 |
| B | 0 | 155 | 108558 | 681.27 | 801 | 777 | 158.2 |
| C | 15 | 208 | 65413 | 339.17 | 805 | 813 | 190.5 |
| C | 12 | 250 | 30020 | 153.35 | 805 | 813 | 190.5 |
| C | 3 | 233 | 20148 | 101.51 | 805 | 813 | 190.5 |
| D | 1 | 52 | 703266 | 3547.16 | 782 | 758 | 198.0 |
| D | 5 | 222 | 550038 | 2773.47 | 782 | 758 | 198.0 |
| D | 13 | 249 | 312041 | 1571.75 | 782 | 758 | 198.0 |
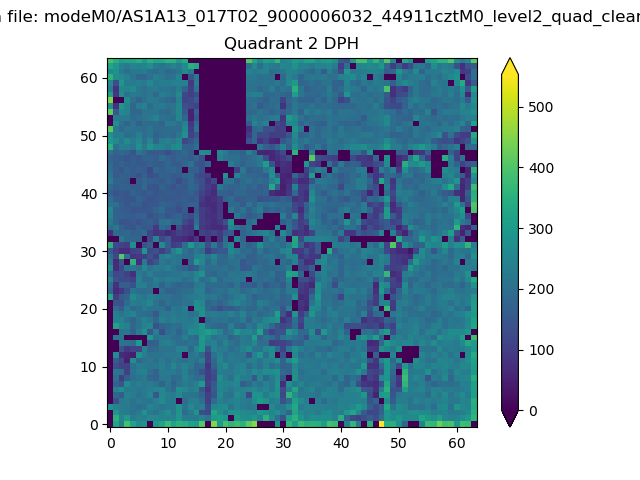
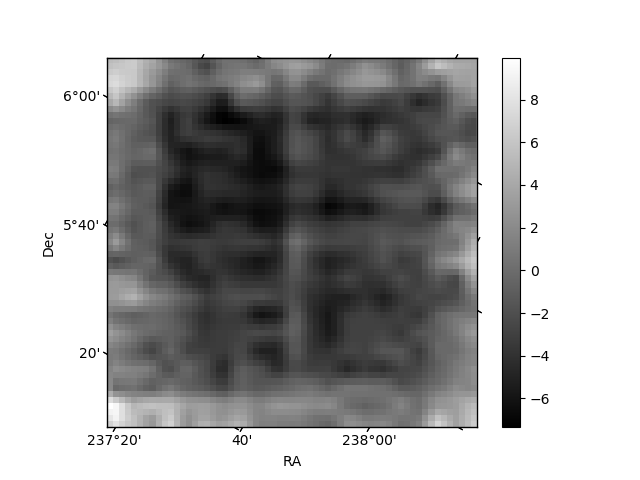
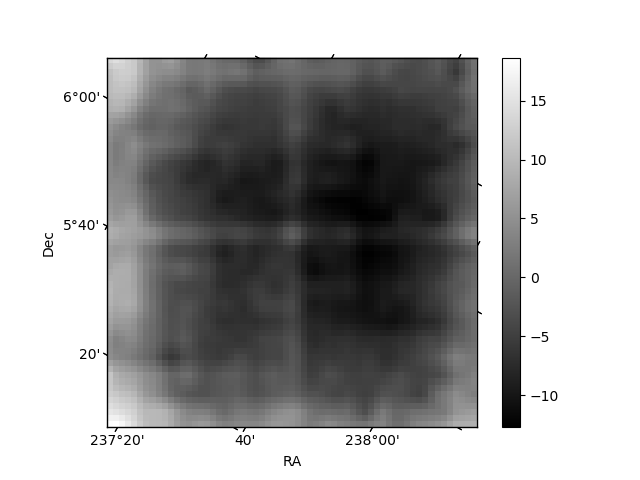
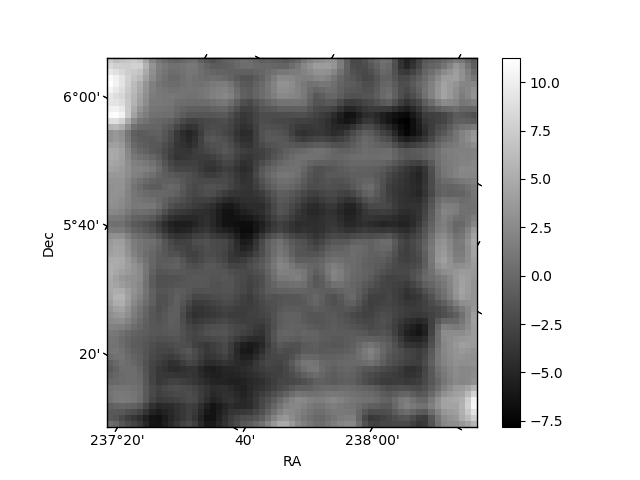
Histogram calculated using DETX and DETY for each event in the final _common_clean file
| Quadrant A | 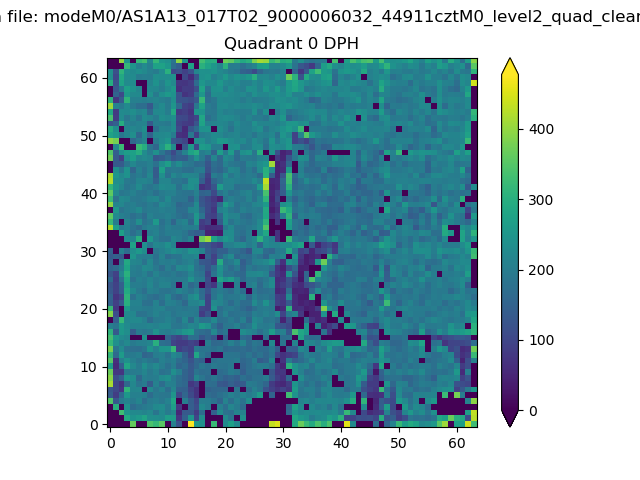 |
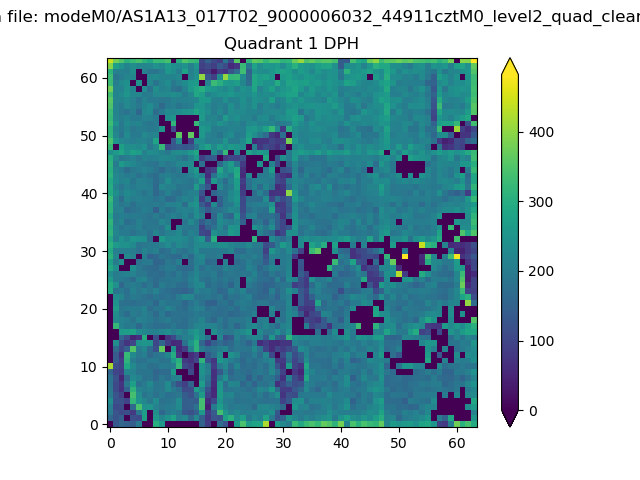 |
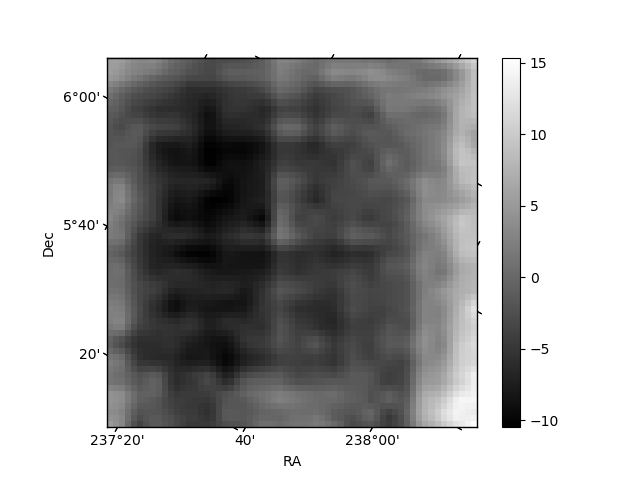
Quadrant B |
|---|---|---|---|
| Quadrant D | 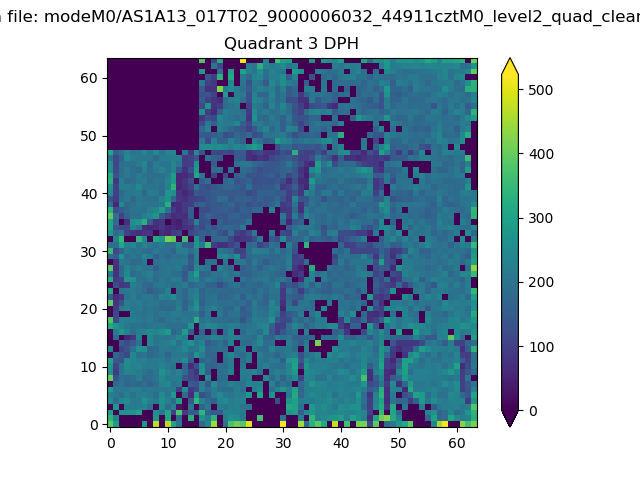 |
 |
Quadrant C |
| Plot type | Count rate plots | Images |
|---|---|---|
| Comparison with Poisson distribution Blue bars denote a histogram of data divided into 1 sec bins. Red curve is a Poisson curve with rate = median count rate of data. |
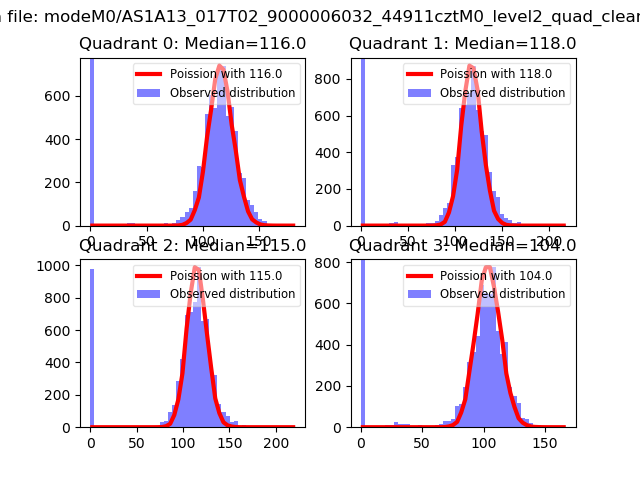 |
 |
| Quadrant-wise count rates Data is divided into 100 sec bins |
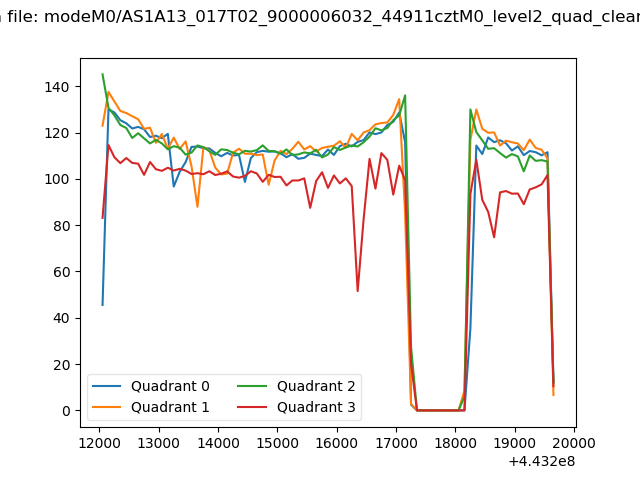 |
|
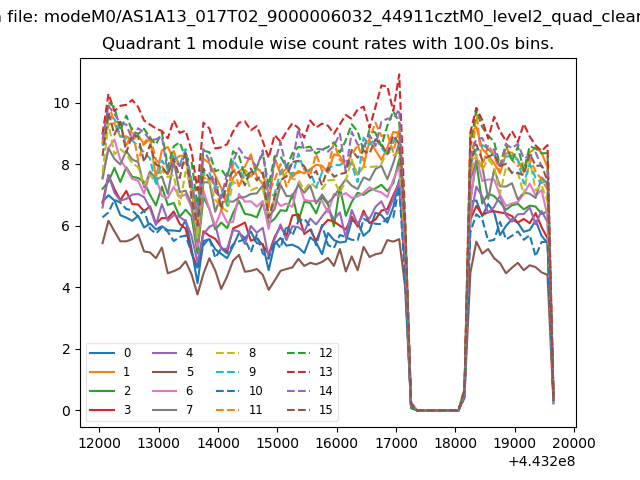
| Module-wise count rates for Quadrant A Data is divided into 100 sec bins |
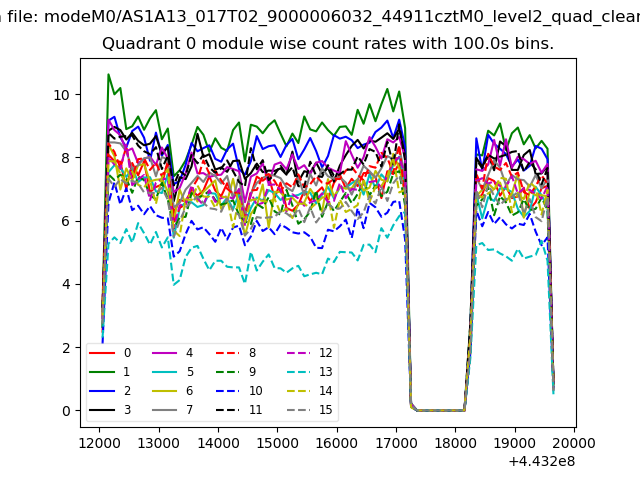 |
 |
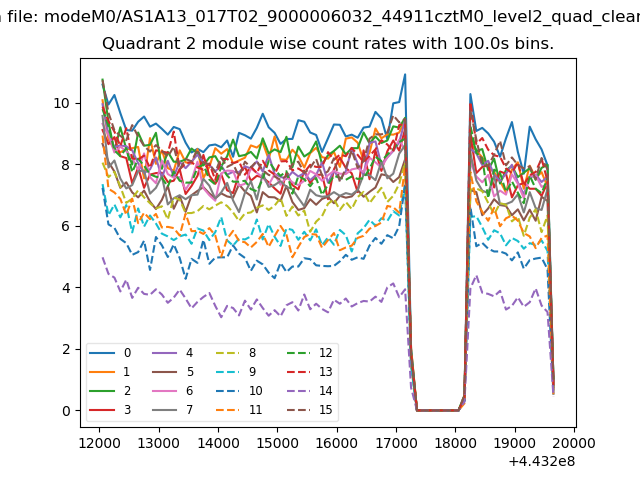
| Module-wise count rates for Quadrant B Data is divided into 100 sec bins |
 |
 |
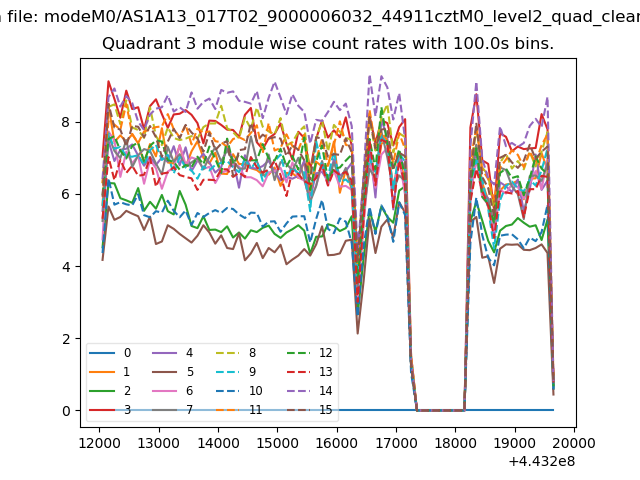
| Module-wise count rates for Quadrant C Data is divided into 100 sec bins |
 |
 |
| Module-wise count rates for Quadrant D Data is divided into 100 sec bins |
 |
 |
| Parameter | Plot |
|---|---|
| CZT HV Monitor | 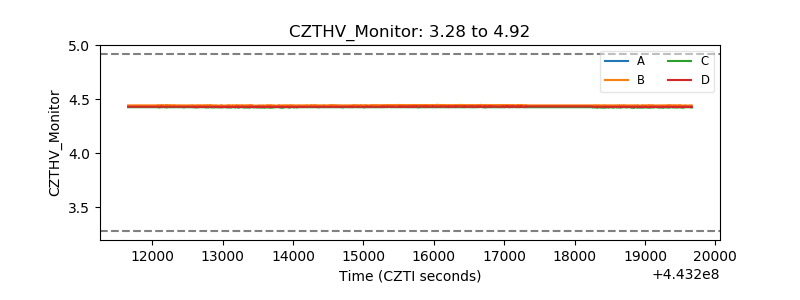 |
| D_VDD | 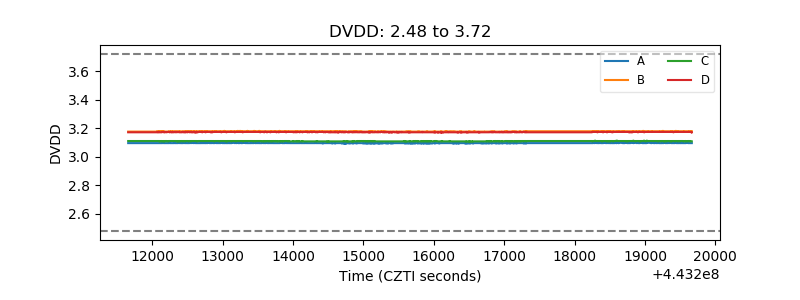 |
| Temperature 1 | 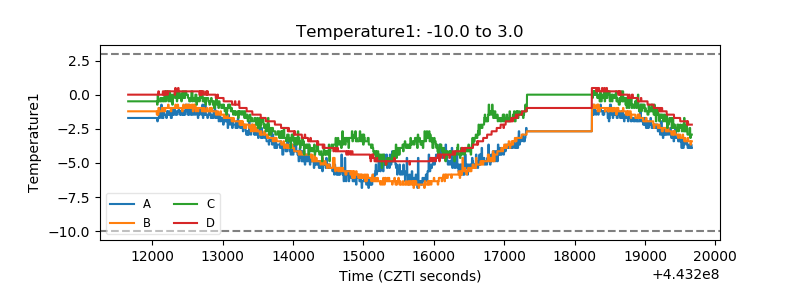 |
| Veto HV Monitor | 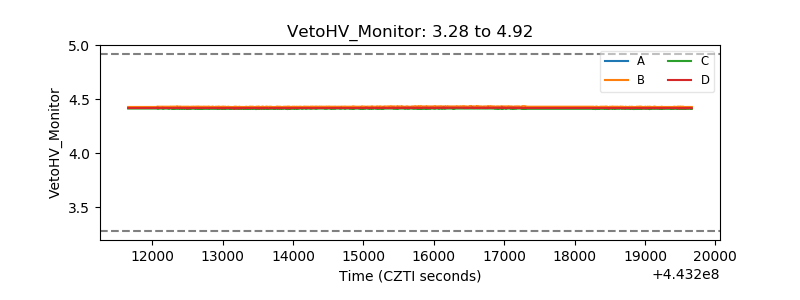 |
| Veto LLD | 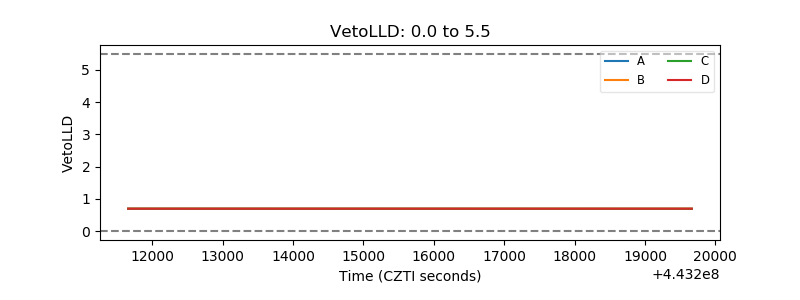 |
| Alpha Counter | 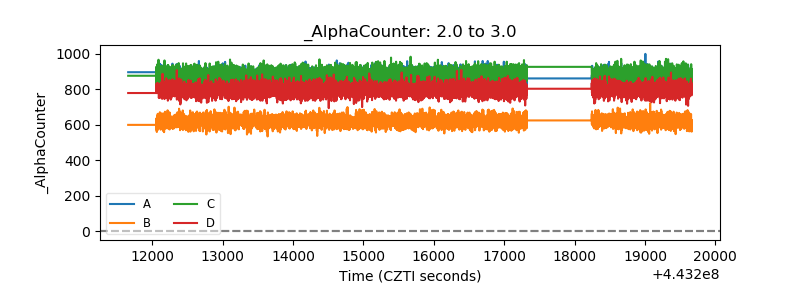 |
| _CPM_Rate | 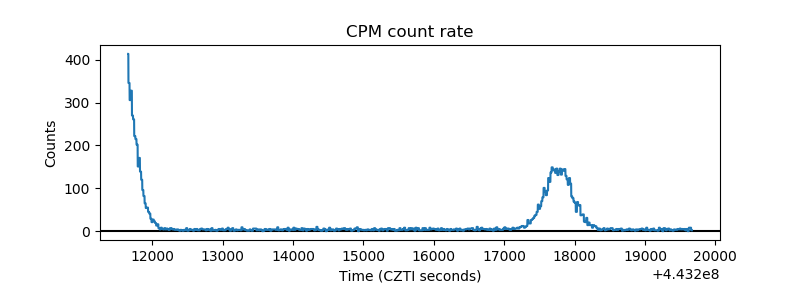 |
| CZT Counter | 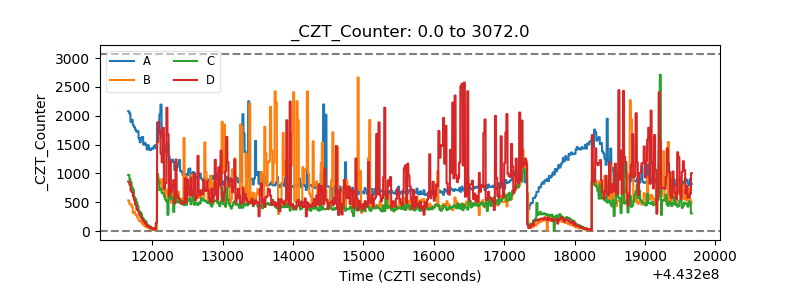 |
| +2.5 Volts monitor | 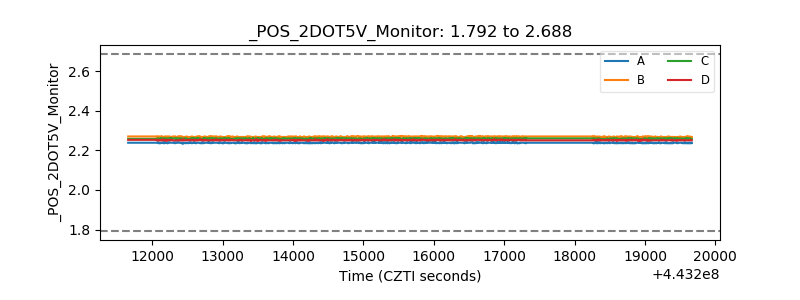 |
| +5 Volts monitor | 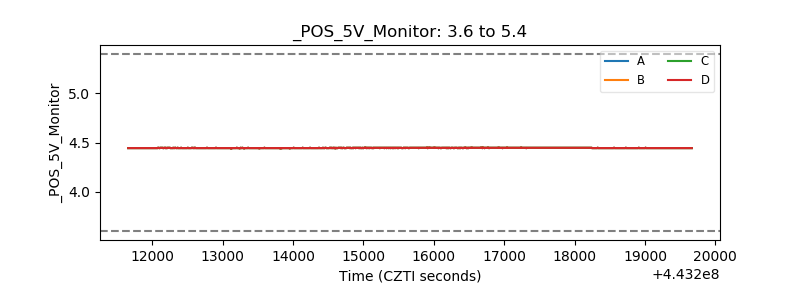 |
| _ROLL_ROT | 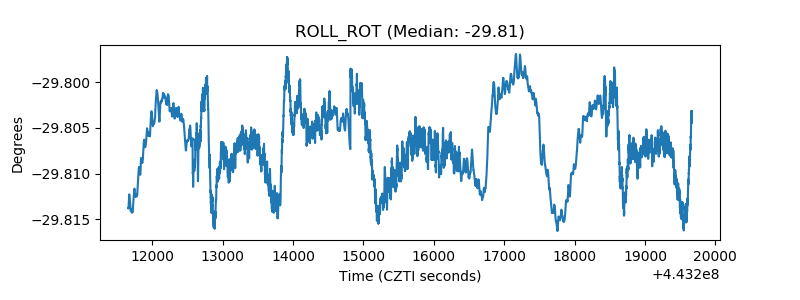 |
| _Roll_DEC | 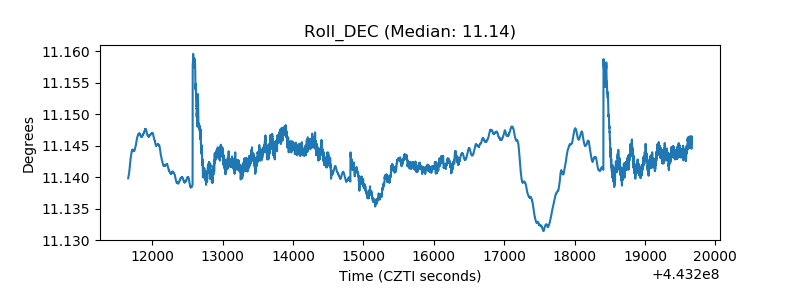 |
| _Roll_RA |  |
| Veto Counter | 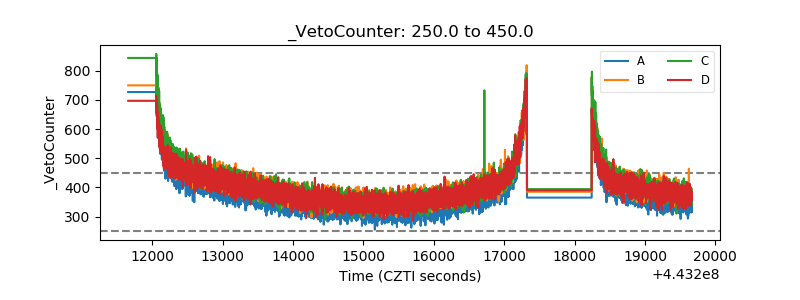 |