| Param | Original file | Final file |
|---|---|---|
| Filename | modeM0/AS1A13_017T02_9000006032_44913cztM0_level2.fits | modeM0/AS1A13_017T02_9000006032_44913cztM0_level2_quad_clean.evt |
| Size (bytes) | 668,047,680 | 124,986,240 |
| Size | 637.1 MB | 119.2 MB |
| Events in quadrant A | 6,610,279 | 851,203 |
| Events in quadrant B | 4,549,778 | 876,145 |
| Events in quadrant C | 3,700,418 | 855,280 |
| Events in quadrant D | 9,261,578 | 656,253 |
| Mode SS | |||
|---|---|---|---|
| Quadrant | BADHDUFLAG | Total packets | Discarded packets |
| A | 0 | 158 | 0 |
| B | 0 | 158 | 0 |
| C | 0 | 158 | 0 |
| D | 0 | 158 | 0 |
| Mode M0 | |||
|---|---|---|---|
| Quadrant | BADHDUFLAG | Total packets | Discarded packets |
| A | 0 | 25573 | 0 |
| B | 0 | 18899 | 0 |
| C | 0 | 16573 | 0 |
| D | 0 | 33026 | 0 |
| Quadrant | Total seconds | Saturated seconds | Saturation percentage |
|---|---|---|---|
| A | 7836 | 205 | 2.616131% |
| B | 7837 | 165 | 2.105397% |
| C | 7837 | 35 | 0.446599% |
| D | 7837 | 1582 | 20.186296% |
Noise dominated data is calculated using 1-second bins in cleaned event files. If a bin has >2000 counts, and if more than 50% of those come from <1% of pixels, then it is considered to be noise-dominated and hence unusable.
| Quadrant | # 1 sec bins | Bins with >0 counts | Bins with >2000 counts | High rate bins dominated by noise | Noise dominated (total time) | Noise dominated (detector-on time) | Marked lightcurve |
|---|---|---|---|---|---|---|---|
| A | 7836 | 7836 | 75 | 75 | 0.96% | 0.96% | 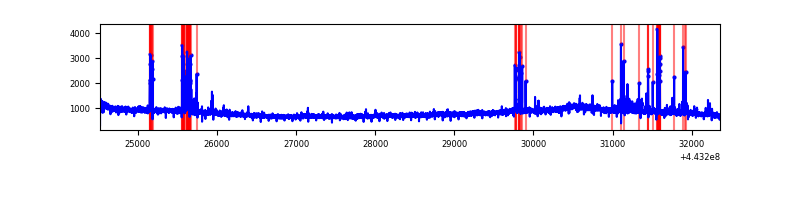 |
| B | 7837 | 7837 | 64 | 64 | 0.82% | 0.82% | 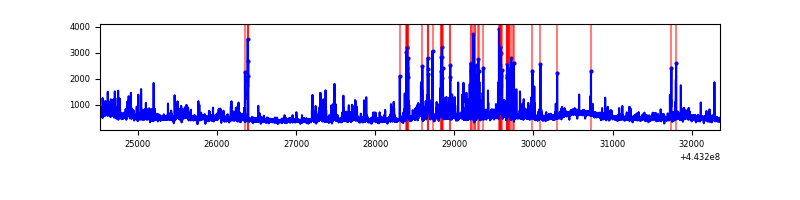 |
| C | 7837 | 7837 | 14 | 14 | 0.18% | 0.18% | 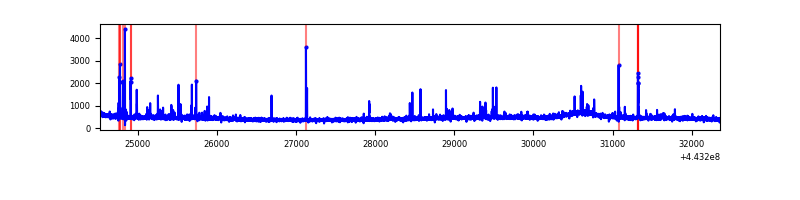 |
| D | 7837 | 7837 | 1002 | 1002 | 12.79% | 12.79% | 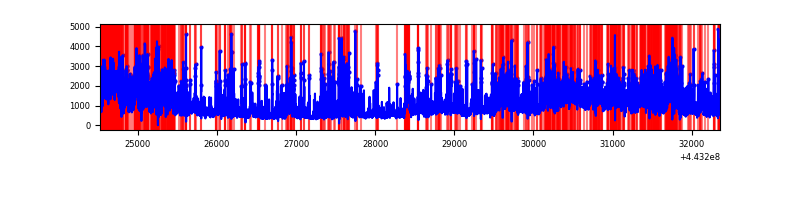 |
Top three noisy pixels from each quadrant. If the there are fewer than three noisy pixels in the level2.evt file, extra rows are filled as -1
| Pixel properties | Quadrant properties | ||||||
|---|---|---|---|---|---|---|---|
| Quadrant | DetID | PixID | Counts | Sigma | Mean | Median | Sigma |
| A | 10 | 83 | 2678946 | 14111.08 | 902 | 880 | 189.8 |
| A | 13 | 248 | 333909 | 1754.77 | 902 | 880 | 189.8 |
| A | 0 | 247 | 83445 | 435.05 | 902 | 880 | 189.8 |
| B | 3 | 112 | 366927 | 2059.11 | 903 | 875 | 177.8 |
| B | 5 | 172 | 138137 | 772.12 | 903 | 875 | 177.8 |
| B | 0 | 155 | 107167 | 597.91 | 903 | 875 | 177.8 |
| C | 12 | 2 | 77658 | 362.86 | 894 | 899 | 211.5 |
| C | 14 | 254 | 27668 | 126.55 | 894 | 899 | 211.5 |
| C | 0 | 207 | 27251 | 124.57 | 894 | 899 | 211.5 |
| D | 1 | 52 | 3205620 | 15239.9 | 823 | 799 | 210.3 |
| D | 13 | 174 | 890185 | 4229.3 | 823 | 799 | 210.3 |
| D | 13 | 249 | 435545 | 2067.35 | 823 | 799 | 210.3 |
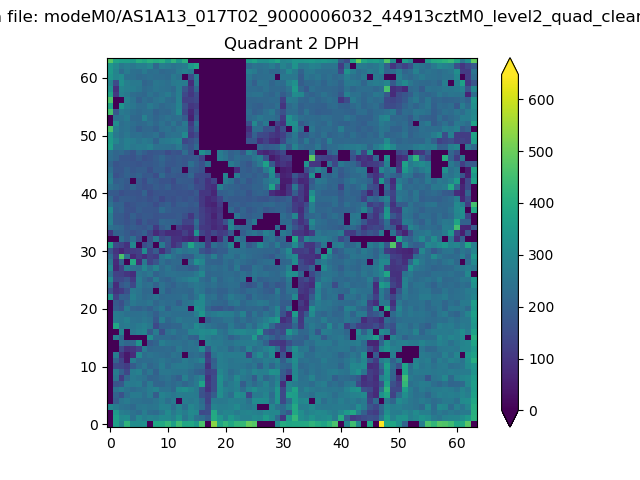
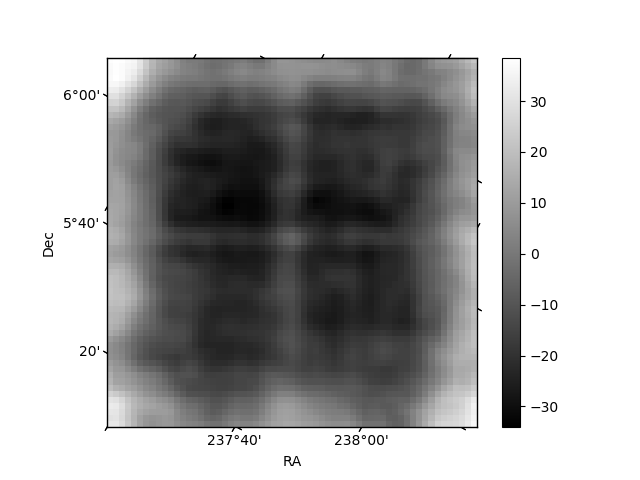
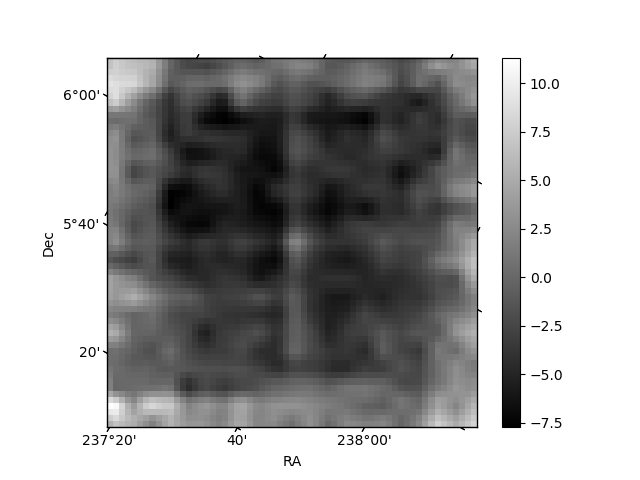
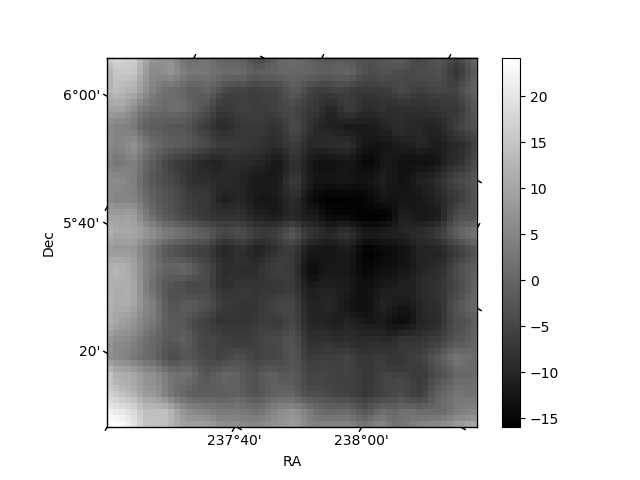
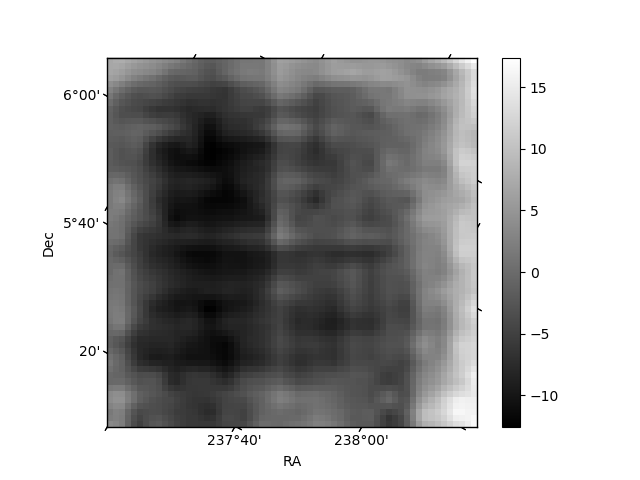
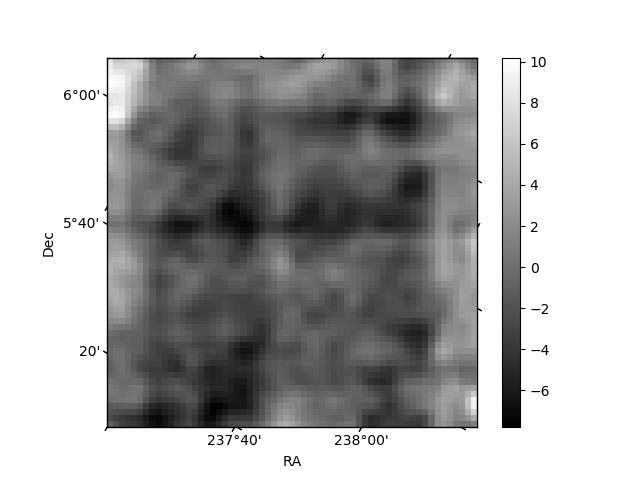
Histogram calculated using DETX and DETY for each event in the final _common_clean file
| Quadrant A | 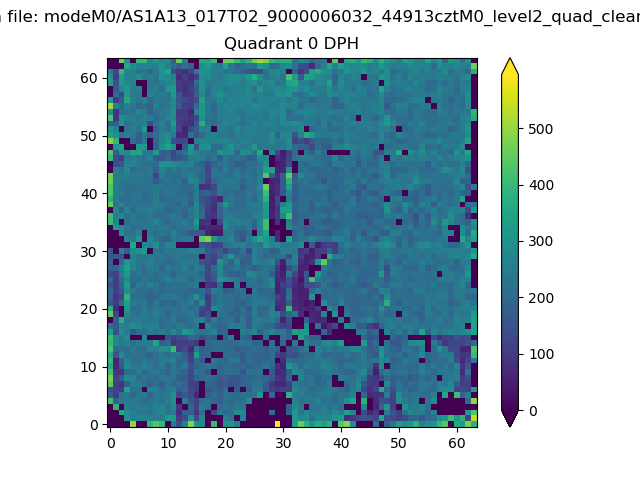 |
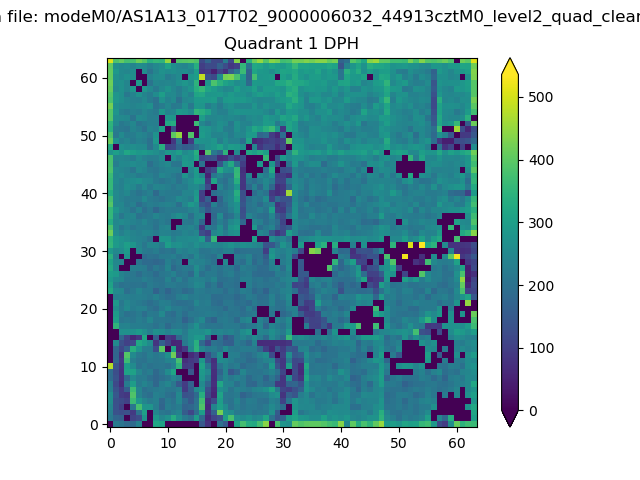 |
Quadrant B |
|---|---|---|---|
| Quadrant D | 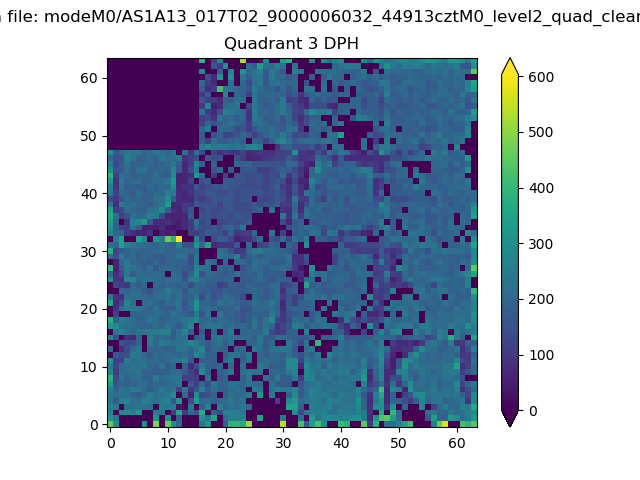 |
 |
Quadrant C |
| Plot type | Count rate plots | Images |
|---|---|---|
| Comparison with Poisson distribution Blue bars denote a histogram of data divided into 1 sec bins. Red curve is a Poisson curve with rate = median count rate of data. |
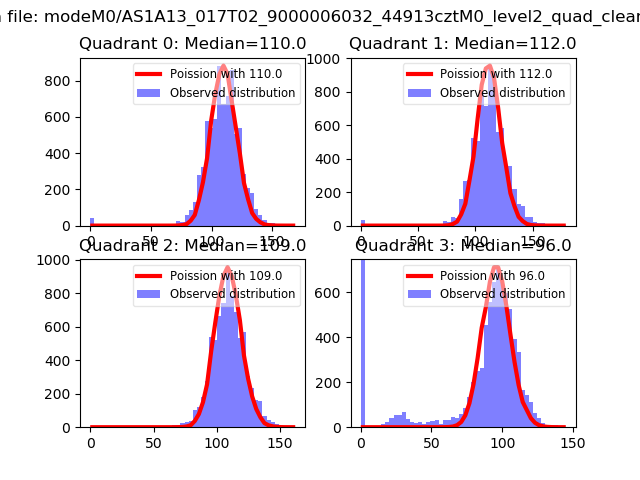 |
 |
| Quadrant-wise count rates Data is divided into 100 sec bins |
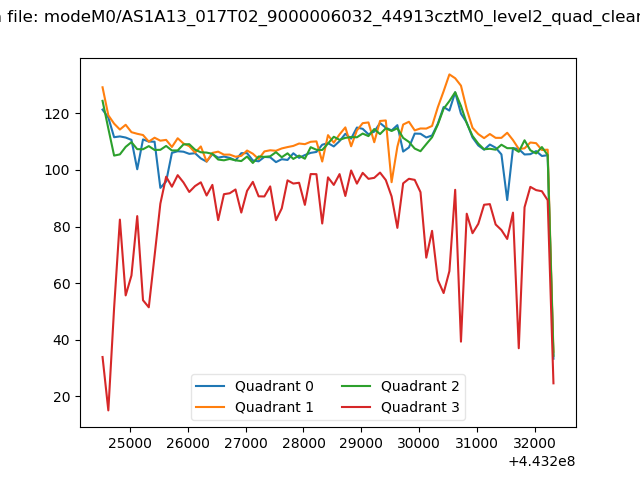 |
|
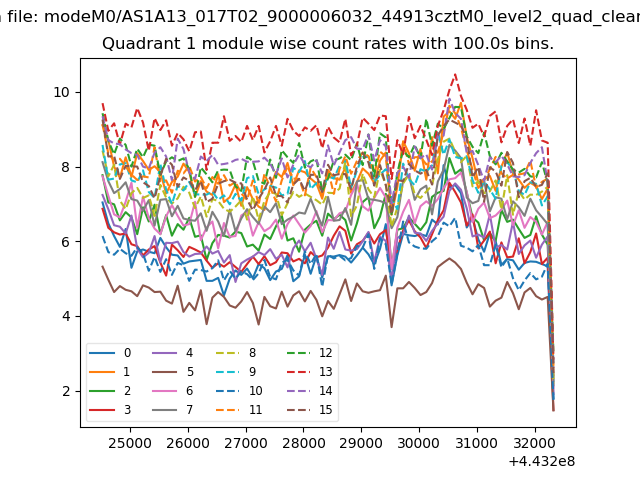
| Module-wise count rates for Quadrant A Data is divided into 100 sec bins |
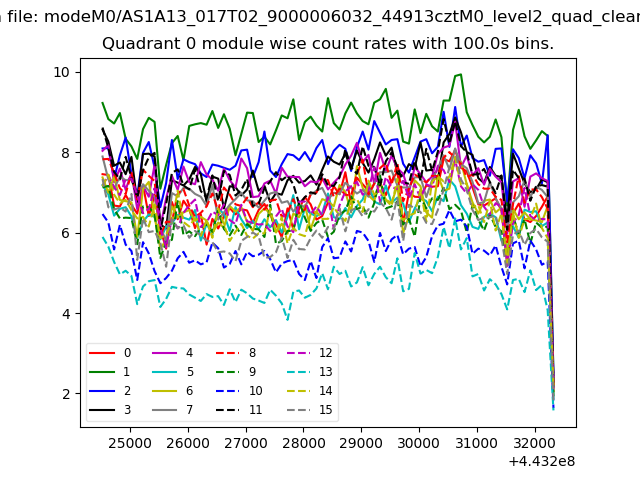 |
 |
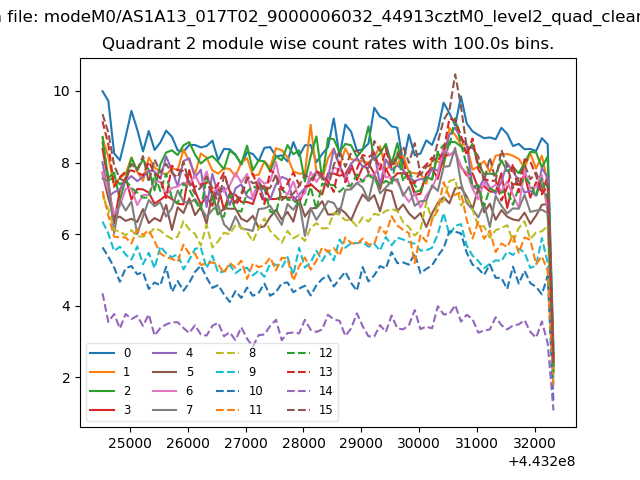
| Module-wise count rates for Quadrant B Data is divided into 100 sec bins |
 |
 |
| Module-wise count rates for Quadrant C Data is divided into 100 sec bins |
 |
 |
| Module-wise count rates for Quadrant D Data is divided into 100 sec bins |
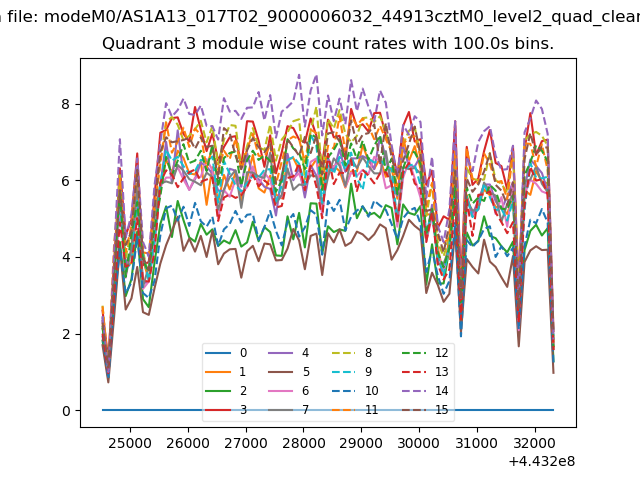 |
 |
| Parameter | Plot |
|---|---|
| CZT HV Monitor | 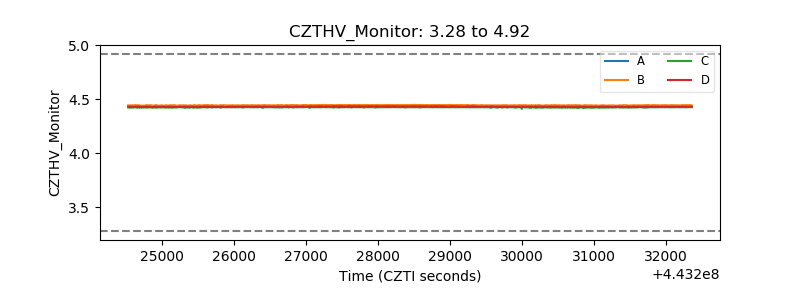 |
| D_VDD | 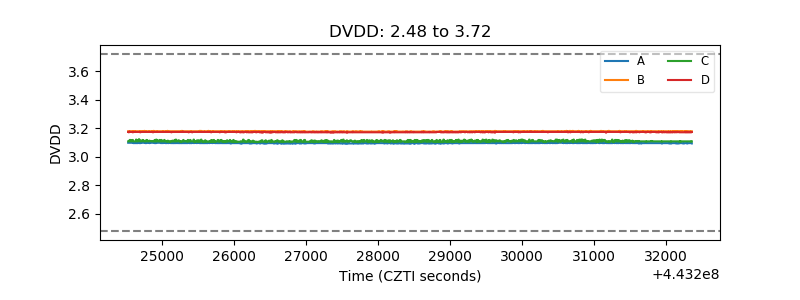 |
| Temperature 1 | 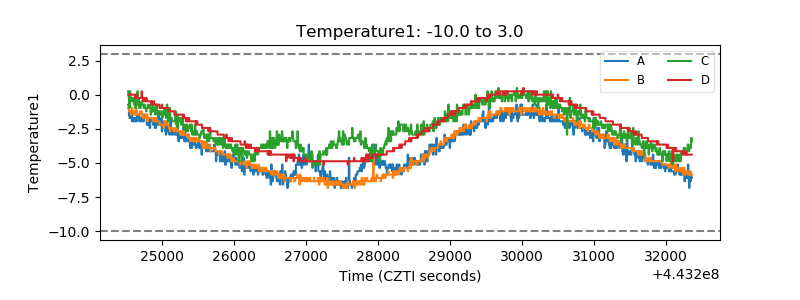 |
| Veto HV Monitor |  |
| Veto LLD | 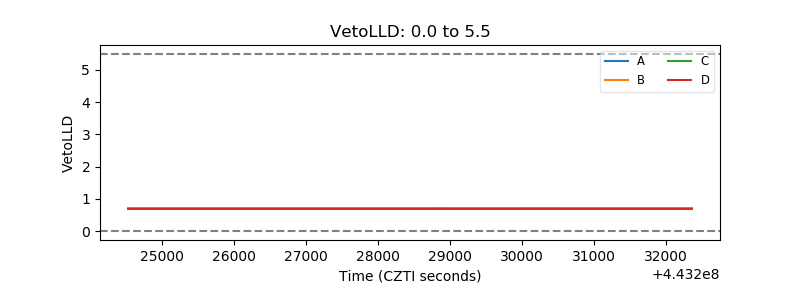 |
| Alpha Counter | 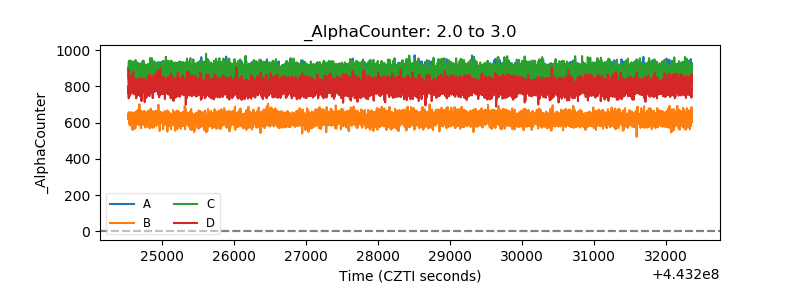 |
| _CPM_Rate | 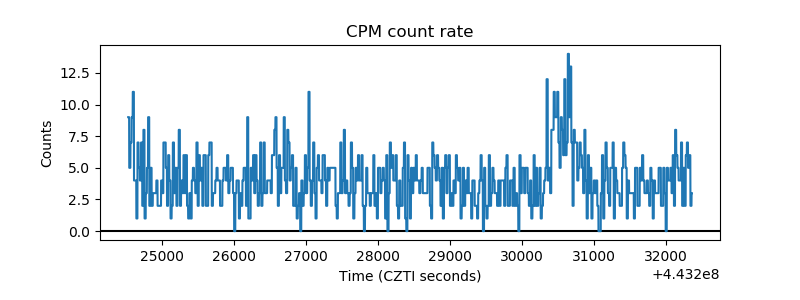 |
| CZT Counter | 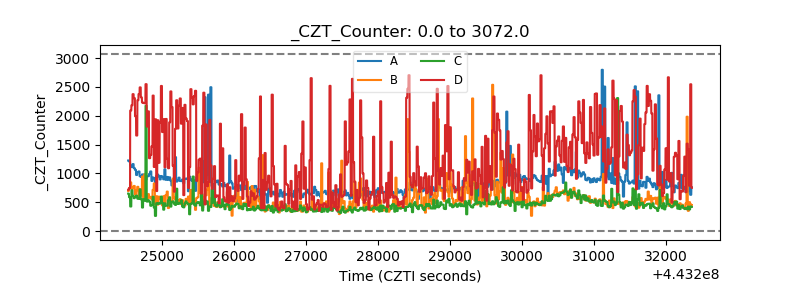 |
| +2.5 Volts monitor | 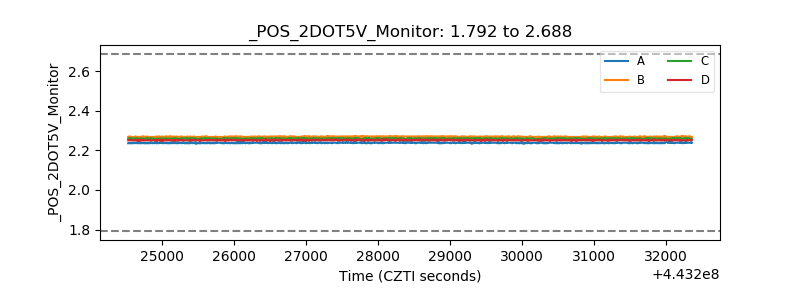 |
| +5 Volts monitor | 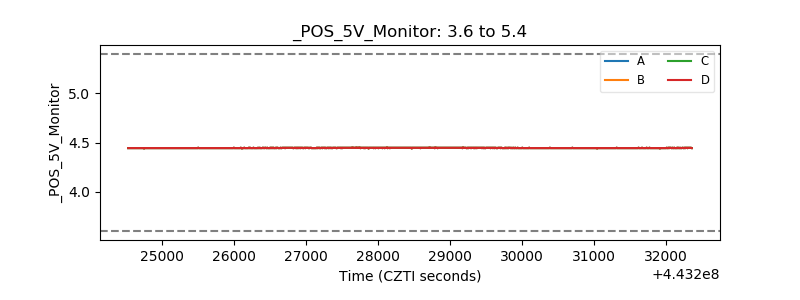 |
| _ROLL_ROT | 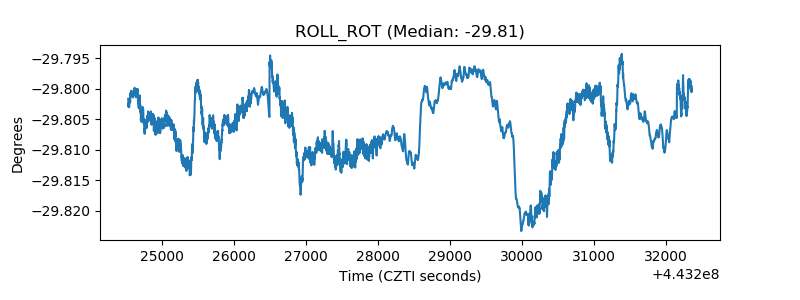 |
| _Roll_DEC | 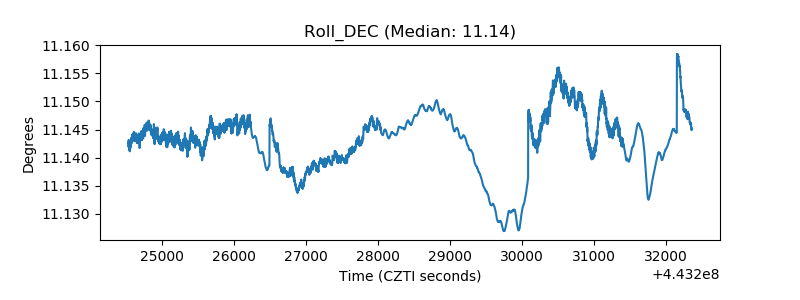 |
| _Roll_RA | 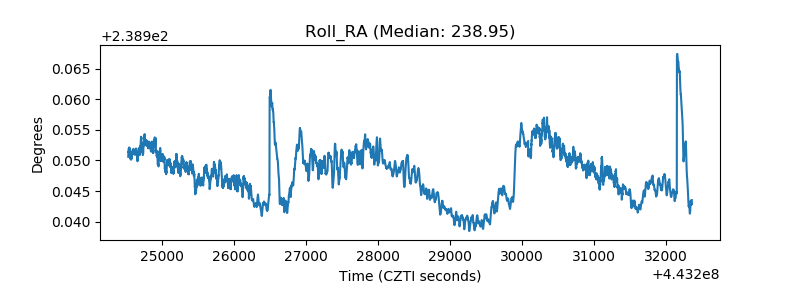 |
| Veto Counter | 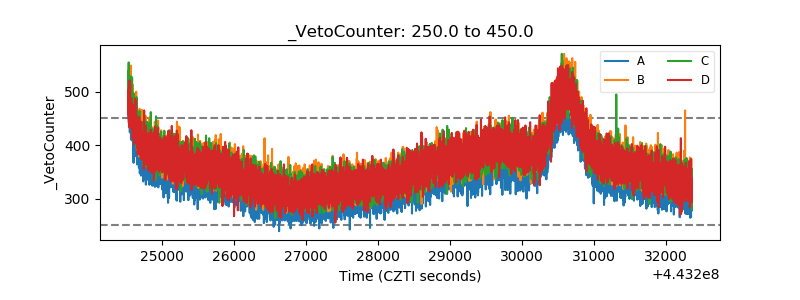 |