| Param | Original file | Final file |
|---|---|---|
| Filename | modeM0/AS1A13_017T02_9000006032_44917cztM0_level2.fits | modeM0/AS1A13_017T02_9000006032_44917cztM0_level2_quad_clean.evt |
| Size (bytes) | 1,614,070,080 | 311,555,520 |
| Size | 1.5 GB | 297.1 MB |
| Events in quadrant A | 16,059,657 | 2,120,414 |
| Events in quadrant B | 10,269,111 | 2,180,440 |
| Events in quadrant C | 9,331,749 | 2,153,848 |
| Events in quadrant D | 22,545,409 | 1,602,399 |
| Mode SS | |||
|---|---|---|---|
| Quadrant | BADHDUFLAG | Total packets | Discarded packets |
| A | 0 | 402 | 0 |
| B | 0 | 402 | 0 |
| C | 0 | 402 | 0 |
| D | 0 | 402 | 0 |
| Mode M0 | |||
|---|---|---|---|
| Quadrant | BADHDUFLAG | Total packets | Discarded packets |
| A | 0 | 63137 | 1 |
| B | 0 | 44483 | 1 |
| C | 0 | 42192 | 1 |
| D | 0 | 80847 | 3 |
| Mode M9 | |||
|---|---|---|---|
| Quadrant | BADHDUFLAG | Total packets | Discarded packets |
| A | 0 | 4 | 0 |
| B | 0 | 4 | 0 |
| C | 0 | 4 | 0 |
| D | 0 | 4 | 0 |
| Quadrant | Total seconds | Saturated seconds | Saturation percentage |
|---|---|---|---|
| A | 19963 | 587 | 2.940440% |
| B | 19964 | 469 | 2.349229% |
| C | 19963 | 93 | 0.465862% |
| D | 19962 | 3922 | 19.647330% |
Noise dominated data is calculated using 1-second bins in cleaned event files. If a bin has >2000 counts, and if more than 50% of those come from <1% of pixels, then it is considered to be noise-dominated and hence unusable.
| Quadrant | # 1 sec bins | Bins with >0 counts | Bins with >2000 counts | High rate bins dominated by noise | Noise dominated (total time) | Noise dominated (detector-on time) | Marked lightcurve |
|---|---|---|---|---|---|---|---|
| A | 20358 | 19964 | 95 | 95 | 0.47% | 0.48% | 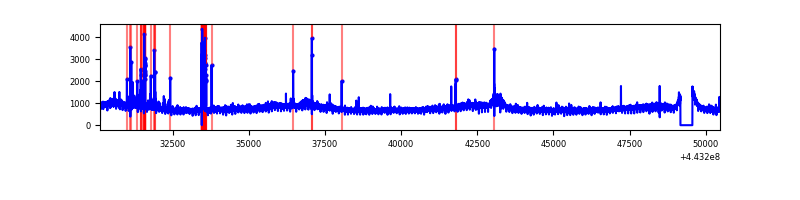 |
| B | 20359 | 19965 | 58 | 58 | 0.28% | 0.29% | 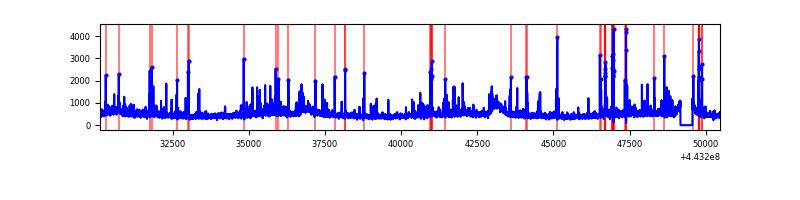 |
| C | 20358 | 19964 | 18 | 18 | 0.09% | 0.09% | 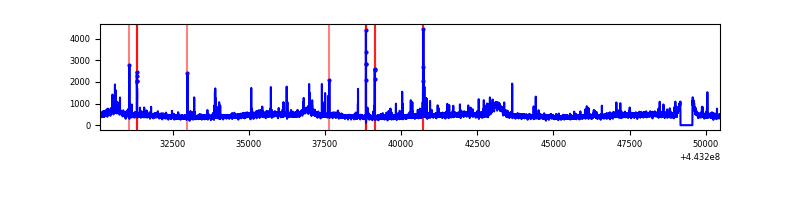 |
| D | 20358 | 19964 | 2776 | 2776 | 13.64% | 13.91% | 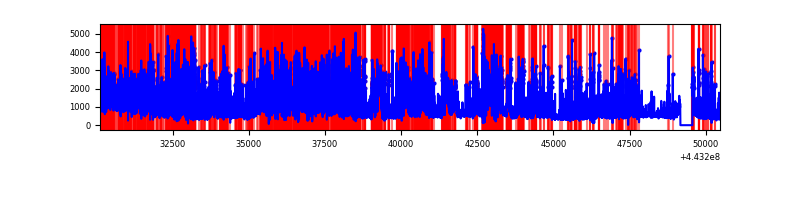 |
Top three noisy pixels from each quadrant. If the there are fewer than three noisy pixels in the level2.evt file, extra rows are filled as -1
| Pixel properties | Quadrant properties | ||||||
|---|---|---|---|---|---|---|---|
| Quadrant | DetID | PixID | Counts | Sigma | Mean | Median | Sigma |
| A | 10 | 83 | 6379007 | 13125.94 | 2312 | 2261 | 485.8 |
| A | 13 | 248 | 370136 | 757.24 | 2312 | 2261 | 485.8 |
| A | 0 | 247 | 285558 | 583.14 | 2312 | 2261 | 485.8 |
| B | 0 | 155 | 157833 | 338.61 | 2317 | 2243 | 459.5 |
| B | 5 | 255 | 128830 | 275.49 | 2317 | 2243 | 459.5 |
| B | 5 | 172 | 114434 | 244.16 | 2317 | 2243 | 459.5 |
| C | 12 | 250 | 104604 | 190.47 | 2288 | 2300 | 537.1 |
| C | 14 | 254 | 80993 | 146.51 | 2288 | 2300 | 537.1 |
| C | 1 | 3 | 62059 | 111.26 | 2288 | 2300 | 537.1 |
| D | 1 | 52 | 6151648 | 11473.73 | 2099 | 2033 | 536.0 |
| D | 4 | 232 | 1660360 | 3094.04 | 2099 | 2033 | 536.0 |
| D | 13 | 249 | 1549278 | 2886.79 | 2099 | 2033 | 536.0 |
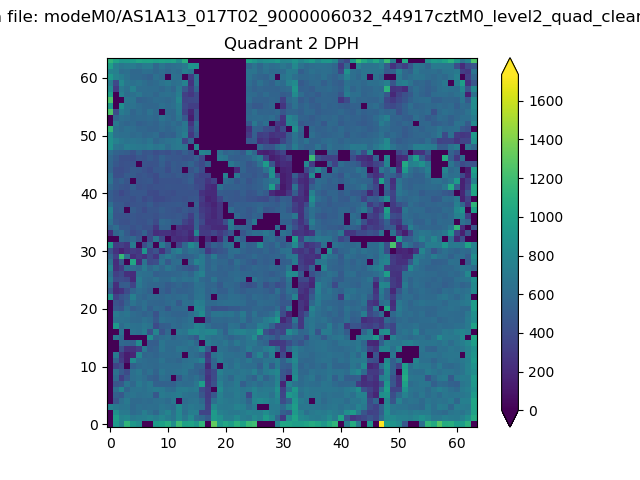
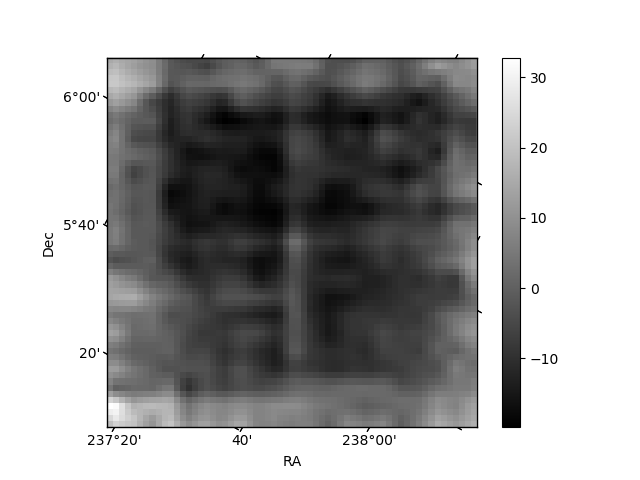
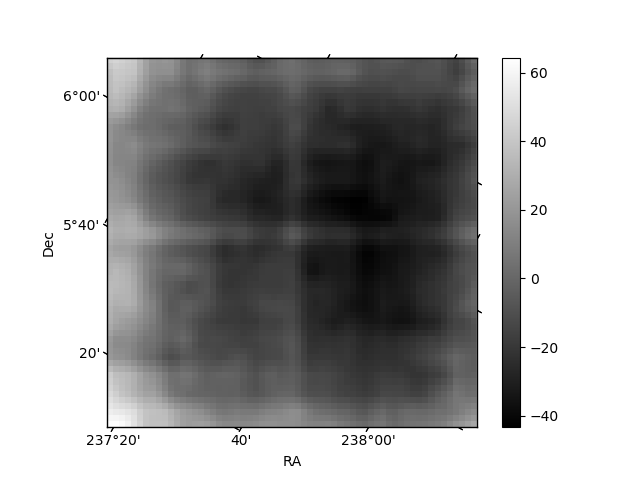
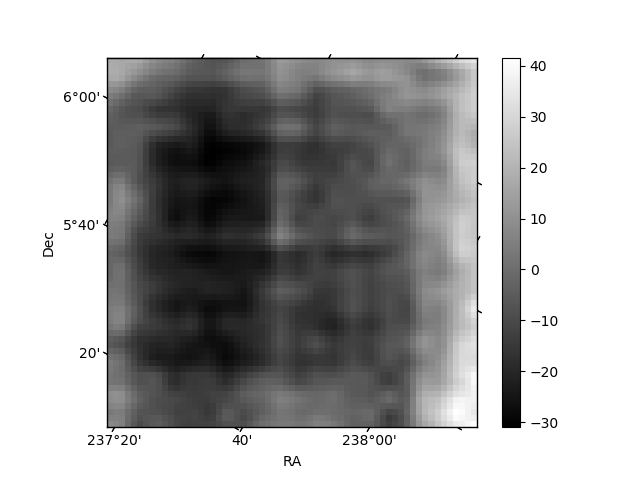
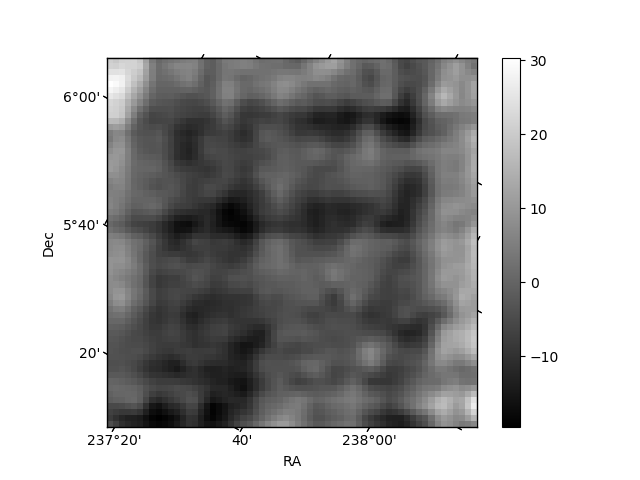
Histogram calculated using DETX and DETY for each event in the final _common_clean file
| Quadrant A | 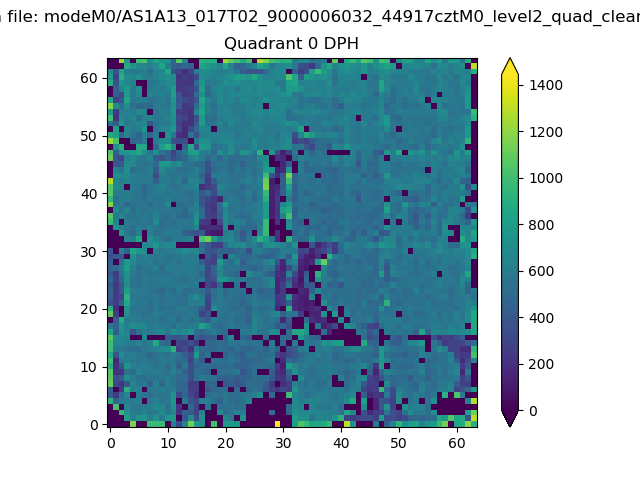 |
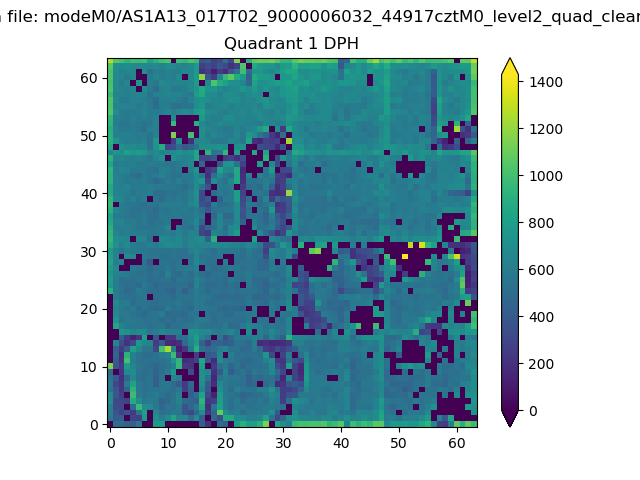 |
Quadrant B |
|---|---|---|---|
| Quadrant D | 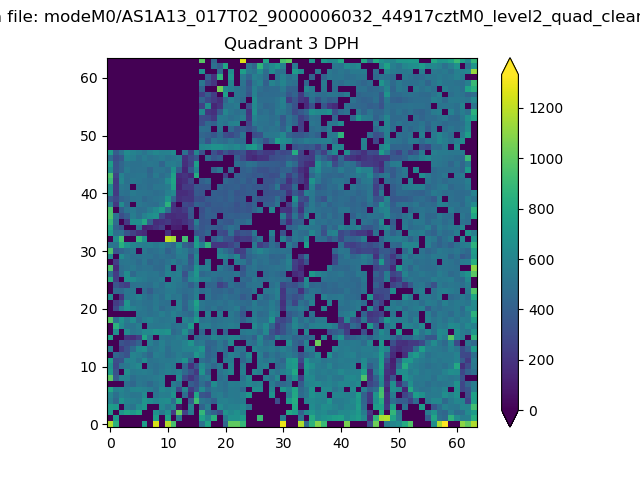 |
 |
Quadrant C |
| Plot type | Count rate plots | Images |
|---|---|---|
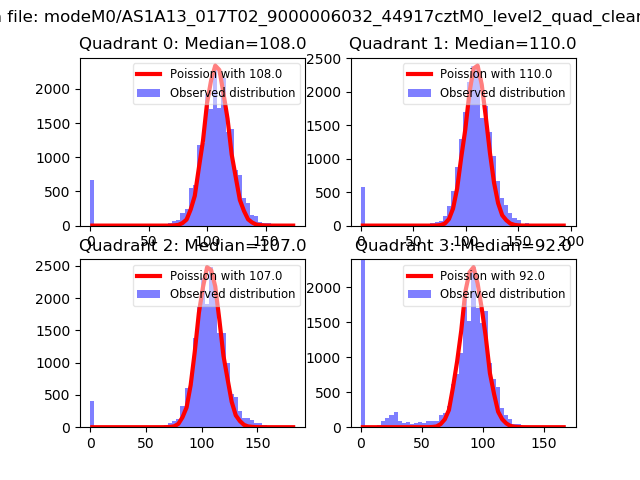
| Comparison with Poisson distribution Blue bars denote a histogram of data divided into 1 sec bins. Red curve is a Poisson curve with rate = median count rate of data. |
 |
 |
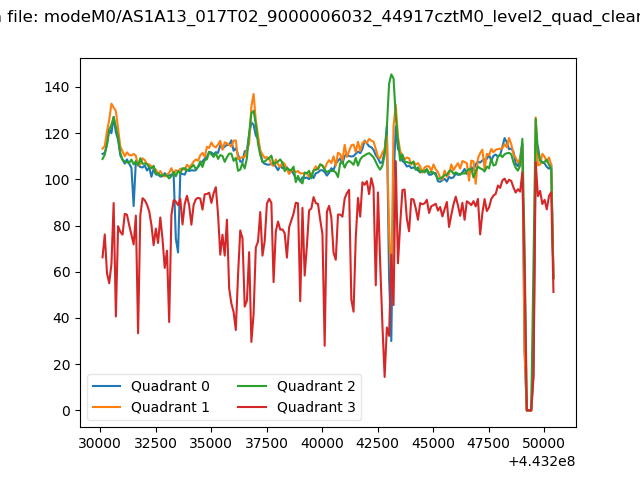
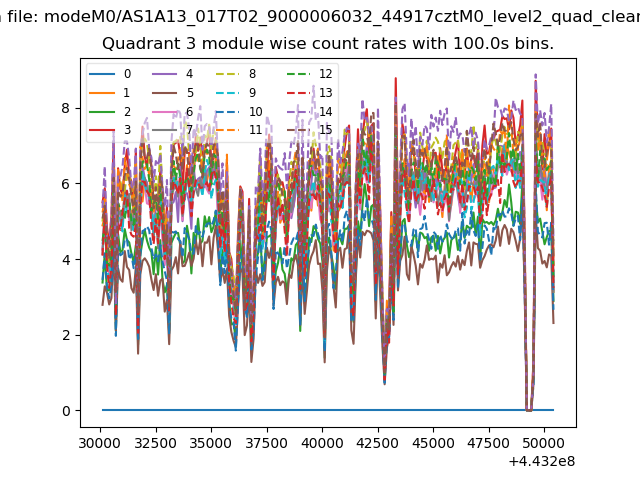
| Quadrant-wise count rates Data is divided into 100 sec bins |
 |
|
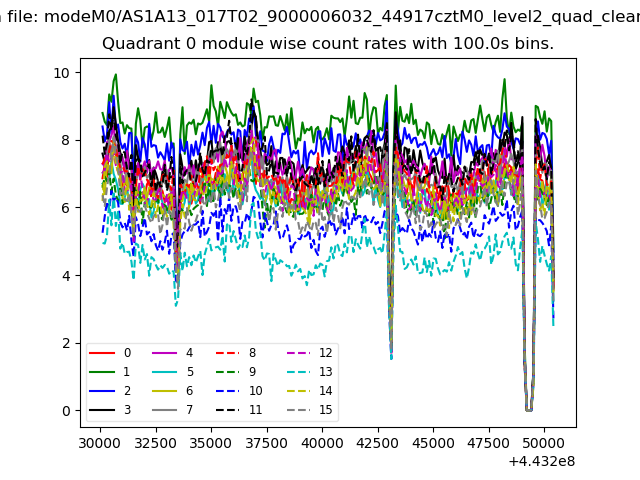
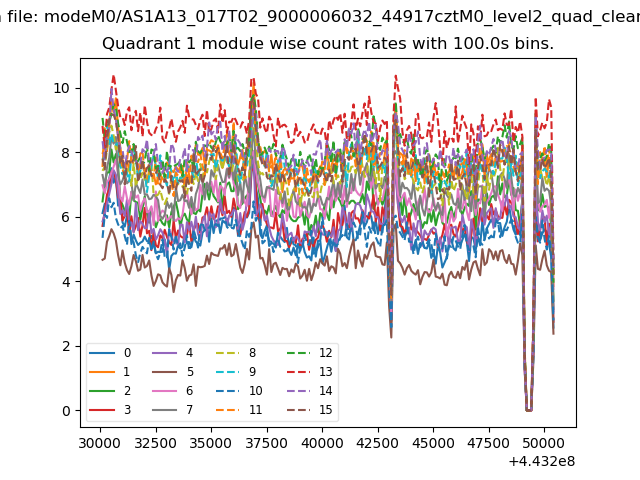
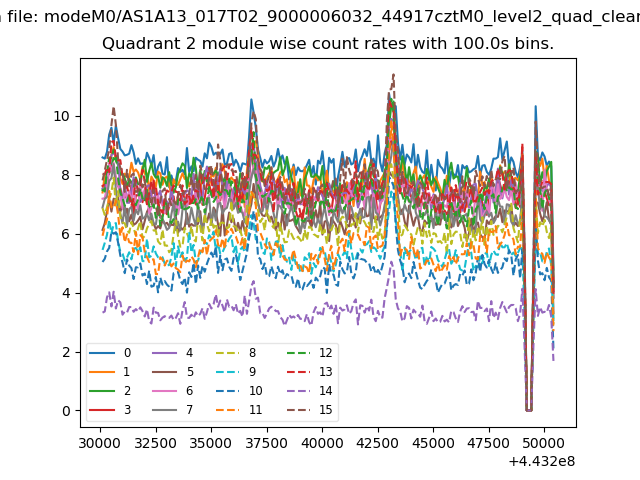
| Module-wise count rates for Quadrant A Data is divided into 100 sec bins |
 |
 |
| Module-wise count rates for Quadrant B Data is divided into 100 sec bins |
 |
 |
| Module-wise count rates for Quadrant C Data is divided into 100 sec bins |
 |
 |
| Module-wise count rates for Quadrant D Data is divided into 100 sec bins |
 |
 |
| Parameter | Plot |
|---|---|
| CZT HV Monitor | 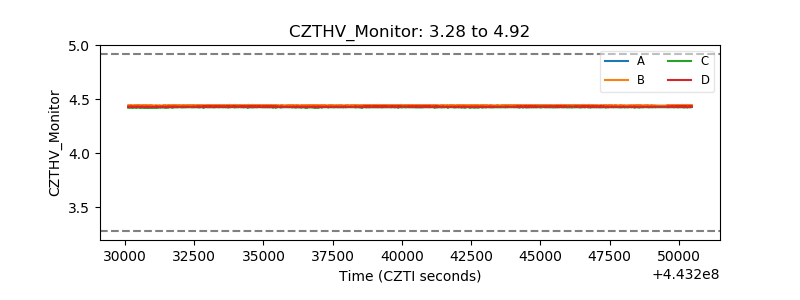 |
| D_VDD | 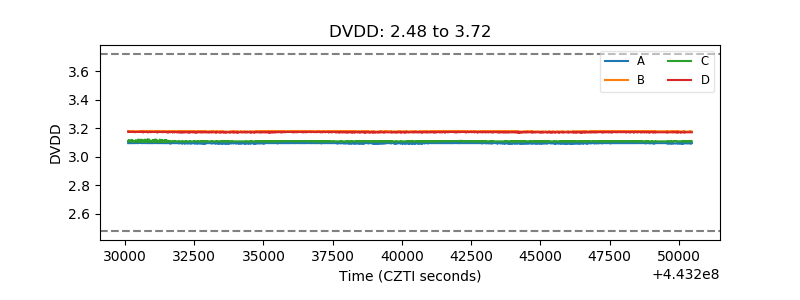 |
| Temperature 1 | 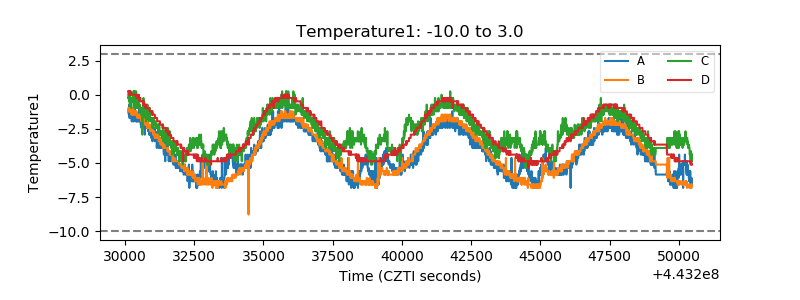 |
| Veto HV Monitor | 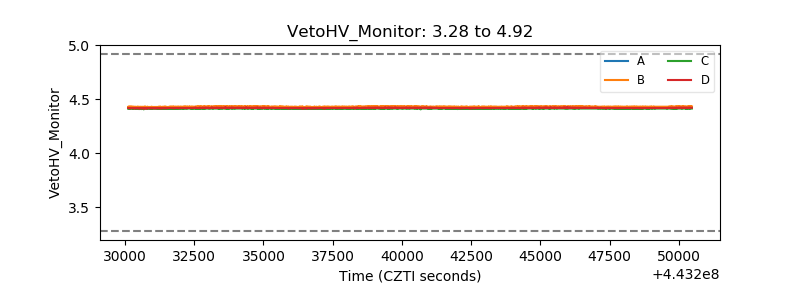 |
| Veto LLD | 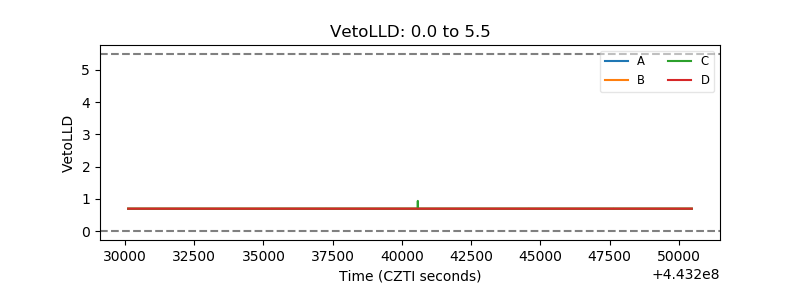 |
| Alpha Counter | 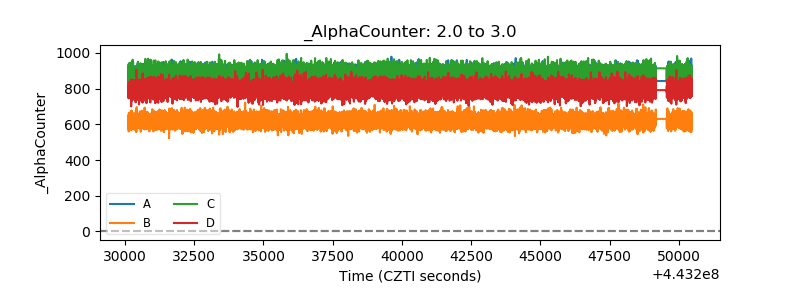 |
| _CPM_Rate | 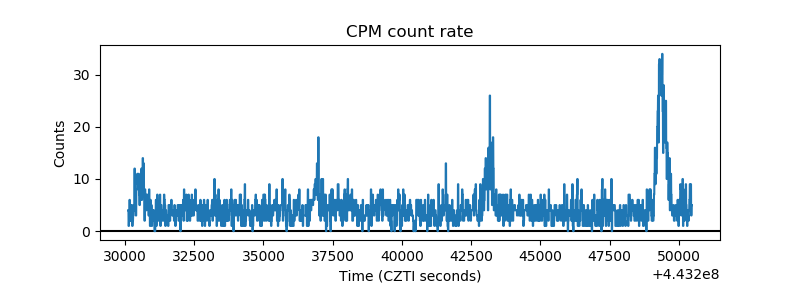 |
| CZT Counter | 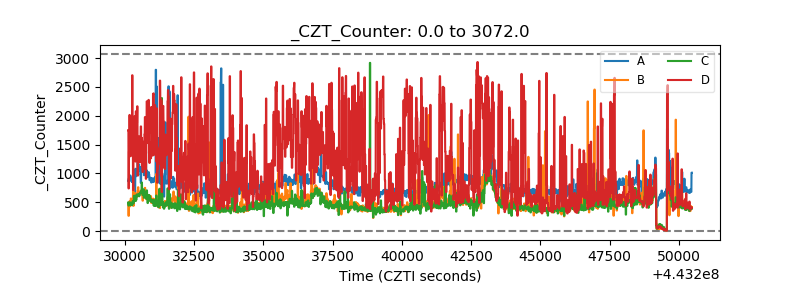 |
| +2.5 Volts monitor | 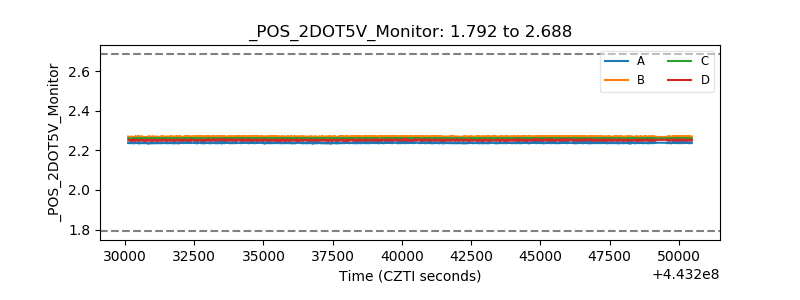 |
| +5 Volts monitor | 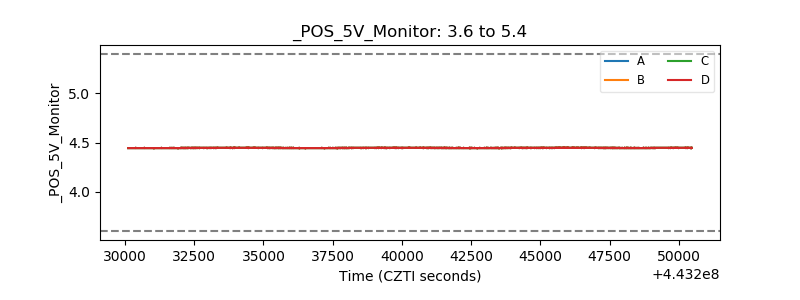 |
| _ROLL_ROT | 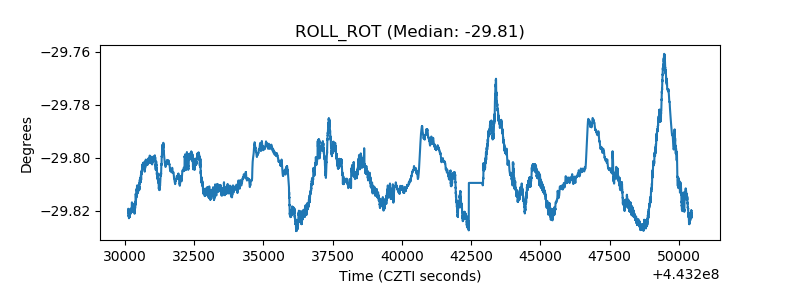 |
| _Roll_DEC | 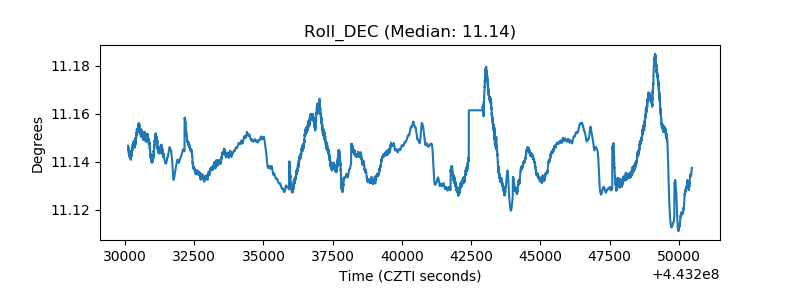 |
| _Roll_RA | 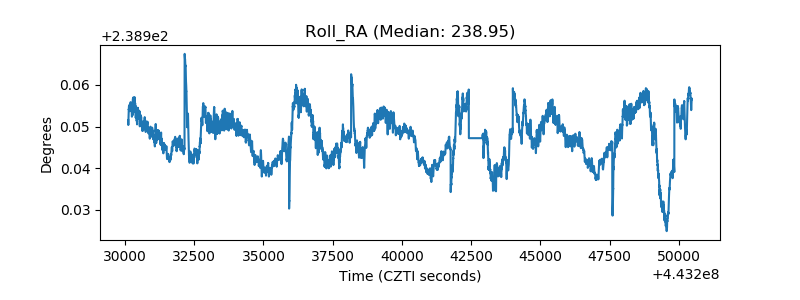 |
| Veto Counter | 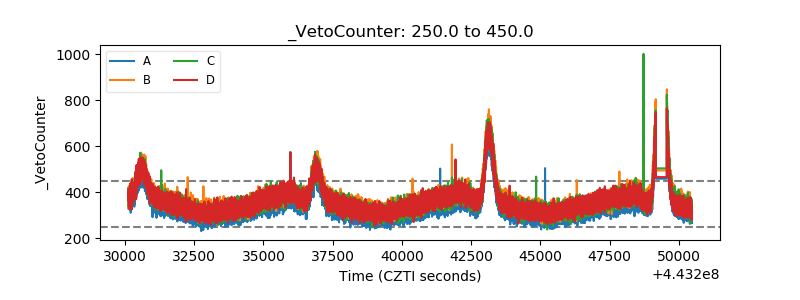 |