| Param | Original file | Final file |
|---|---|---|
| Filename | modeM0/AS1A13_017T02_9000006032_44919cztM0_level2.fits | modeM0/AS1A13_017T02_9000006032_44919cztM0_level2_quad_clean.evt |
| Size (bytes) | 451,365,120 | 105,903,360 |
| Size | 430.5 MB | 101.0 MB |
| Events in quadrant A | 5,234,528 | 702,285 |
| Events in quadrant B | 3,478,045 | 728,017 |
| Events in quadrant C | 2,949,606 | 709,118 |
| Events in quadrant D | 4,541,987 | 614,649 |
| Mode SS | |||
|---|---|---|---|
| Quadrant | BADHDUFLAG | Total packets | Discarded packets |
| A | 0 | 132 | 0 |
| B | 0 | 132 | 0 |
| C | 0 | 132 | 0 |
| D | 0 | 132 | 0 |
| Mode M0 | |||
|---|---|---|---|
| Quadrant | BADHDUFLAG | Total packets | Discarded packets |
| A | 0 | 20311 | 1 |
| B | 0 | 14614 | 1 |
| C | 0 | 13368 | 1 |
| D | 0 | 17884 | 1 |
| Mode M9 | |||
|---|---|---|---|
| Quadrant | BADHDUFLAG | Total packets | Discarded packets |
| A | 0 | 10 | 0 |
| B | 0 | 10 | 0 |
| C | 0 | 10 | 0 |
| D | 0 | 10 | 0 |
| Quadrant | Total seconds | Saturated seconds | Saturation percentage |
|---|---|---|---|
| A | 6486 | 141 | 2.173913% |
| B | 6486 | 119 | 1.834721% |
| C | 6486 | 49 | 0.755473% |
| D | 6486 | 400 | 6.167129% |
Noise dominated data is calculated using 1-second bins in cleaned event files. If a bin has >2000 counts, and if more than 50% of those come from <1% of pixels, then it is considered to be noise-dominated and hence unusable.
| Quadrant | # 1 sec bins | Bins with >0 counts | Bins with >2000 counts | High rate bins dominated by noise | Noise dominated (total time) | Noise dominated (detector-on time) | Marked lightcurve |
|---|---|---|---|---|---|---|---|
| A | 7456 | 6487 | 12 | 12 | 0.16% | 0.18% | 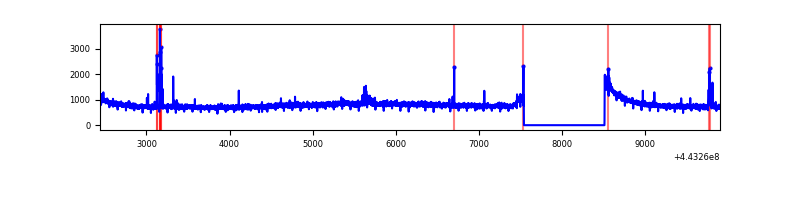 |
| B | 7456 | 6487 | 31 | 31 | 0.42% | 0.48% | 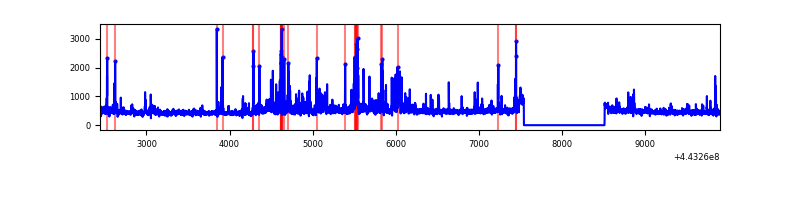 |
| C | 7456 | 6487 | 4 | 4 | 0.05% | 0.06% | 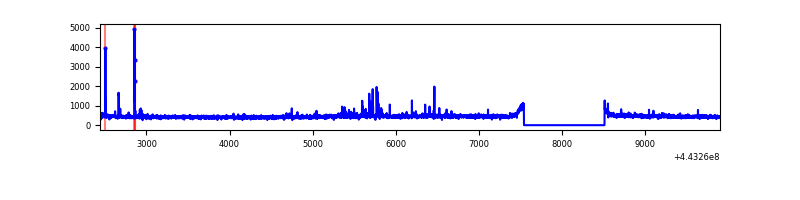 |
| D | 7456 | 6487 | 271 | 271 | 3.63% | 4.18% | 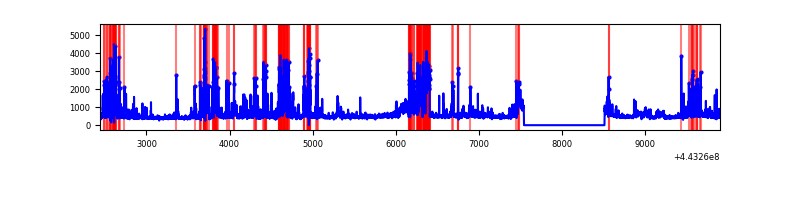 |
Top three noisy pixels from each quadrant. If the there are fewer than three noisy pixels in the level2.evt file, extra rows are filled as -1
| Pixel properties | Quadrant properties | ||||||
|---|---|---|---|---|---|---|---|
| Quadrant | DetID | PixID | Counts | Sigma | Mean | Median | Sigma |
| A | 10 | 83 | 2201403 | 14319.02 | 734 | 718 | 153.7 |
| A | 0 | 247 | 102544 | 662.54 | 734 | 718 | 153.7 |
| A | 10 | 248 | 58532 | 376.17 | 734 | 718 | 153.7 |
| B | 4 | 171 | 200158 | 1369.46 | 730 | 706 | 145.6 |
| B | 5 | 172 | 81776 | 556.64 | 730 | 706 | 145.6 |
| B | 0 | 183 | 66755 | 453.5 | 730 | 706 | 145.6 |
| C | 15 | 208 | 36164 | 208.93 | 723 | 727 | 169.6 |
| C | 1 | 3 | 28351 | 162.86 | 723 | 727 | 169.6 |
| C | 12 | 2 | 21848 | 124.52 | 723 | 727 | 169.6 |
| D | 13 | 249 | 518630 | 2915.73 | 706 | 684 | 177.6 |
| D | 2 | 249 | 392554 | 2206.0 | 706 | 684 | 177.6 |
| D | 7 | 204 | 250550 | 1406.6 | 706 | 684 | 177.6 |
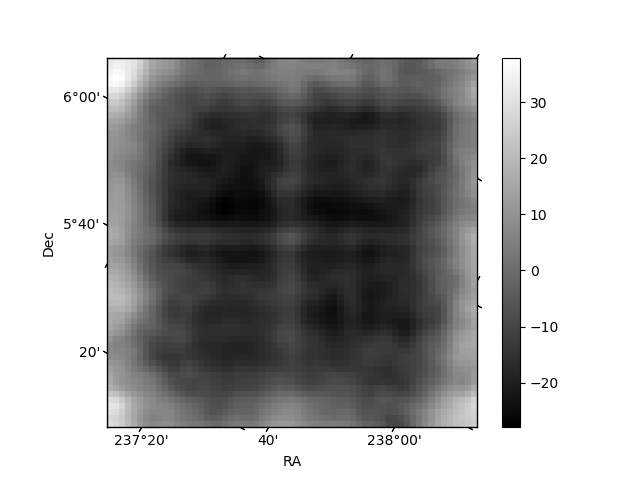
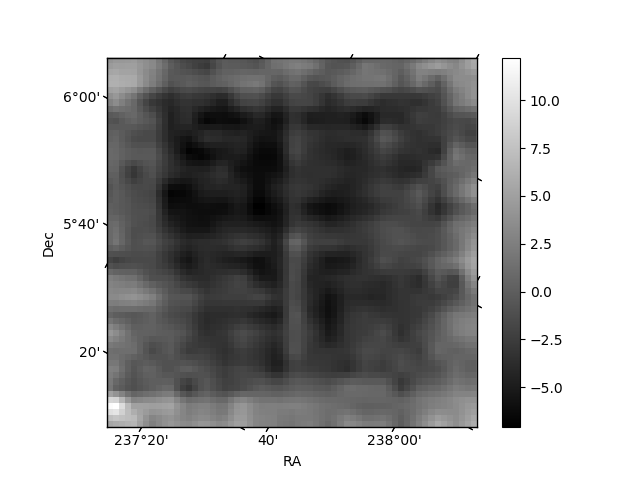
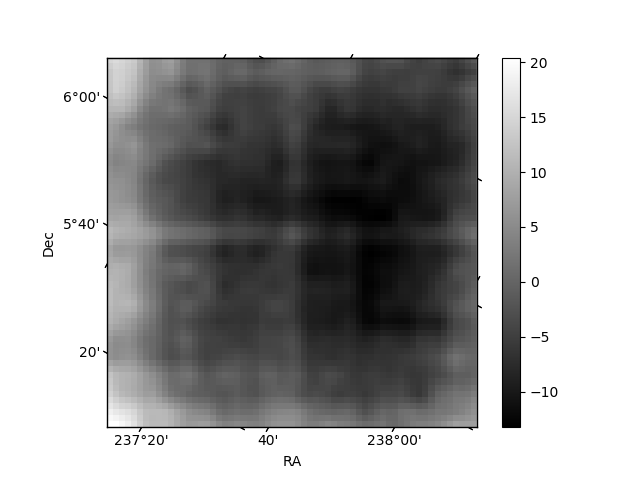
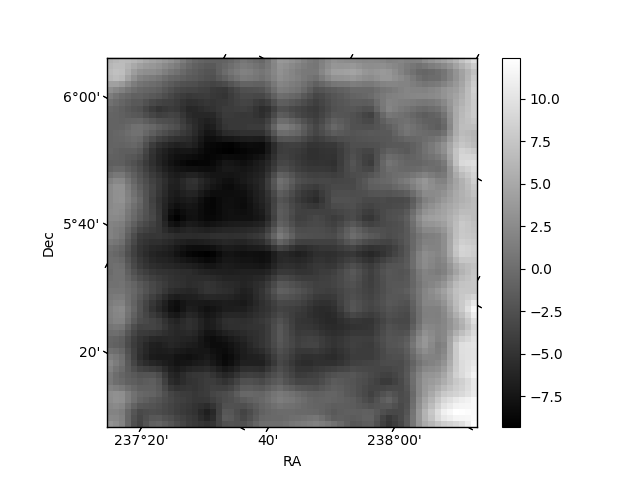
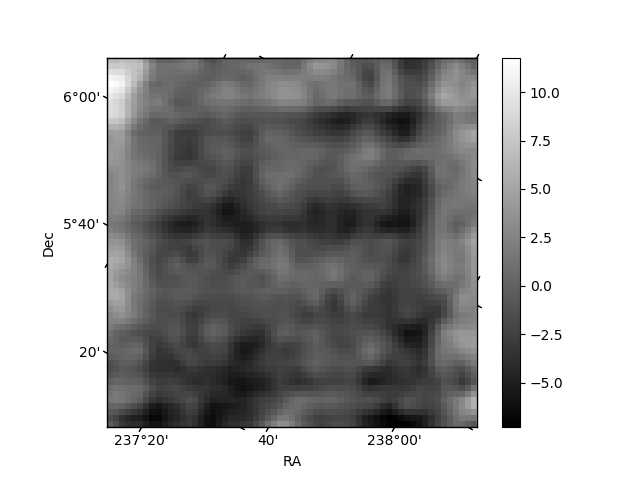
Histogram calculated using DETX and DETY for each event in the final _common_clean file
| Quadrant A | 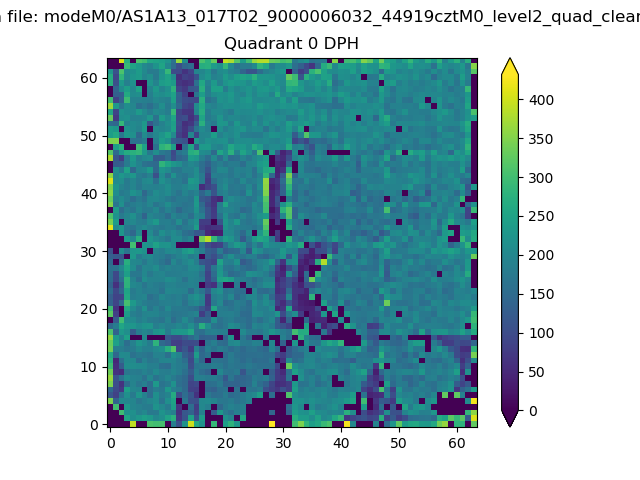 |
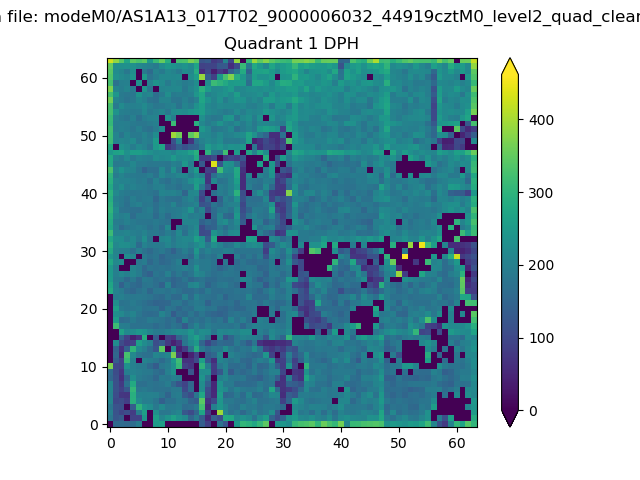 |
Quadrant B |
|---|---|---|---|
| Quadrant D | 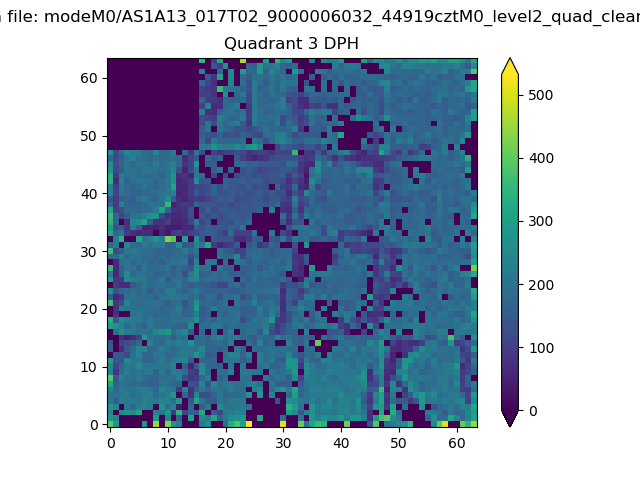 |
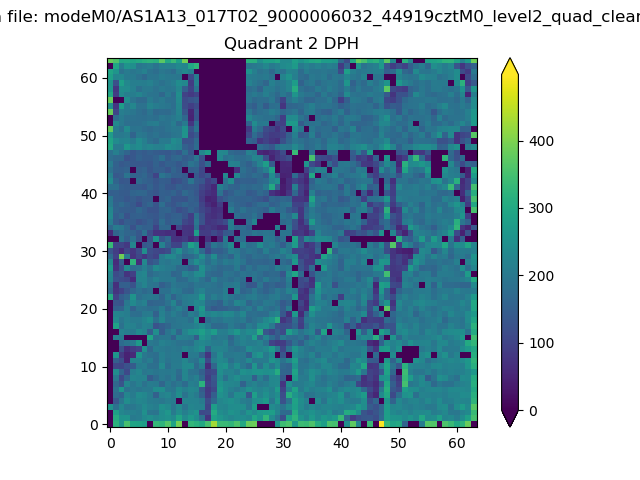 |
Quadrant C |
| Plot type | Count rate plots | Images |
|---|---|---|
| Comparison with Poisson distribution Blue bars denote a histogram of data divided into 1 sec bins. Red curve is a Poisson curve with rate = median count rate of data. |
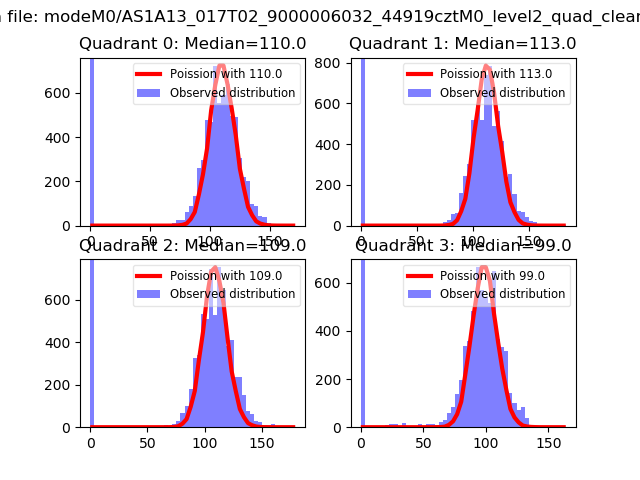 |
 |
| Quadrant-wise count rates Data is divided into 100 sec bins |
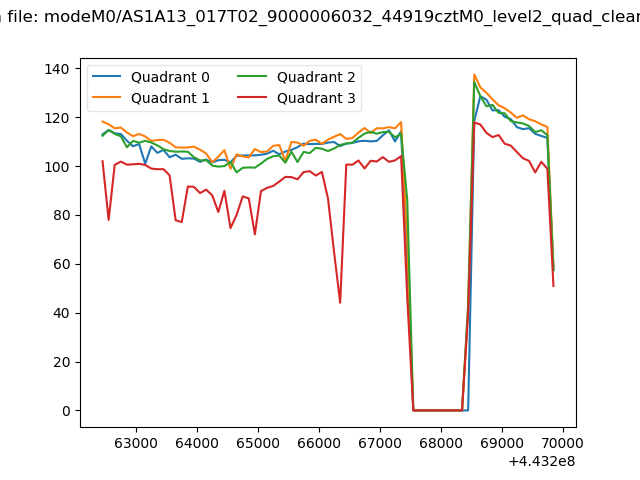 |
|
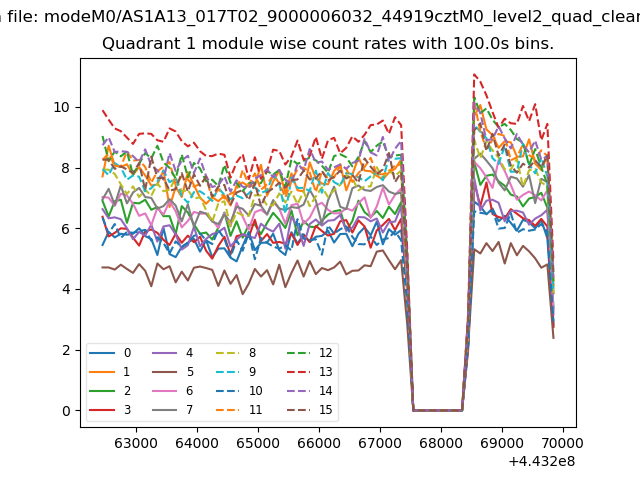
| Module-wise count rates for Quadrant A Data is divided into 100 sec bins |
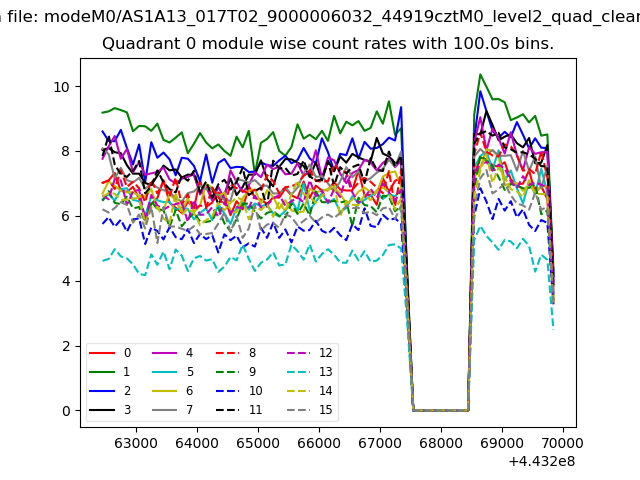 |
 |
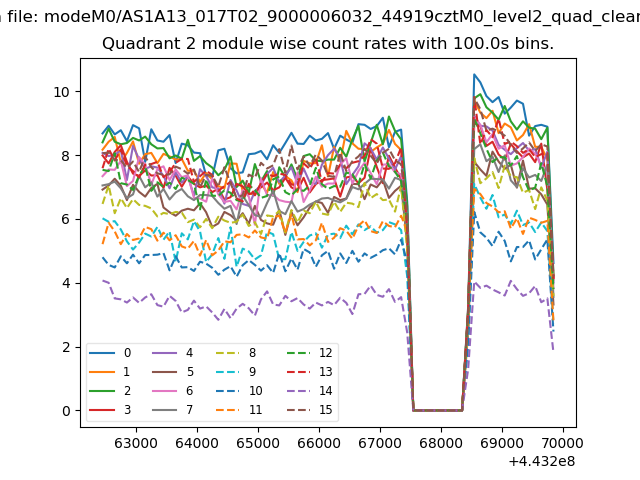
| Module-wise count rates for Quadrant B Data is divided into 100 sec bins |
 |
 |
| Module-wise count rates for Quadrant C Data is divided into 100 sec bins |
 |
 |
| Module-wise count rates for Quadrant D Data is divided into 100 sec bins |
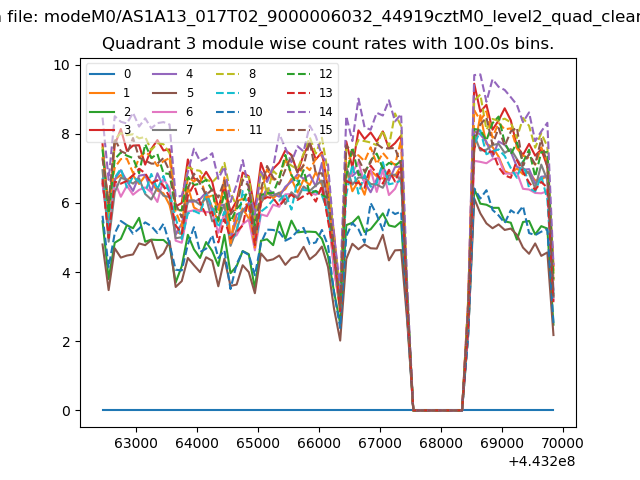 |
 |
| Parameter | Plot |
|---|---|
| CZT HV Monitor | 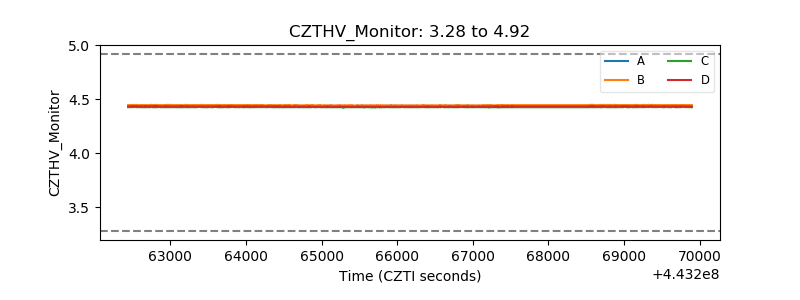 |
| D_VDD | 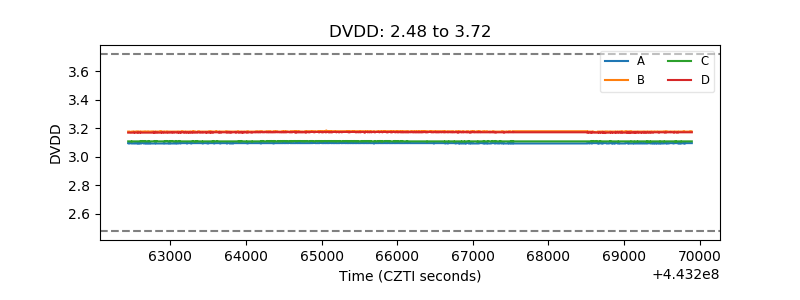 |
| Temperature 1 | 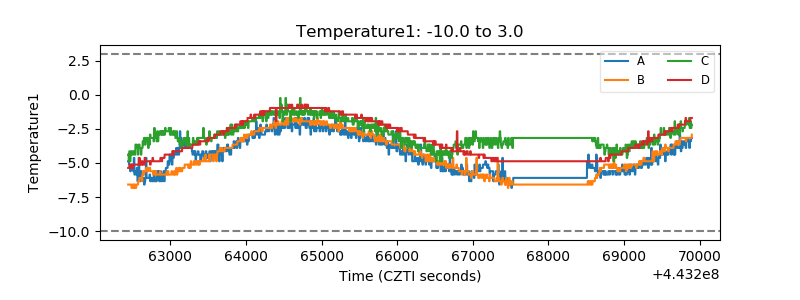 |
| Veto HV Monitor |  |
| Veto LLD | 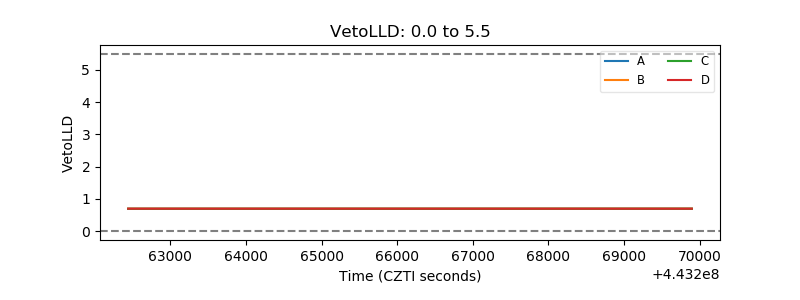 |
| Alpha Counter | 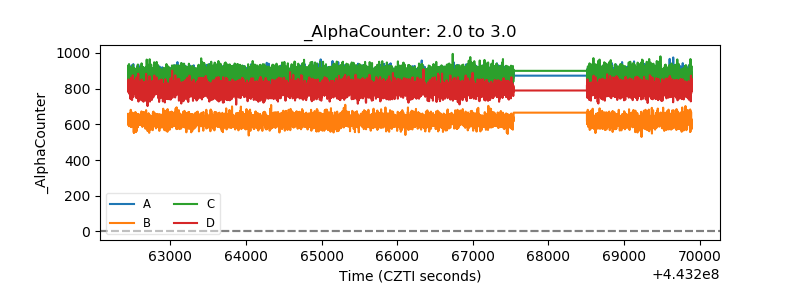 |
| _CPM_Rate | 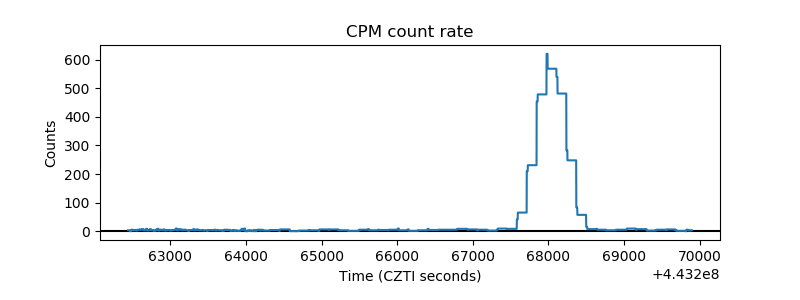 |
| CZT Counter | 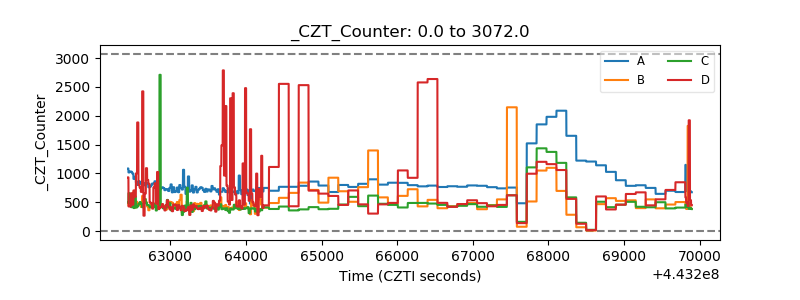 |
| +2.5 Volts monitor | 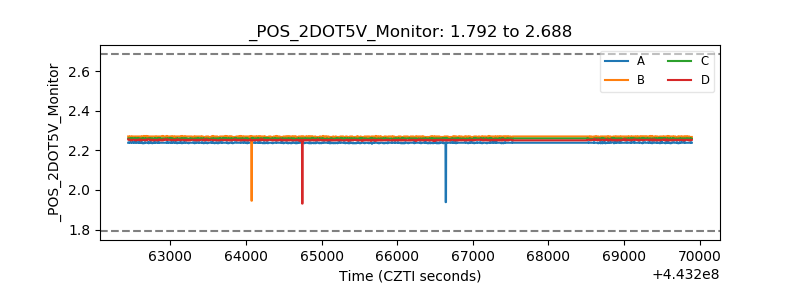 |
| +5 Volts monitor | 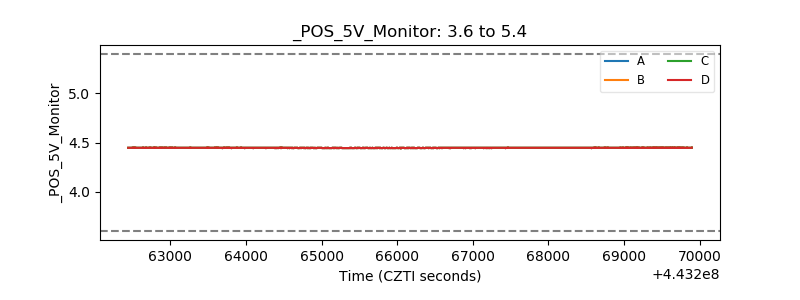 |
| _ROLL_ROT | 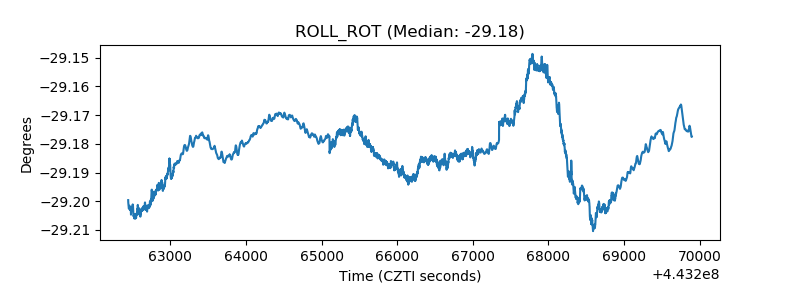 |
| _Roll_DEC | 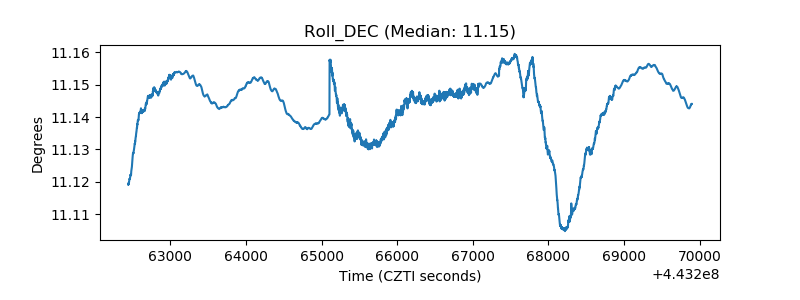 |
| _Roll_RA | 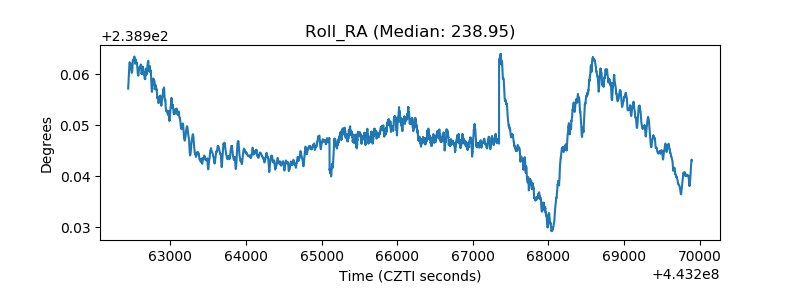 |
| Veto Counter | 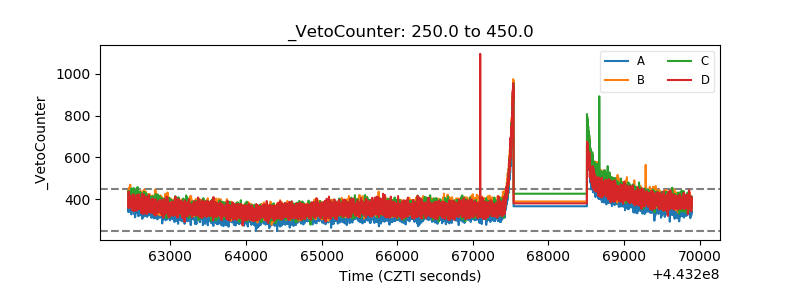 |